Close
0%
0%

SERPENTINE

Hand Gesture Recognition
using Self-Powered Stretchable Squeezable Force Sensor
based on Triboelectric Nanogenerators Principle

Public Chat
Similar projects worth following
Rethinking about the materiality of tangible input interfaces and reinforcing them with sensing capabilities is the intent of our innovative approach in this research. We have invented Serpentine, a highly stretchable self-powered sensing interface empowered with signal processing for gesture recognition.

Team Members:
Fereshteh Shahmiri, Chaoyu Chen, Shivan Mittal, Anandghan Waghmare, Dingtian Zhang

Collaborators:
Yi-cheng Wang, Steven Zhang

Advised By:
Dr. Gregory Abowd, Dr. Thad Starner, Dr. Z.L. Wang

Project Description - Challenges and Our Solution

Wearable computing has developed from a niche to a sizable consumer market that has seen substantial uptake in most recent years. With such popularity comes the opportunity for streamlining input to wearable and mobile computing devices. The traditional means of interaction, such as mouse and keyboard, are typically not very well suited for miniaturized mobile and wearable devices due to the small size. Hence more effective input means need to be developed that are both convenient for the user and reliable to process automatically. Our research focuses on developing such new input technologies using Serpentine.

Serpentine, a self-powered sensor that is a reversibly deformable cord capable of sensing a variety of natural human input. The material properties and structural design of Serpentine allow it to be flexible, twistable, stretchable and squeezable, enabling a broad variety of expressive input modalities.

Serpentine is fabricated in a coil-shaped structure with multiple coaxial layers of silicone, copper and conductive nylon thread. Its structural design and specific choice of materials allow mechanical deformations of the interface that create time-varying charge distributions between the conductive nylon and PVA coated copper thread, which generate electrical signals. Such signal generation happens based on triboelectric nanogenerator (TENG) phenomenon that works on the conjunction of electrostatic induction and triboelectrification. Since, the deformations and consequently, charge distributions lead to power generation, the working principle itself eliminates the need of external power to sense deformations caused by gestural interactions. Self-generated signals are then processed through an implemented system including signal processing pipeline that uniquely maps them to actions that created the deformations. Our system enables us fulfill our vision to create an interface that is not only self powered but also sensitive to a wide range of expressive input modalities.

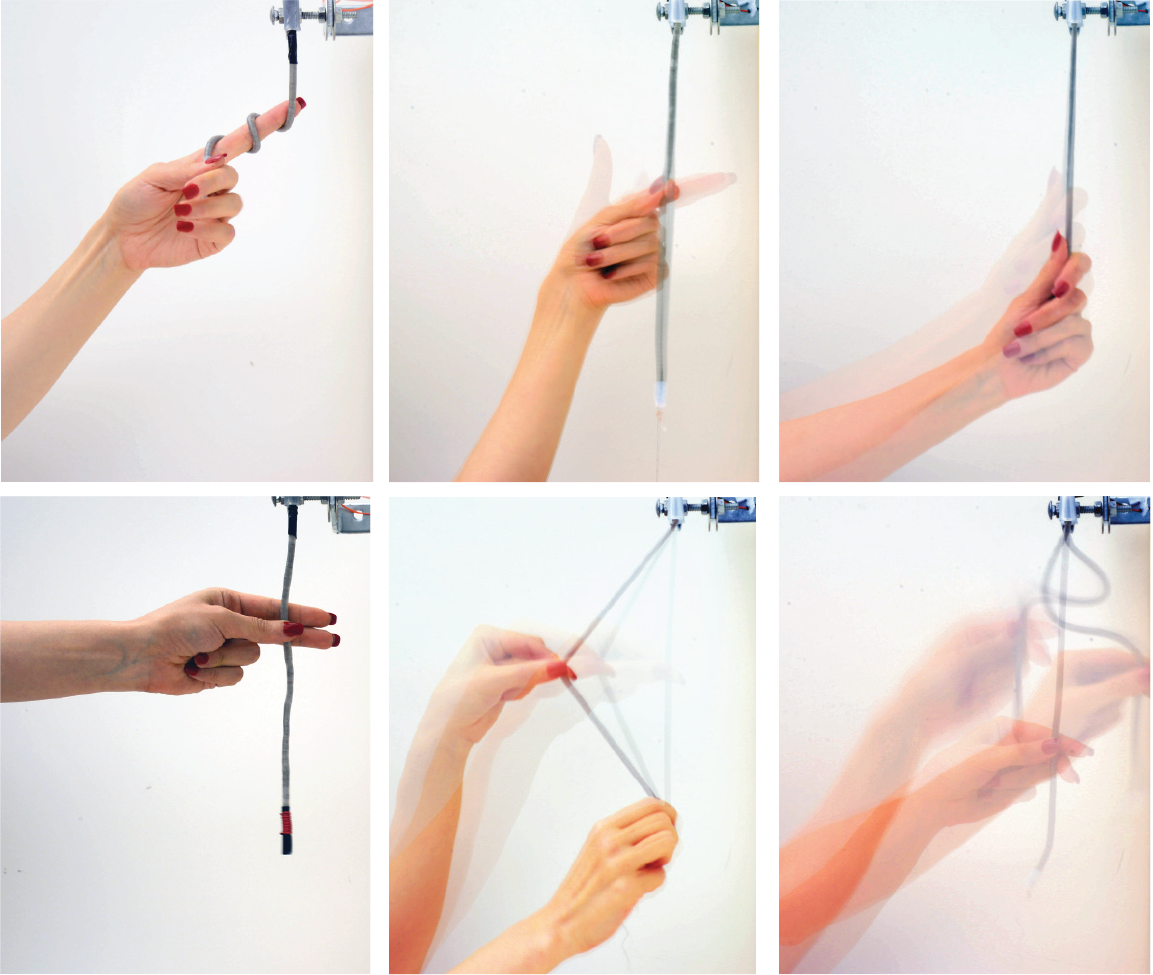
The simplicity of the physical structure of the sensor, universal availability of tribo-materials (all materials available in our daily life like paper, fabric, PDFE, PDMS and many more) and DIY approach for its constructions allow such a sensing interface to be scaled for variety of applications. Serpentine eliminates the need of bulky or rigid sensing instruments worn on different parts of the body. It’s specific material properties, form-factor and physical structure affords six natural gestures - pluck, twirl, stretch, pinch, wiggle and twist. Serpentine demonstrates the novel ability to simultaneously recognize these inputs through a single physical interface.

Our system is capable of accurate real-time gesture detection, which works well for both user-dependent and user-independent models. We cannot disclose the final experimental results, quantitative or qualitative results, obtained for Serpentine, as they are under review by the honorable scientific community presiding at the CHI Conference 2019. Upon acceptance, all results will be added to Hackaday 2018 project web page.

SERPENTINE - Working Prototype, Fabrication Process Sensing Mechanism and Gesture Recognition

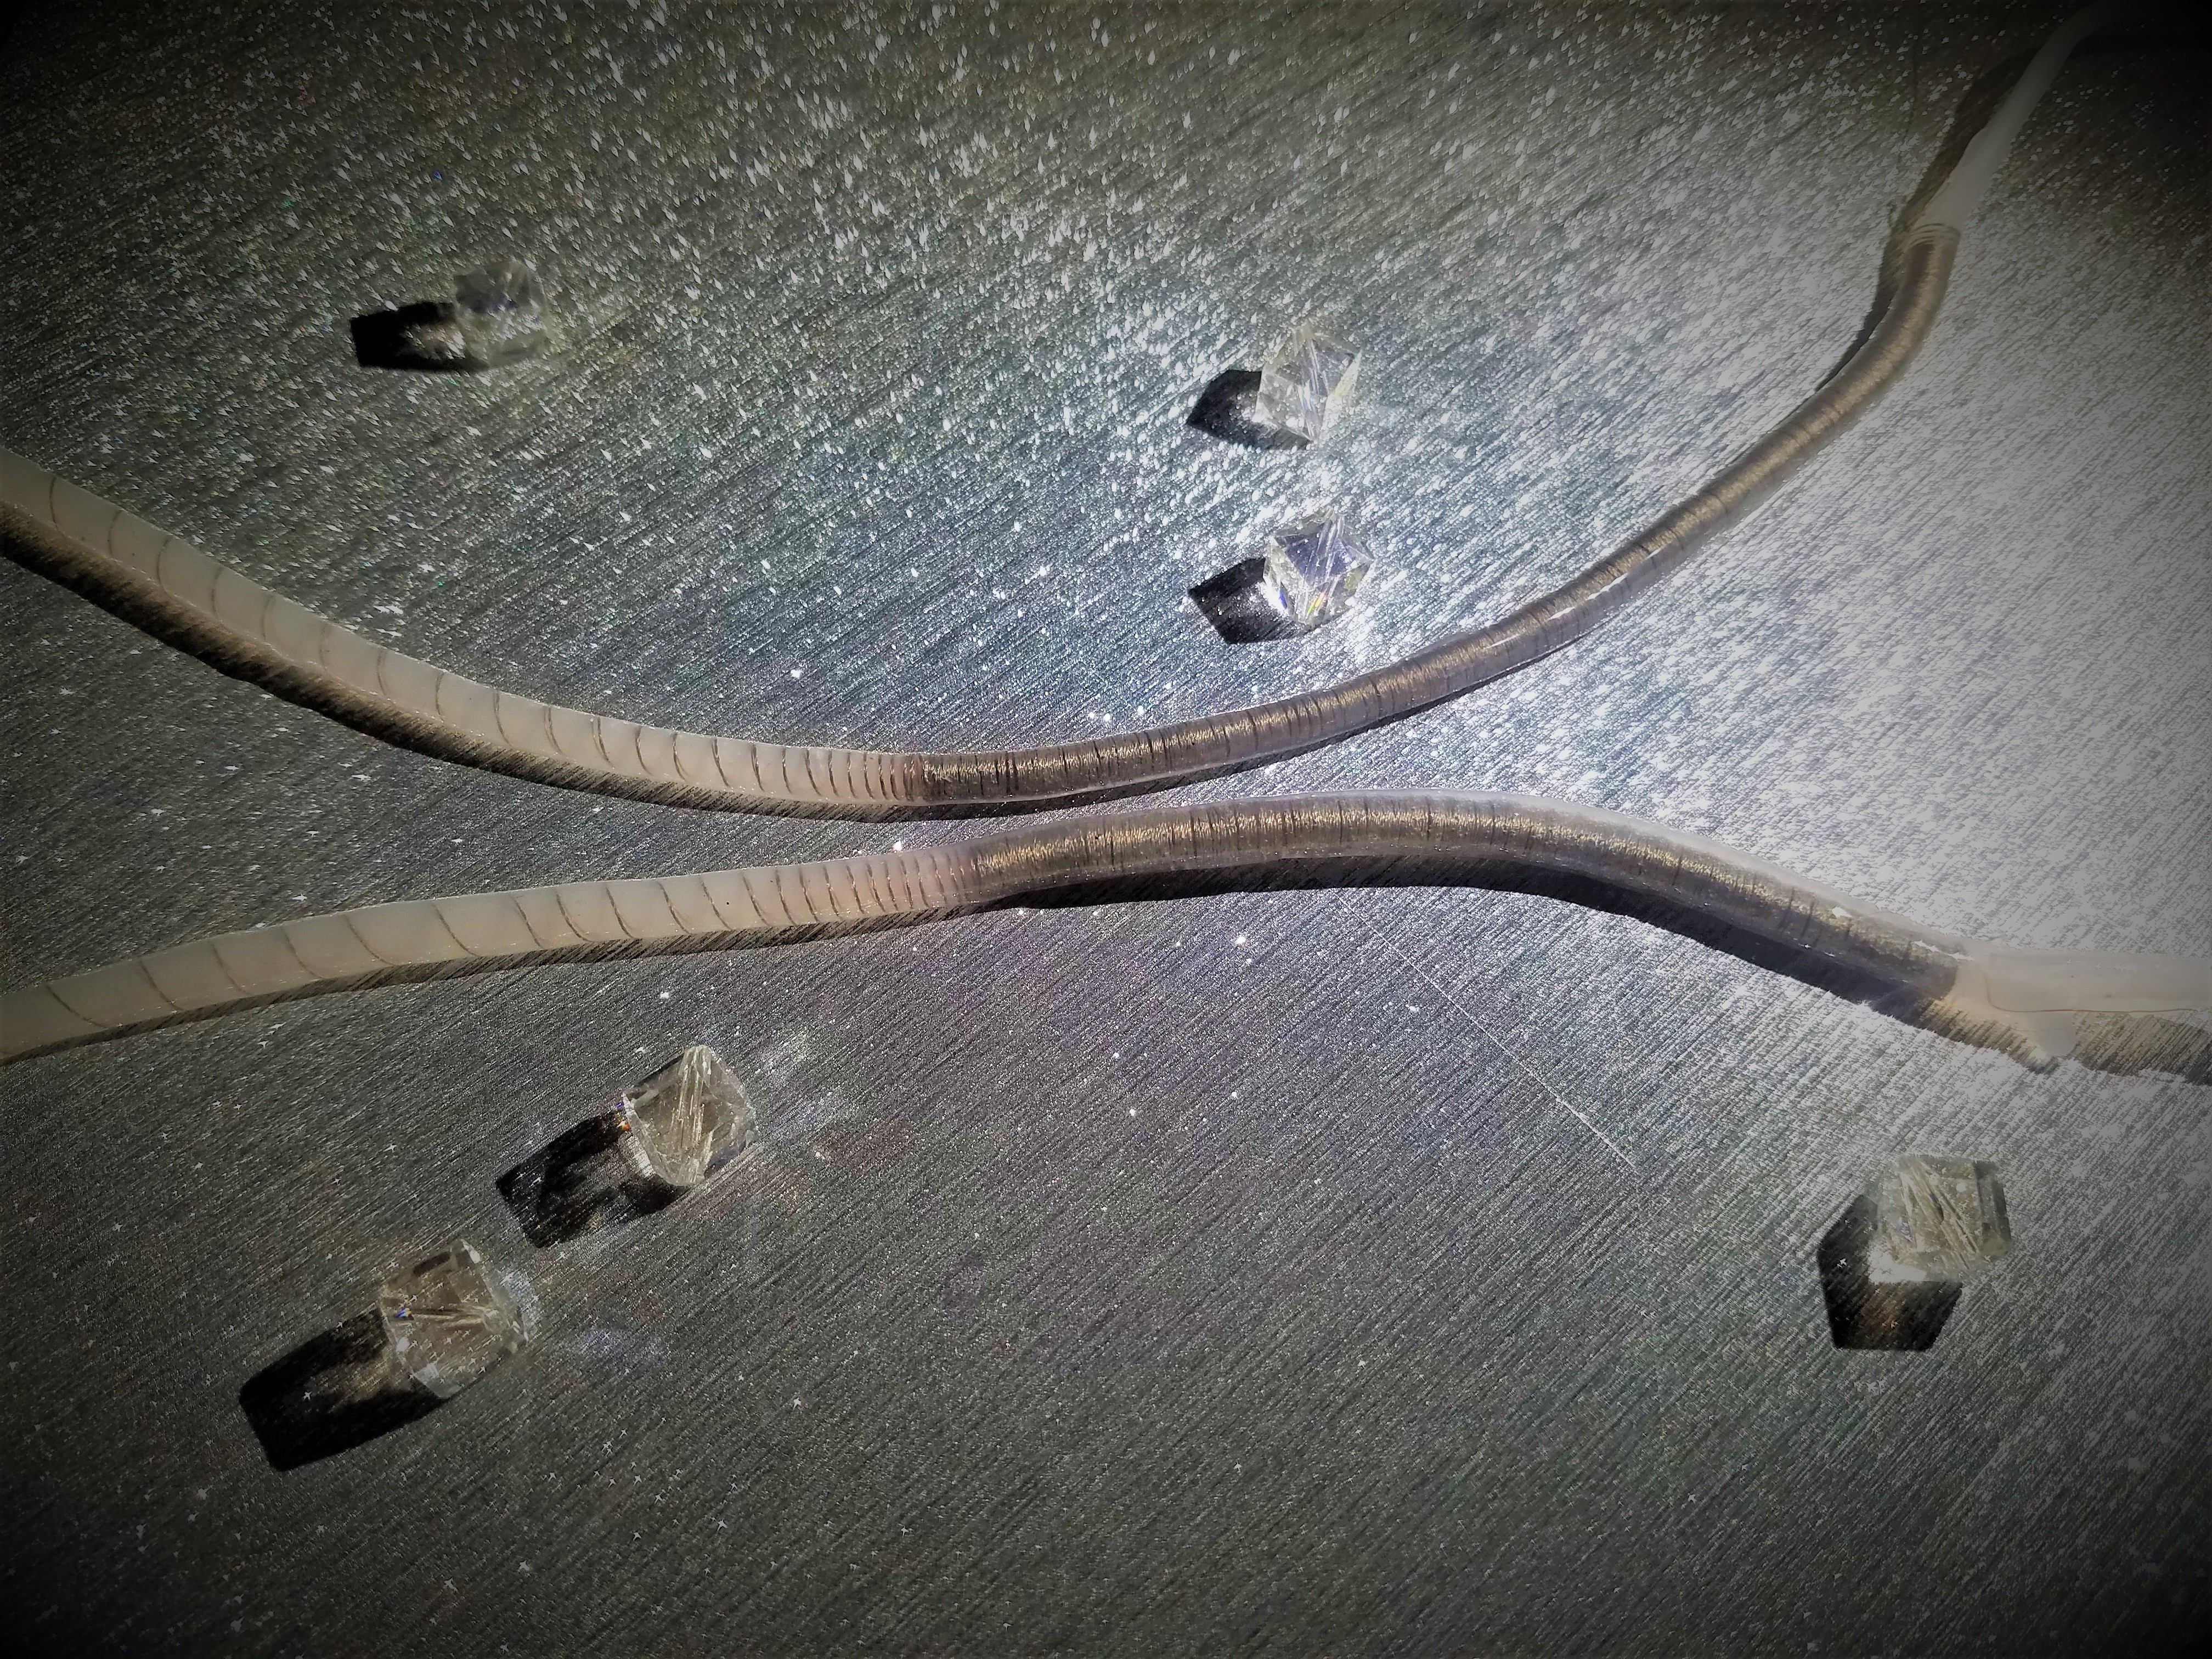
Final Appearance of the Sensor
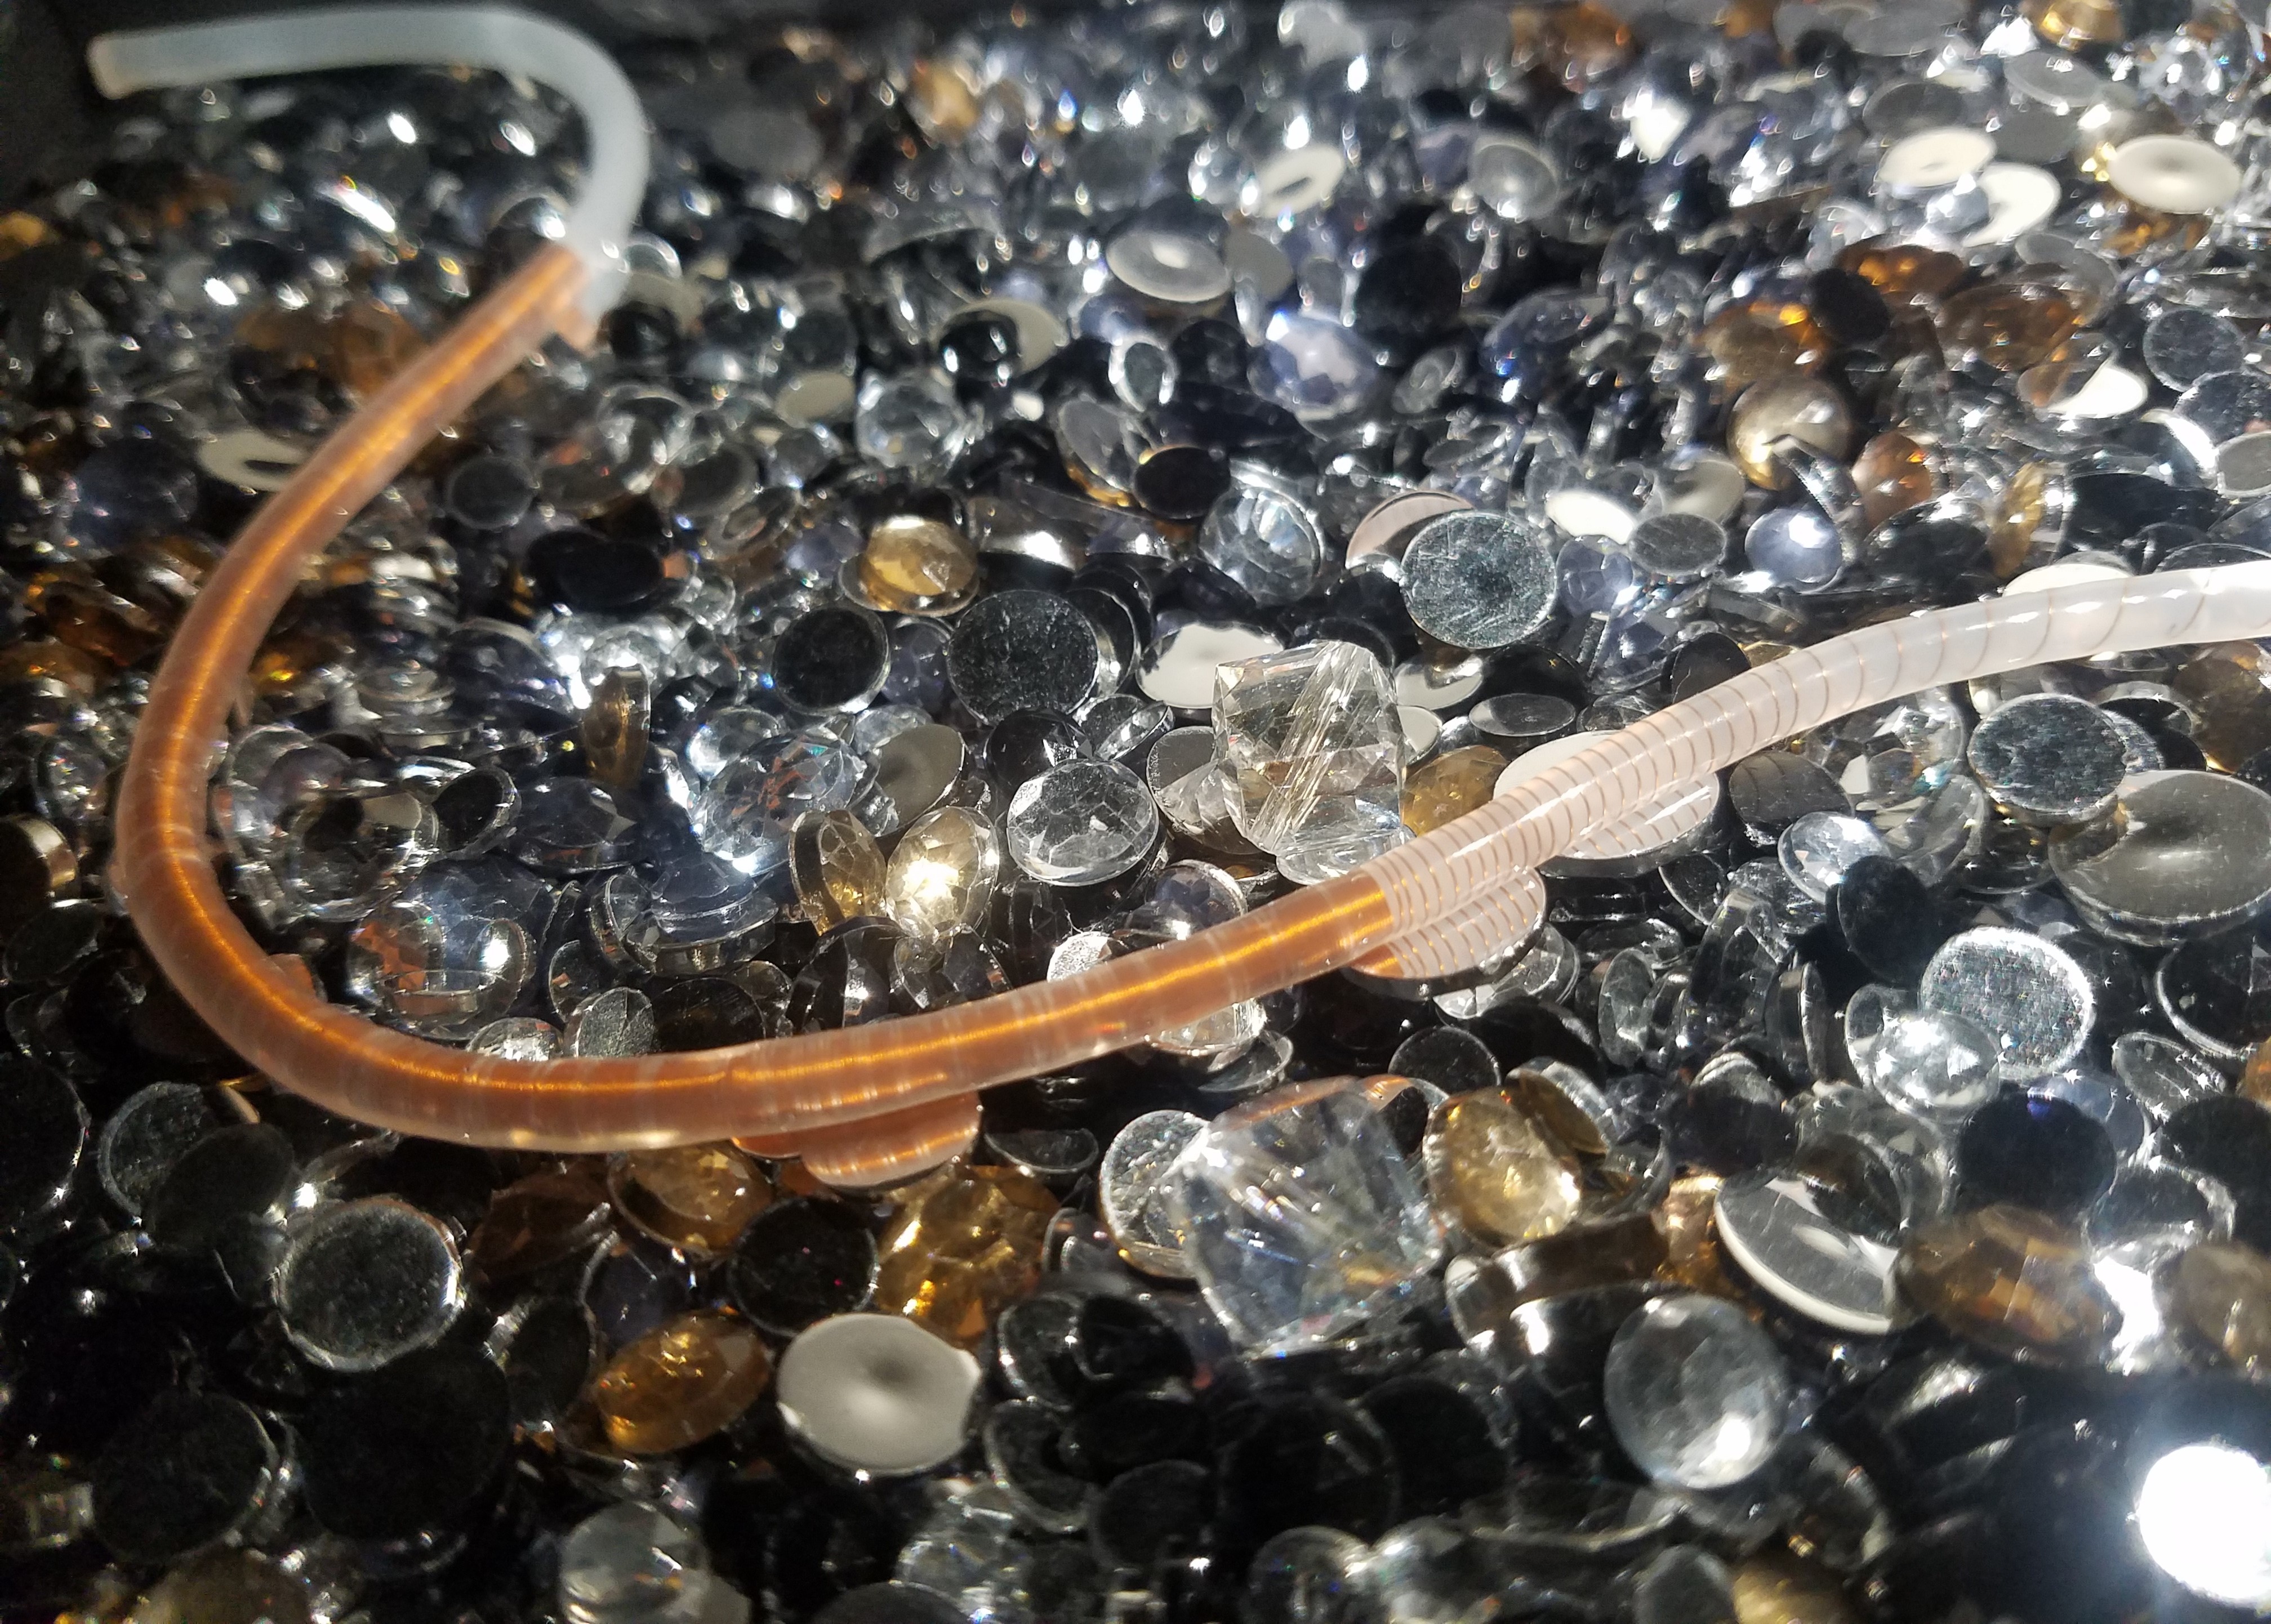
Self-powered Stretchable Coil-Shape Vibration Sensing Interface - Single Electrode  ( Copper Wire encapsulated with silicone as dielectric) Mechanism based on TENG Principles
Self-powered Stretchable Coil-Shape Vibration Sensing Interface - Double Electrode ( Copper Wire & Nylon thread encapsulated with silicone as dielectric) Mechanism based on TENG Principles


  • 1 × Hardware - Sensing User Interface - Vibration Sensor Check material for sensor fabrication in instruction part
  • 1 × Adafruit Feather M0 WiFi with ATWINC1500 Hardware - Circuit Design and Micro Controller
  • 1 × INA118 Precision, Low Power Instrumentation Amplifier Hardware - Circuit Design and Micro Controller
  • 4 × Resistor Hardware - Circuit Design and Micro Controller
  • 1 × Analog Discovery 2 (for data acquisition)

  • Bill of Materials for ​One Unit

    fereshteh10/22/2018 at 10:42 0 comments

    • Sensor Cost - $10.00 

    Fabricated sensor based on described fabrication process (for a double electrode sensor based on silicone rubber as a dielectric and Nylon and Copper conductive threads; with 30 cm length and 4.5 mm thickness) 

    • Adafruit Feather M0 WiFi - ATSAMD21 + ATWINC1500 - $37.99

    https://www.amazon.com/Adafruit-PID-3010-Feather-WiFi/dp/B01F6GJVL6/ref=sr_1_3?ie=UTF8&qid=1540204647&sr=8-3&keywords=adafruit+feather+M0+WiFi+with+ATWINC1500

    • INA118 Precision, Low Power Instrumentation Amplifier - $11.67

    https://www.mouser.com/ProductDetail/Texas-Instruments/INA118P?qs=VBduBm9rCJTJMgcSbr%252bM%252bQ%3D%3D&gclid=Cj0KCQjw6rXeBRD3ARIsAD9ni9C3wY6Uro_xkxsNHuSIuQyfxbPeThtIQzHCaPhHMIYJVrYt1NKaAtoaAusQEALw_wcB

  • Next Step: Self-Powered Wireless Communication

    fereshteh10/22/2018 at 08:58 0 comments

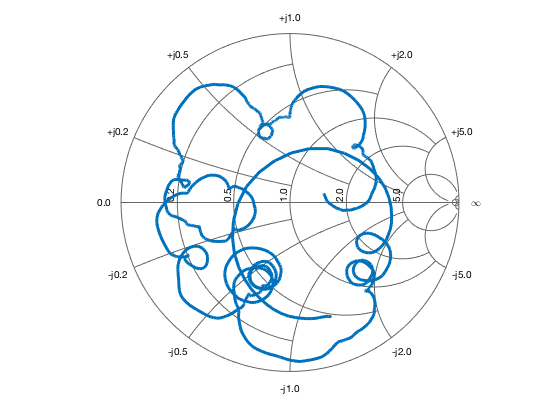
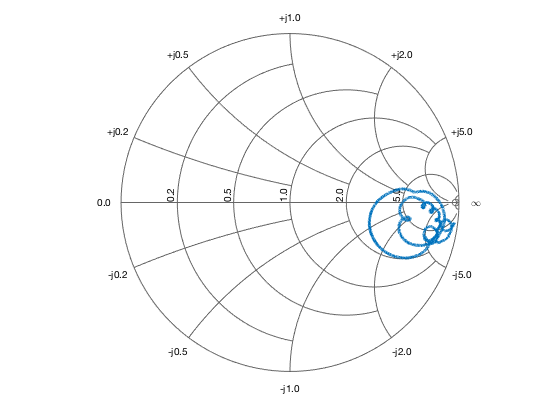
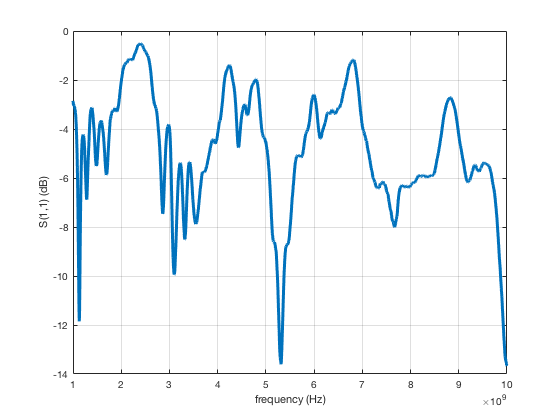
    Comprised of helical conductors, our sensor may also be used as an antenna. To explore its antenna nature, we experimentally measured the S11 antenna characteristic from 30MHz to 10GHz (Upper bound chosen because of the limitation of the measuring equipment) and plotted the results on a Impedance Smith Chart. The best S11 parameter value obtained after first few runs of the experiments was 0.2072 at 10.0 GHz, which implies that about 80% of power delivered to the antenna is transmitted out, or used up internally. It is our ongoing research to optimize this antenna nature of Serpentine and build a system for self-powered sensing and self-powered wireless communication.
    Using Serpentine not only as an self-powered sensing interface but also as a self-powered antenna for communication could revolutionize the way humans interact with computing devices. Interactions themselves shall be sufficient to generate electrical signals for sensing and simultaneous wireless communication without external power source or sensing and communicating instruments.
    Today batteries are omnipresent in computing devices for sensing and communication. However, battery replacement and disposal burdens the environment, and such battery use is not sustainable.
    Nonetheless, with Serpentine we shall soon eliminate the need of such external sources of power, thus, developing a self-sustaining system which is environmentally clean, and  may be incorporated into ubiquitous computing devices.

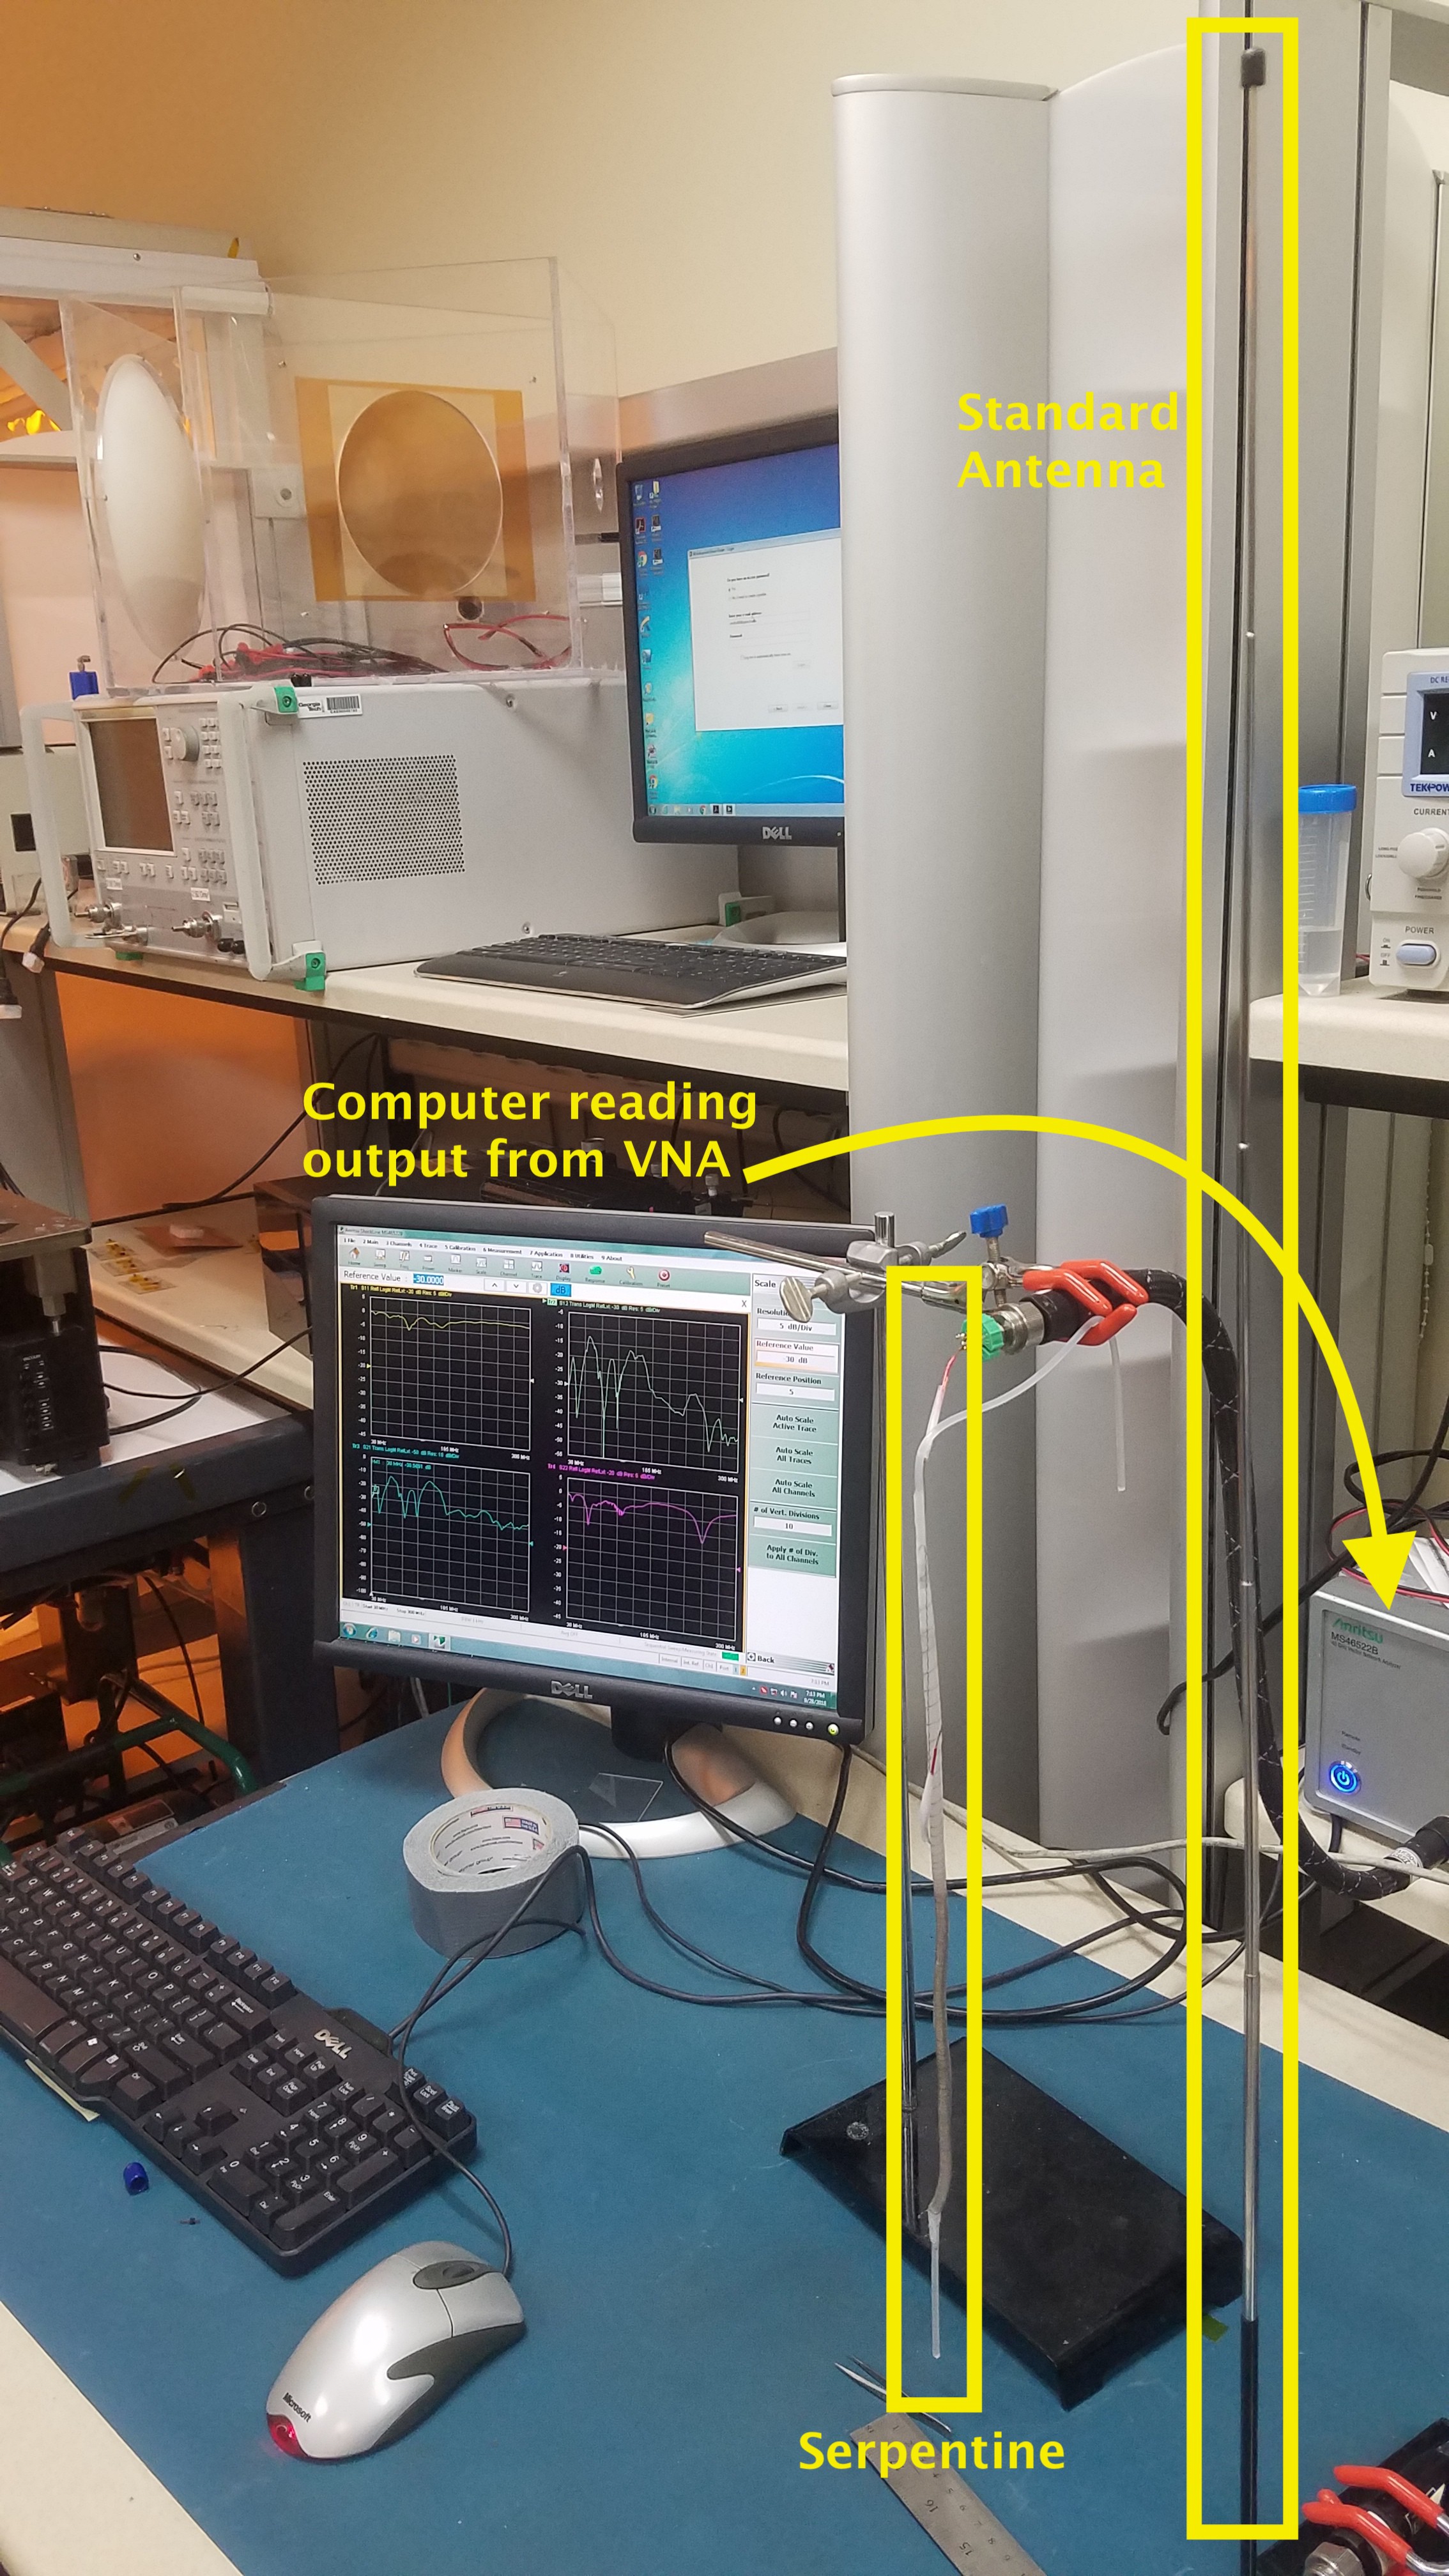
    Experiment Setup
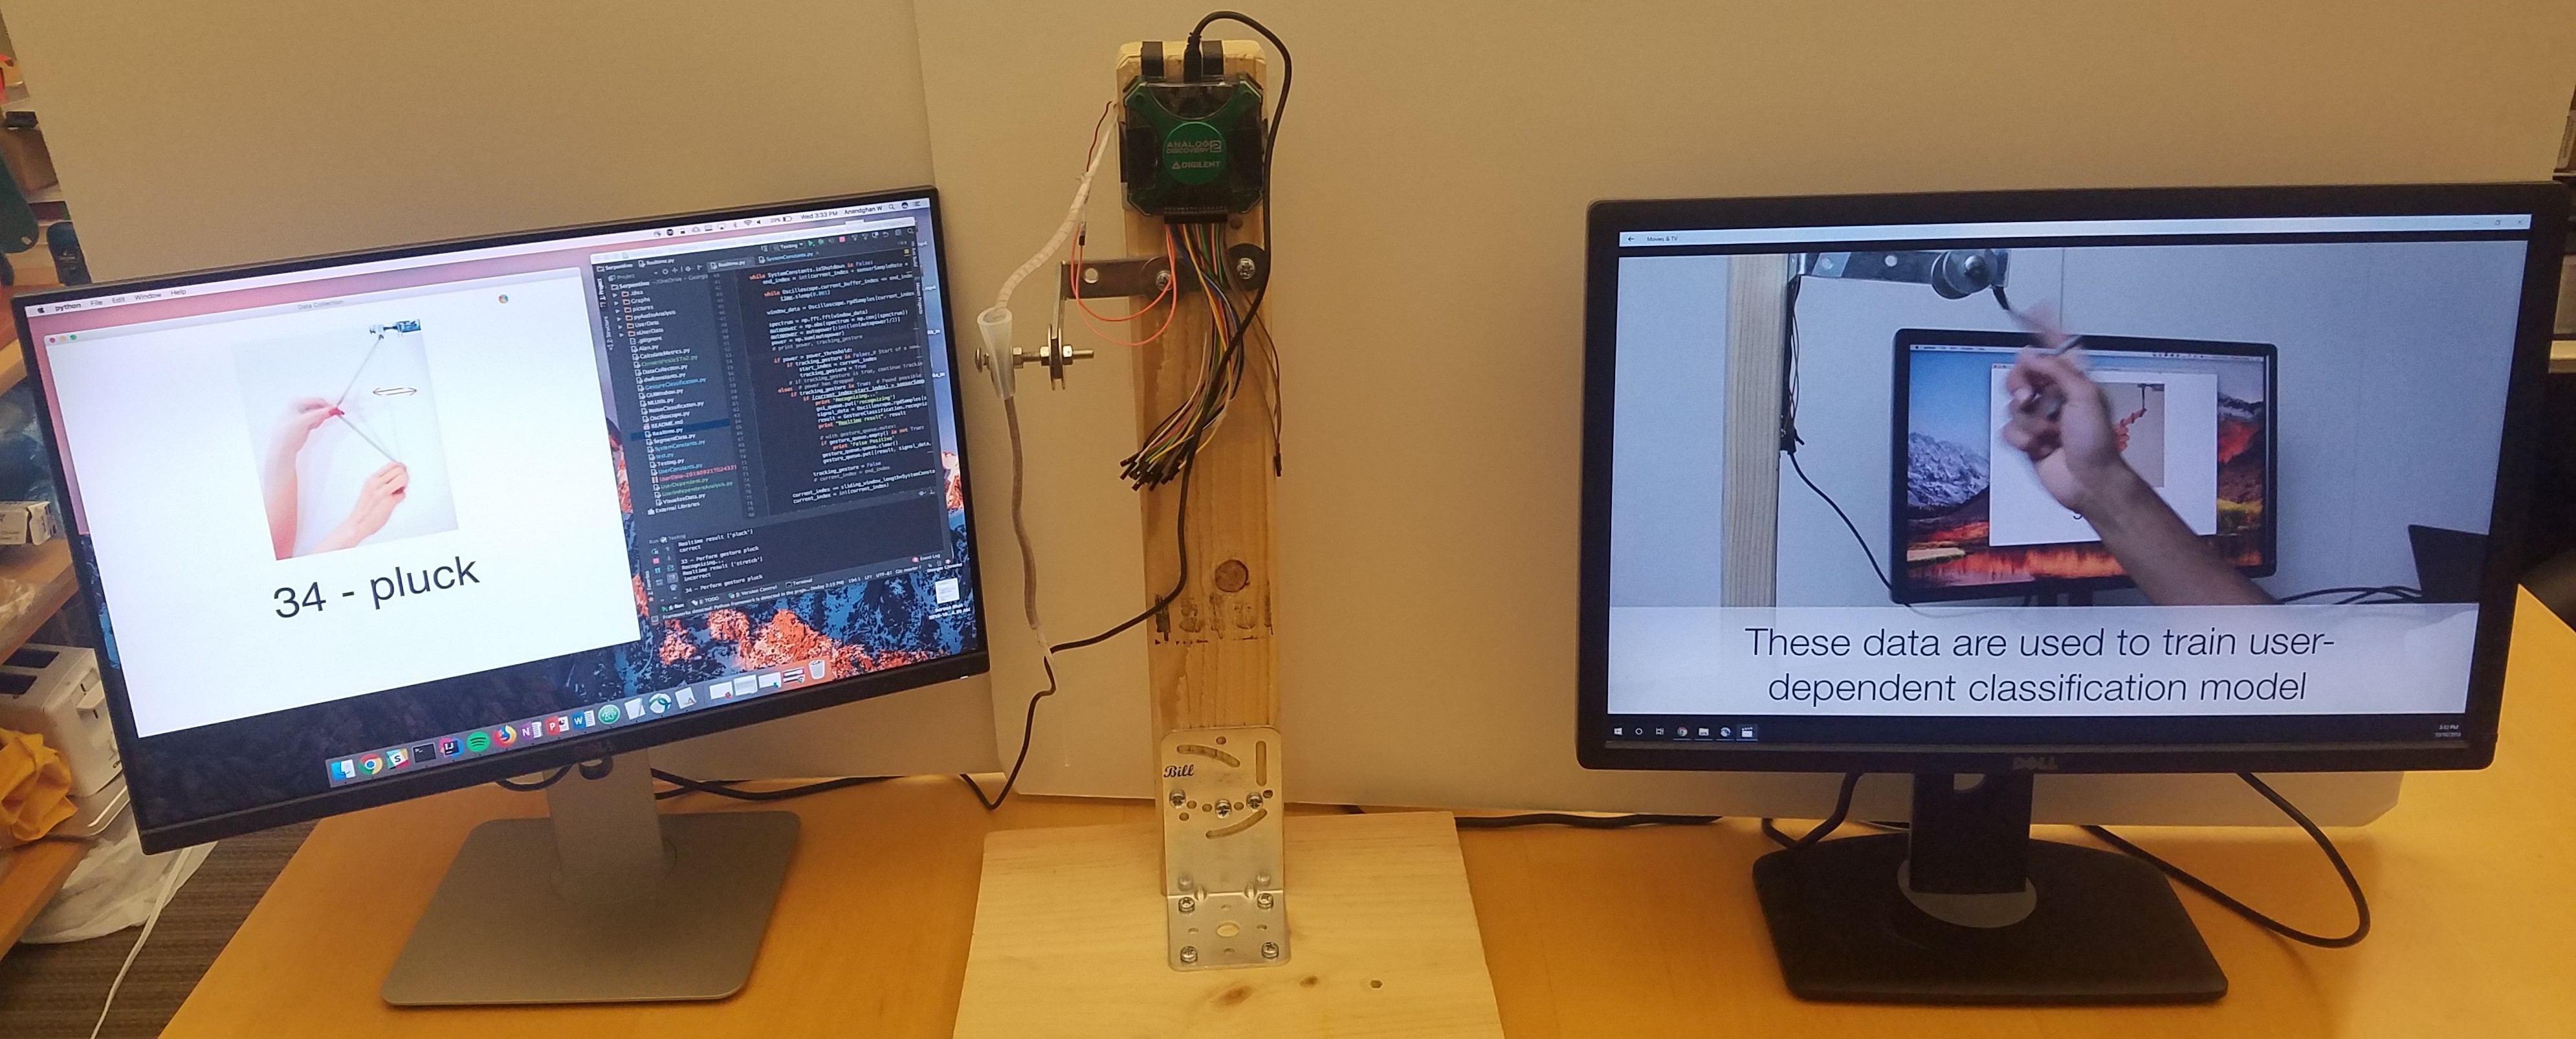
    The image illustrates the experimental setup for the measurement of S11 antenna parameter.
    Smith Chart
    Impedance Smith Chart for S11 parameter of Serpentine as an antenna. Frequencies range from 1 GHz to 10 GHz.
    Smith_Chart_MHz
    Impedance Smith Chart for S11 parameter of Serpentine as an antenna. Frequencies range from 30 MHz to 300 MHz.
    S11_GHz
    S11 Parameter vs. Frequency of Serpentine as an antenna. Frequencies range from 1 GHz to 10 GHz.

    S11_MHz
    S11 Parameter vs. Frequency of Serpentine as an antenna. Frequencies range from 30 MHz to 300 MHz.

  • Gesture Recognition Result

    fereshteh10/22/2018 at 08:51 0 comments

    For real-time gesture detection accuracy, the classifier works both as user-dependent and user-independent models. We can not disclose the final experimental results, quantitative or qualitative results, obtained for Serpentine, as they are under review by the honorable scientific community presiding at the CHI Conference 2019.Upon acceptance, all results will be added to Hackaday 2018 project web page.

  • Data Collection and Classification Pipeline

    fereshteh10/22/2018 at 08:38 0 comments

    Data Collection Pipeline

    We moved from using Adafruit Feather M0 MCU to Digilent Analog Discovery 2 for acquiring data from the sensor. Because “dwf” Python API allows simpler and more accurate manipulation of sampling rate through the Analog Discovery 2 device, it was favored over the previously tested MCU for data collection.

    Data Classification Pipeline

    Data for classification is acquired using the Analog Discovery 2 device. It is segmented through frequency domain energy calculations and smoothened to suppress random errors in the data. Simultaneously, the classifier looks for a signal in this segmented data if the signal crosses a threshold energy level. As was determined in the case of MCUs, Random Forest Classifier was experimentally seen to perform the best. “PyAudioAnalysis” Python library was used to calculate frequency and time domain features, and statistics were calculated on the features. Thus, a stable and accurate data processing pipeline was built that successfully distinguished 6 gestures. The required code is available in github and instruction for its usage is explained in Build Instruction section. 

    Note: 

    The present system makes use Digilent Analog Discovery 2 which is an expensive device and we DO NOT propose that it is a requirement for the successful functioning of Serpentine as a wearable device. Digilent device serves to prove that the sensing interface and data classification algorithms are functioning well and are ready to be integrated with MCU. Our ongoing research aims to achieve this integration of data acquisition over WiFi from MCU (refer to previously uploaded Python code for MCU) with segmentation and classification algorithms presented in the latest uploads.

  • Demo and Experiment

    fereshteh10/22/2018 at 07:50 0 comments

    Pilot Study

    Demo and Testing the System with Random Users 

    A user tests the performance of gesture recognition system by interaction through Serpentine. 

    The system recognize the gestures correctly when user perform right gesture. User intentionally perform wrong gesture to test if system can recognize the performed gesture rather expected gesture. 

  • Analyzing Gesture Data sets : Time and Frequency Domain Analysis

    fereshteh10/22/2018 at 07:31 0 comments

    Frequency Response Analysis 

    We analysed the frequency domain of data from 6 different users collected in identical physical environment. The data is visualized in the following graph where amplitudes of the signals are normalized, such that the maximum amplitude from each gesture is 1. The graph represents the distinctness of our 6 tested gestures in the frequency domain. For "pluck" gesture, one observes a good response in the frequency range of 25 to 45 Hz, which corresponds to the range of frequencies wherein lies the frequency of first harmonic, given the length of the plucked part of the sensor. This response in pluck gesture promises future application of self-powered pickup in string based musical instruments.

    In all gestures apart from stretch and pluck, one notices a peak at 60Hz, which is due to the omnipresent electrical power transmission lines. The amplitude of the signal in pluck and stretch is much higher than the signal intercepted from the 60Hz power line, because of which the 60Hz signal is suppressed in the visualization when the data is normalized.

    Frequency Response Analysis :
    Collected data demonstrates the frequency response each gesture. Each gesture illustrates 25 samples per user for 6 users . 

    Spectrograms for revising classification algorithm

    In the process to debug and improve the machine learning classification, we graphed spectrograms of different gestures to observe which gestures are best distinguished using that feature. Spectrograms also influenced our decision about whether a gesture should be kept in the set of distinguishable gestures for this first study of its kind. Therefore, visualizing features influenced gesture design and vice versa. We are constantly improving our classification algorithm to increase the number of gestures in this first set of 6 gestures.

    Wiggle

    Wiggle

    Twist

    Twist

    Stretch

    Stretch

    Pluck

    Pluck

  • Gestural Interactions with Serpentine

    fereshteh10/22/2018 at 05:47 0 comments

    Many different expressive one-handed and two-handed interactions are possible with Serpentine. To prove serpentine can detect electrical signals produced by touch and longitudinal forces, we have explored and evaluated some specific gestures which are an appropriate representative sample. 

  • Electro-Mechanical Testing and Analysis

    fereshteh10/22/2018 at 05:07 0 comments

    Sensor Characterization in terms of Electrical Output ( Open - Circuit Voltage, Short - Circuit Current and Output Power)  through Longitudinal Displacement

    Experiment Setup:

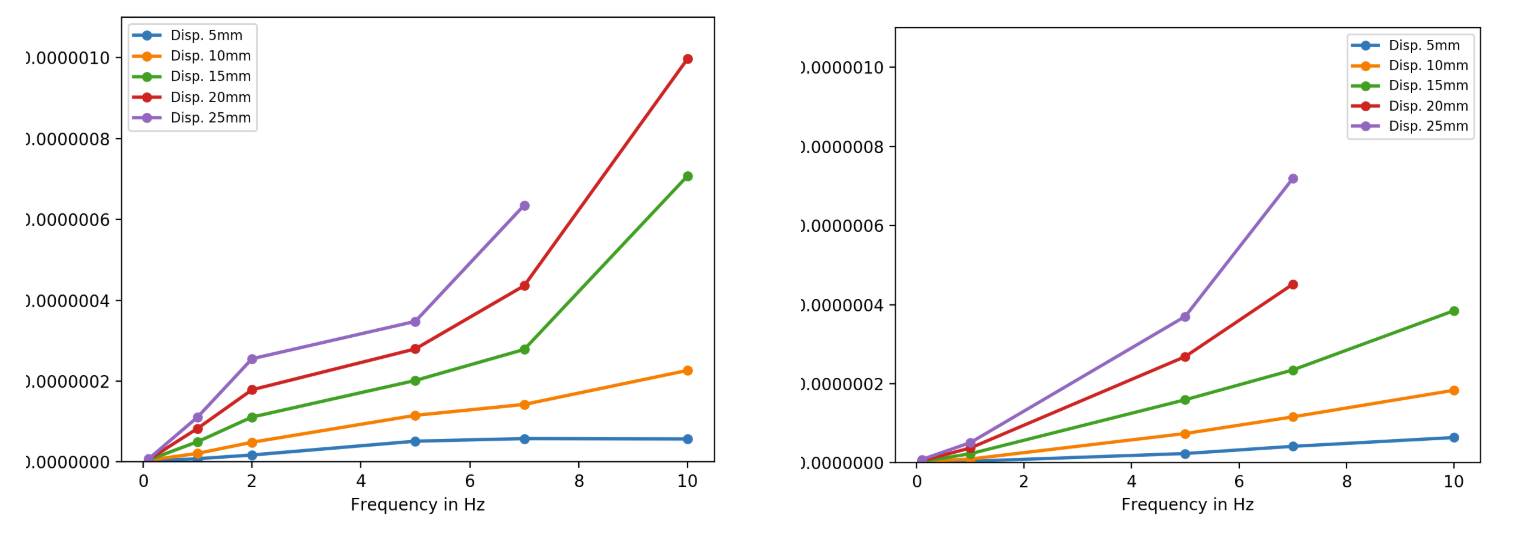
    We carried out experiments to characterize our sensing interface’s electrical output in terms of short circuit current (Isc) current, open circuit voltage (Voc) and electrical power for various input frequencies and longitudinal displacement (stretch). First, customized plastic brackets were constructed to hold the sensing interface between the linear motor and Newport 462-XYZ-M Linear Stage. Afterwards, the sensing interface was aligned parallel to the ground and, firmly fixed in a straight line between the laboratory equipment. The acceleration, deceleration and displacement of linear motor arm were controlled through computer to simulate different frequencies and longitudinal displacements of interaction. The electrical output from the interface was measured through Keithley electrometer. The procedure was carried out for two sensors with different stiffness. The following results were obtained:

     Open circuit voltage versus frequency plots for 5 different displacements (Left: Soft, Right: Stiff)

    Open circuit voltage versus frequency plots for 5 different displacements (Left: Soft, Right: Stiff)

    Observation: Open Circuit Voltage
    On the one hand two different interfaces show some similarities in open circuit voltage: 1. Over the given range of frequencies, open circuit voltage is observed to almost remain unchanged at 5 mm displacement, and 2. With increasing displacement, open circuit voltage shows approximate linear relationship with frequency, but this linear trend is noticeably broken at high displacement of 20 mm and 25 mm. On the other hand, there are prominent differences in the electrical response to frequency and displacement of interactions. For all displacements and frequencies the softer interface generates greater open circuit voltage as compared to the stiffer the alternative. This indicates that the softer interface is more sensitive to stretching interaction. Furthermore, the approximate linear relation between voltage and frequency depicts steeper slope for the softer interface, which suggests that for the tested displacements, sensitivity of the soft interface to frequency, improves with increase in displacement.


    Short circuit current versus frequency plots for 5 different displacements (Left: Soft, Right: Stiff)
    Short circuit current versus frequency plots for 5 different displacements (Left: Soft, Right: Stiff)

    Observation: Short Circuit Current 
    For a given frequency, the short circuit current increases with increase in the displacement. At a given displacement the short circuit current increases almost linearly with increase in frequency up to 5Hz, before the current departs from the linear trend and begins to increase sharply. This trend implies that electric output in terms of short circuit current is highly sensitive to the frequency of interaction for longitudinal displacements of 20 mm and 25 mm.


    Experimental setup for sensor characterization through linear motor, with variable frequencies and variable strain values can be seen in the following videos.


    Observation : Electrical Power

    Increase in both frequency and strain cause an increase in the output power measured. The power grows exponentially with increase in frequency for any given strain value. This sensitivity towards frequency increases as the strain increases. Therefore, industrial uses where there exists high frequency and high strain environments such as in car-suspensions, and vibrating machinery provide promising use cases for future applications.

    Output power in soft sensor

    Output power in soft sensor

  • Tensile Elasticity and Stiffness Measurements

    fereshteh10/22/2018 at 04:05 0 comments

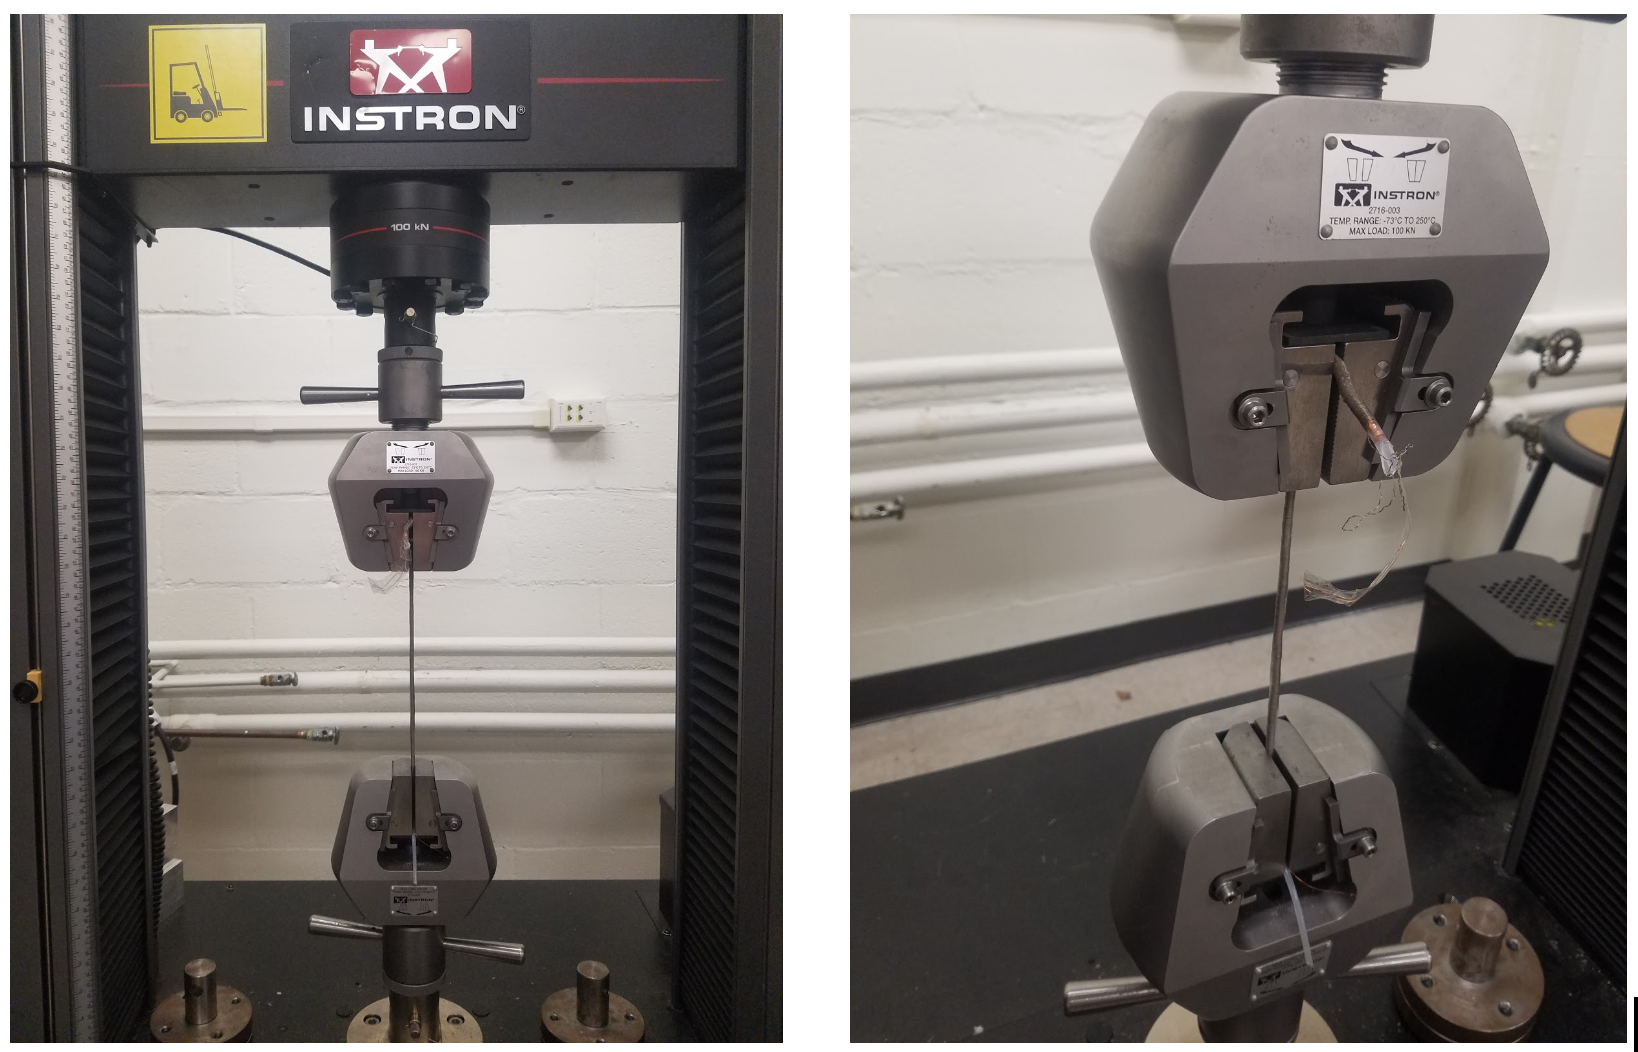
    Using instron device we have conducted Quasistic uniaxial tensile test. To measure the tensile elasticity we have calculated the Young’s Modulus of the prototypes that we have made and conducted electromechanical tests which we will explain in details in following section. The final sensors with the best performance in terms of self-generated electrical signals from linear motor testing have the Young’s Modulus equal to 0.363 and 0.0467 Megapascals . The softest which its fabrication process is illustrated here has 0.363 MPa tensile elasticity.

    using Instron device for Quasistatic uniaxial tensile test
    using Instron device for Quasistatic uniaxial tensile test

    Elasticity measurement :Two solutions composed of different proportions of silicone elastomer to PDMS exhibit different elasticities. The Young’s Modulus value (measure of elasticity/stiffness) for each is derived from the gradient of the plots in the figure above.

    To measure elasticity of sensors we have conducted Instron testing. The softer prototype perform better than stiffer one in terms of electrical output. By different proportions of silicone elastomer to PDMS, solution exhibit different elasticities. The Young’s Modulus value (measure of elasticity/stiffness) for each is derived from the gradient of the plots in the figure above.

  • Design Parameters in Construction of Serpentine

    fereshteh10/22/2018 at 03:45 0 comments

    Silicone rubber is chosen as the main substrate because of following reasons. Changing the proportions of silicone elastomer and PDMS which is mentioned in fabrication process allows different elasticity for the sensor.

    • first, it acts as a dielectric with a highly negative triboelectric polarity. Human skin is highly electropositive. Thus, while it get into contact with sensor for any manipulation, it highly increase the magnitude of the self-powered current generated by mechanical deformation.
    • Second, the elastic properties of silicone rubber allows a wide varieties of gestural input and human interactions. It can be easily squeezed, stretched, twisted or twirled, and then return to original shape. Such properties provide many opportunities for many use cases in different contexts.

    Copper and Silver coated Nylon are chosen as electrodes for following reasons:

    • Coiling conductive threads around the silicone rubber improves mechanical strength and charge flow. Such spiral structure of electrode coils allows manipulation of sensor while reducing the silicone punctures and tensile failures when sensor is stretched.
    • The inner electrode copper wire has high conductivity and very low resistivity, about 1.7 * 10^2 Ohm * m^ -1.
    • The outer electrode silver-coated nylon is conductive (< 1 Ohm* m^-1) and has specific physical properties like high tensile strength, high elongation tolerance, high tear strength, and high puncture resistance. Such properties support silicone rubber cord under applied loads.
    • Tight winding of coils and having no gap between two successive turn of electrodes maximize the structural reinforcement and also maximize the contact area between dielectric layers of the silicone rubber and the PVA. such contact area maximization improve the triboelectric charging and the amount of harvesting power.

View all 14 project logs

  • 1
    DIY Approach - Fabrication Process

    Different materials with different electrical and mechanical properties have been tested in this experiment. 

    Initial Prototypes - fabrication of different sensors with different physical properties like: 
    1. Thickness, 2. Length, 3. Winding Density, 4. Strain Values, 5. Different materials for dielectric and electrodes and 6. Different modes of TENGs like, single electrode, contact-separation and lateral sliding modes.

    The followings are the final chosen materials. The reason of choosing each is described in Design Parameters section.

    • Silicone rubber as dielectric layer -  Commercial Ecoflex 0050, Smooth-on, Inc
    • Polydimethylsiloxane (PDMS) as dielectric layer -  Commercial Sylgard® 184 silicone elastomer, Dow Corning Corporation
    • PVA coated Copper wire ( Conductive Thread) as inner Electrode
    • Silver coated Nylon (conductive thread) as Outer Electrode. 

    Sensor structure and choice of different materials are optimized to maximize the triboelectric effect in Serpentine.

    The unique form factor of serpentine allows it act as different types of force sensor simultaneously like touch, pressure, strain and torque sensor. Depend on a broad range of applications from wearable to furniture, medical devices and human health monitoring use cases, the Serpentine’s form factor is adjustable in length, thickness and stiffness. It is a great contribution to adjust such physical properties and collect wide range of electrical outputs.

    DIY FABRICATION PROCESS: 

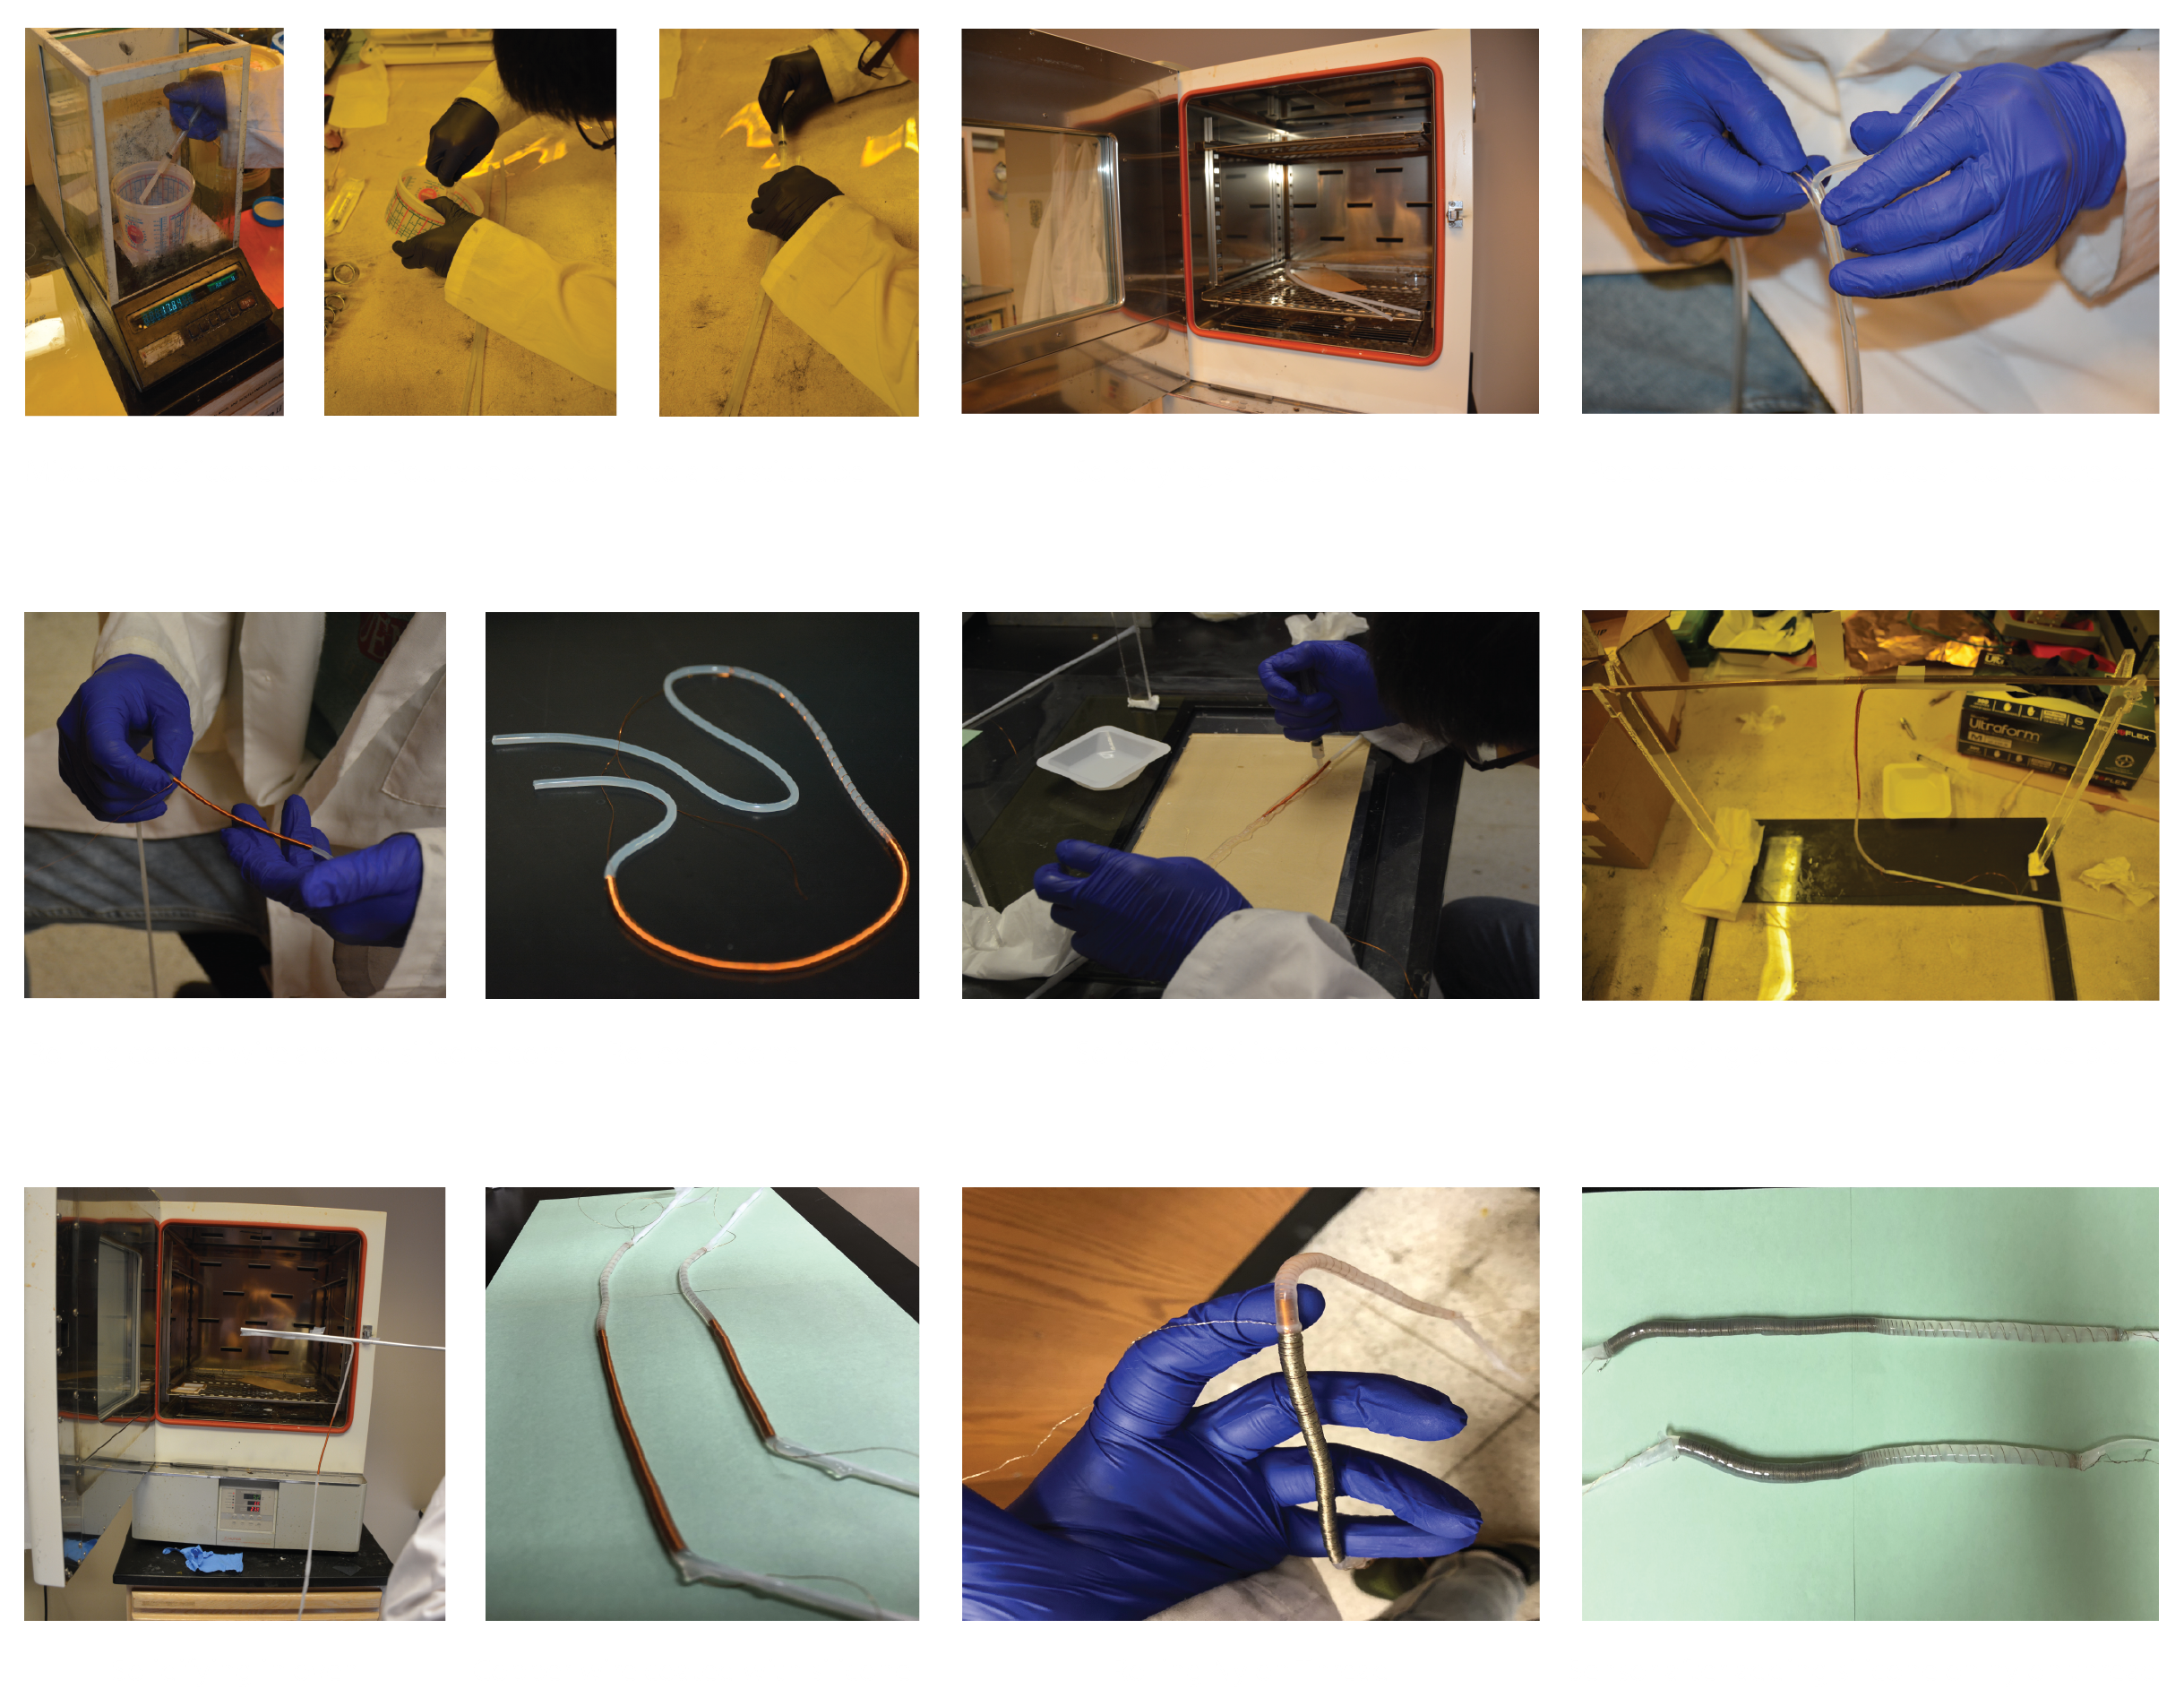
    Our novel self-powered stretchable cord-shape sensor has low-cost, cheap, easy and safe fabrication process. To fabricate the sensor:

    Step 1 - Silicone rubber as dielectric material:

    For the proper stiffness, silicone rubber and Polydimethylsiloxane(PDMS) were mixed. We have chosen low-cost  commercial materials to allow users for manual fabrication in any environment even out of lab environment. Commercial silicone rubber and PDMS have two parts, a base (B) and a curing (C) agent. For the silicone rubber, these two parts are mixed in 1:1 weight ratio and stirred for 3 minutes. For PDMS, the two parts are mixed in 10:1 weight ratio (B:C) and stirred for 5 minutes. Then, both solutions are mixed in a 4:1 weight ratio (silicone:PDMS) and stirred for 3 minutes.

    Step 2 - Inner core tube:

    The prepared solution in step 1 is poured into a plastic tube. The length and thickness of core layer is up to your project. In our final optimized model, we made such silicone core layer with 2.5 mm thickness and 30 cm length. Silicone got solidified in an oven at 60 °C for 5 minutes. It also, can be cured in room temperature in 4 hours. At this stage we peeled the plastic tube, resulting in a solid pure tube-shape silicone rubber.

    Step 3 - Winding Copper thread around core layer:

    A commercially available conductive Polyvinyl Alcohol (PVA) coated Copper wire with 0.17 mm diameter was tightly wound spirally around the core silicone rubber. Such spiral winding should be dense enough to provide maximum contact area between each single turn of conductive thread around the dielectric material.

    Step 4 - Encapsulating the wound copper wire with silicone rubber:

    We laid down the assembly on a flat surface and used a syringe to apply the prepared silicone solution in step 1 over the entire surface of prepared assembly in step 3. This structure was then hung vertically for five minutes and then cured for five minutes in an oven at 60°C.

    Step 5: Winding Nylon thread around assembly:

    A commercially-available silver-coated nylon yarn with 0.18mm diameter is used as the outer electrode. It was also tightly wound around the whole assembly. The fabrication process  is similar to step 3.

    Step 6 - Encapsulate the whole assembly with silicone rubber solution:

    We repeated step 4 to coat the entire assembly with silicone rubber solution. The final prototype has 4.5 mm thickness and 30 cm length.

  • 2
    CIRCUIT

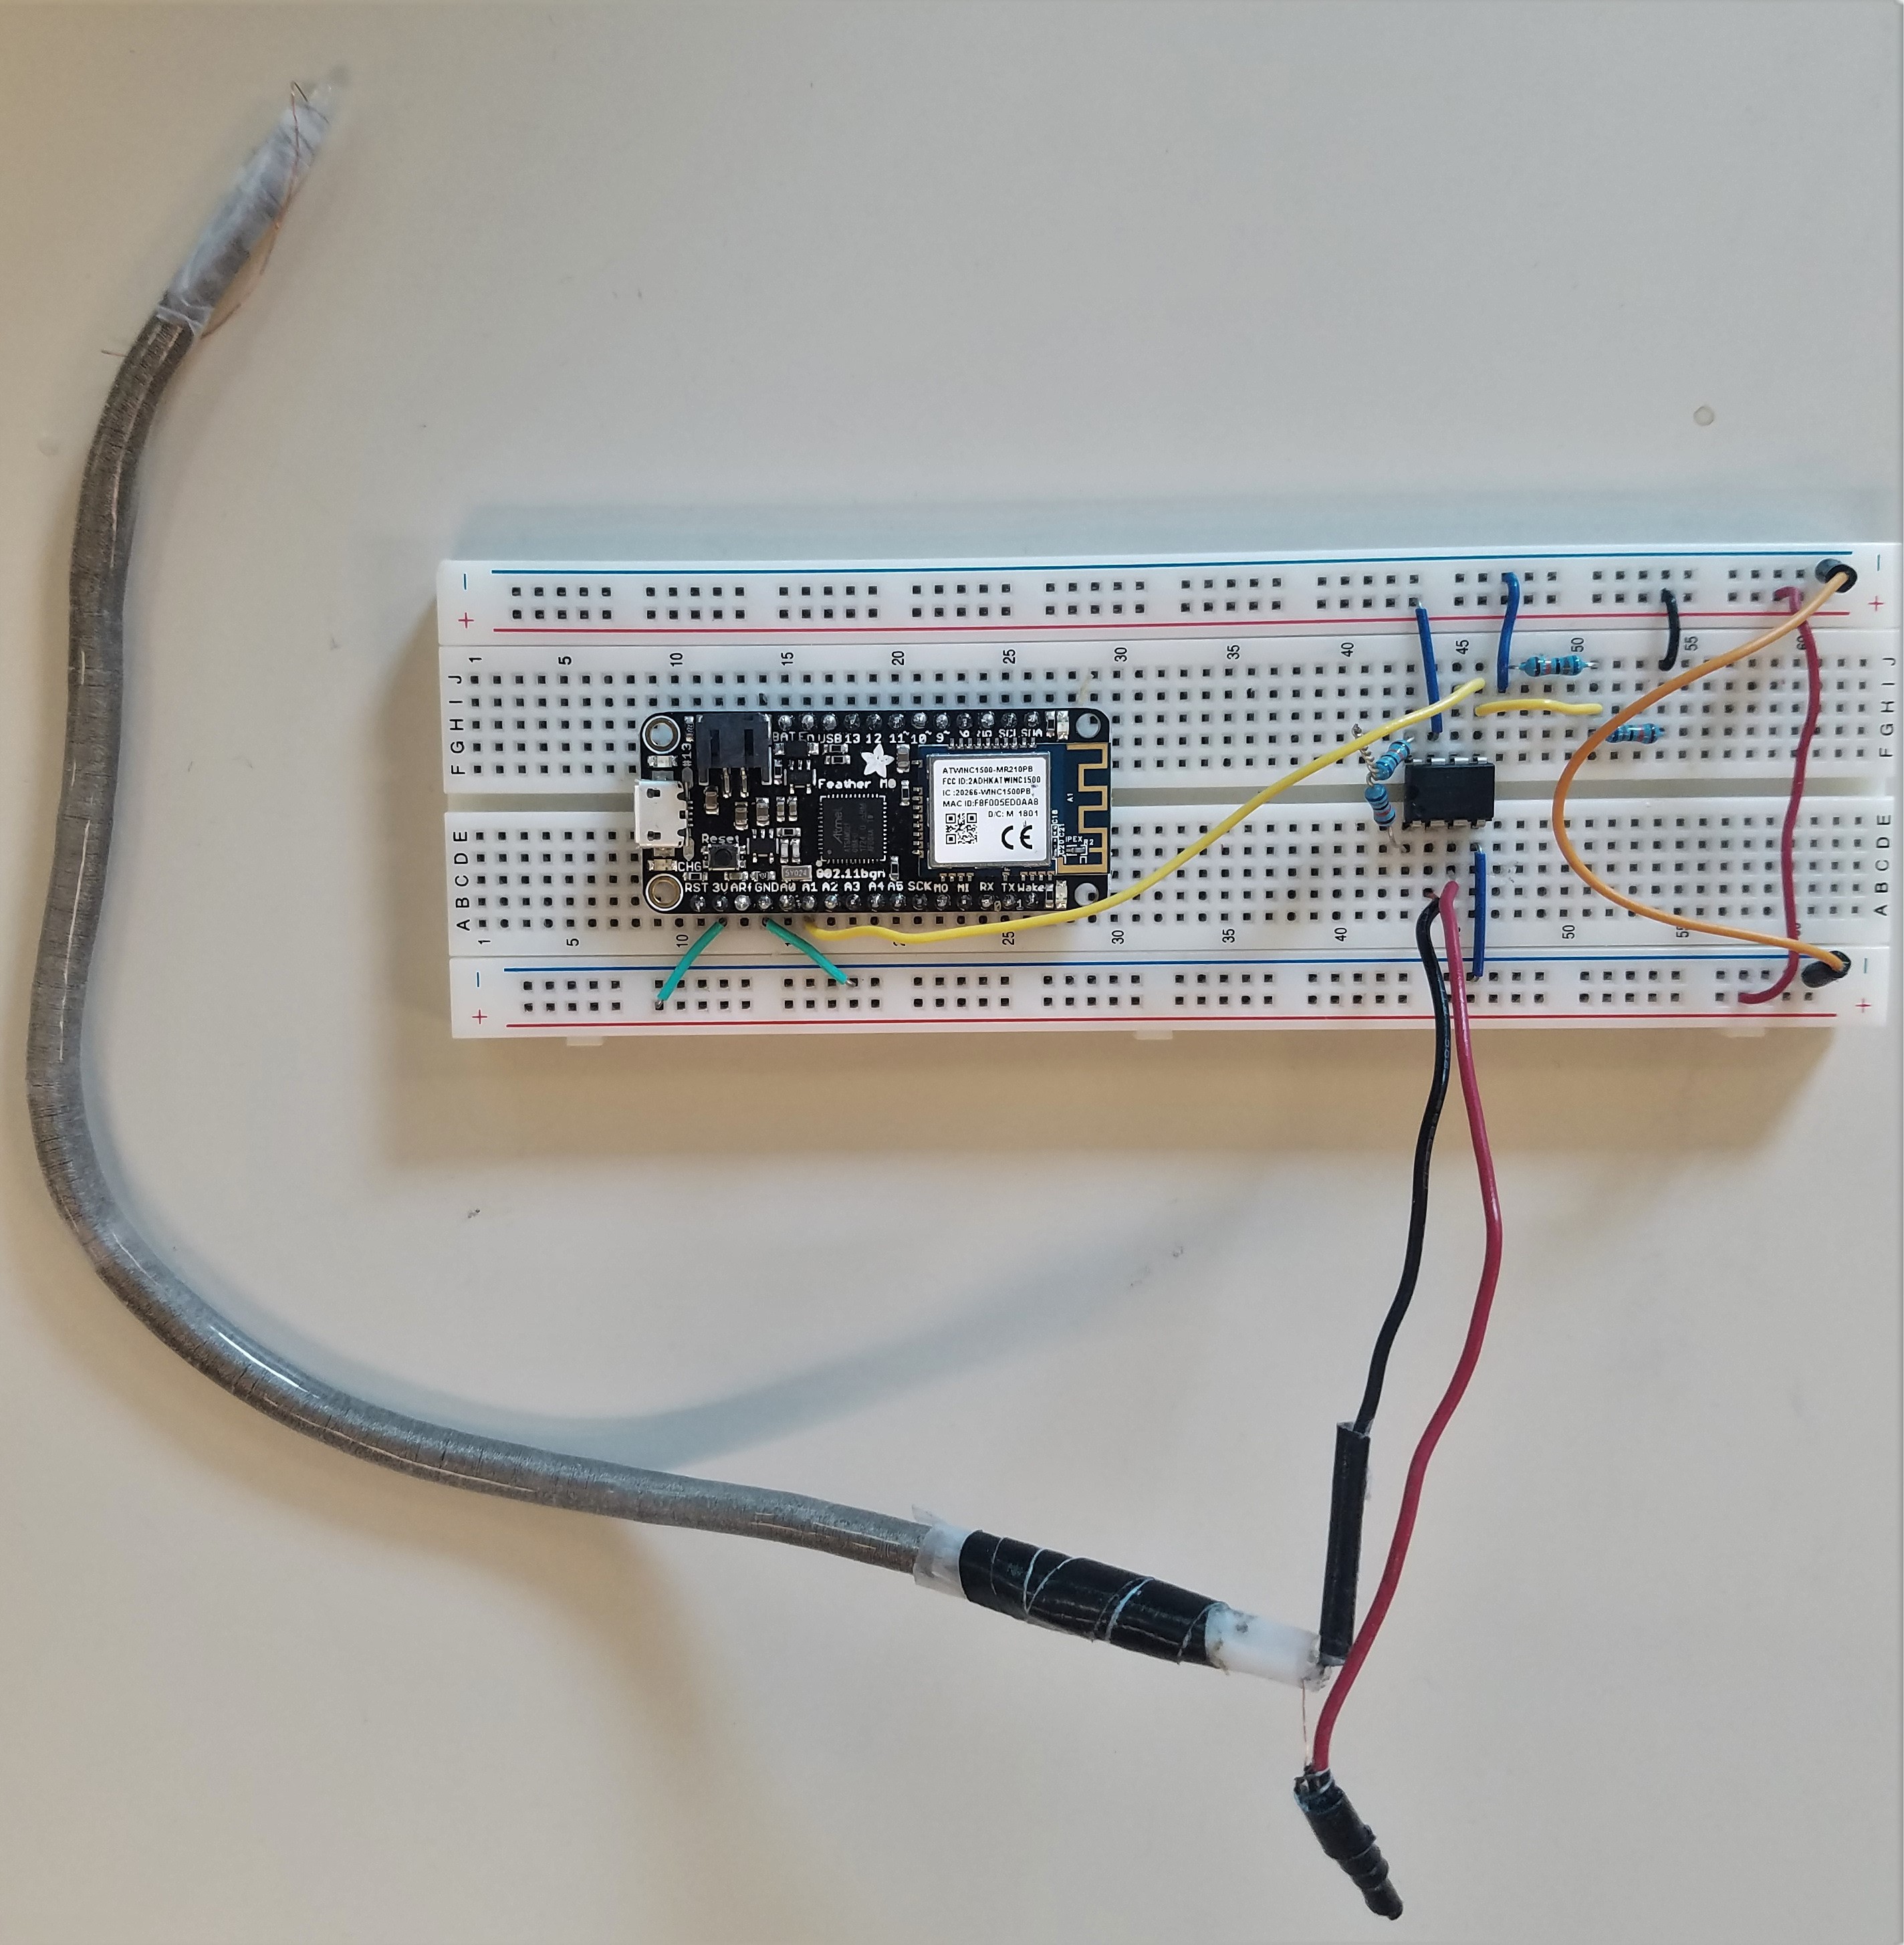
    The sensor signal, because of the mechanism of its generation is bidirectional in nature (AC). In order to preserve the negative half of the signal, we offset the data by 1.6V using DC bias. The electrodes of the sensor are connected to “V In +” and “V In -” of the amplifier as shown in the circuit diagram below. The amplified signal is fed to the ADC of the MCU. The signal is converted with a 12 bit resolution, before being wirelessly transmitted to a computing device for real-time classification.

    Schematic diagram of connection sensor to microcontroller

    Collecting Analog data from differential potential between two electrodes in circuit


    How System work by using micro controller


  • 3
    HAND GESTURES & SIGNAL PROCESSING

    GESTURES

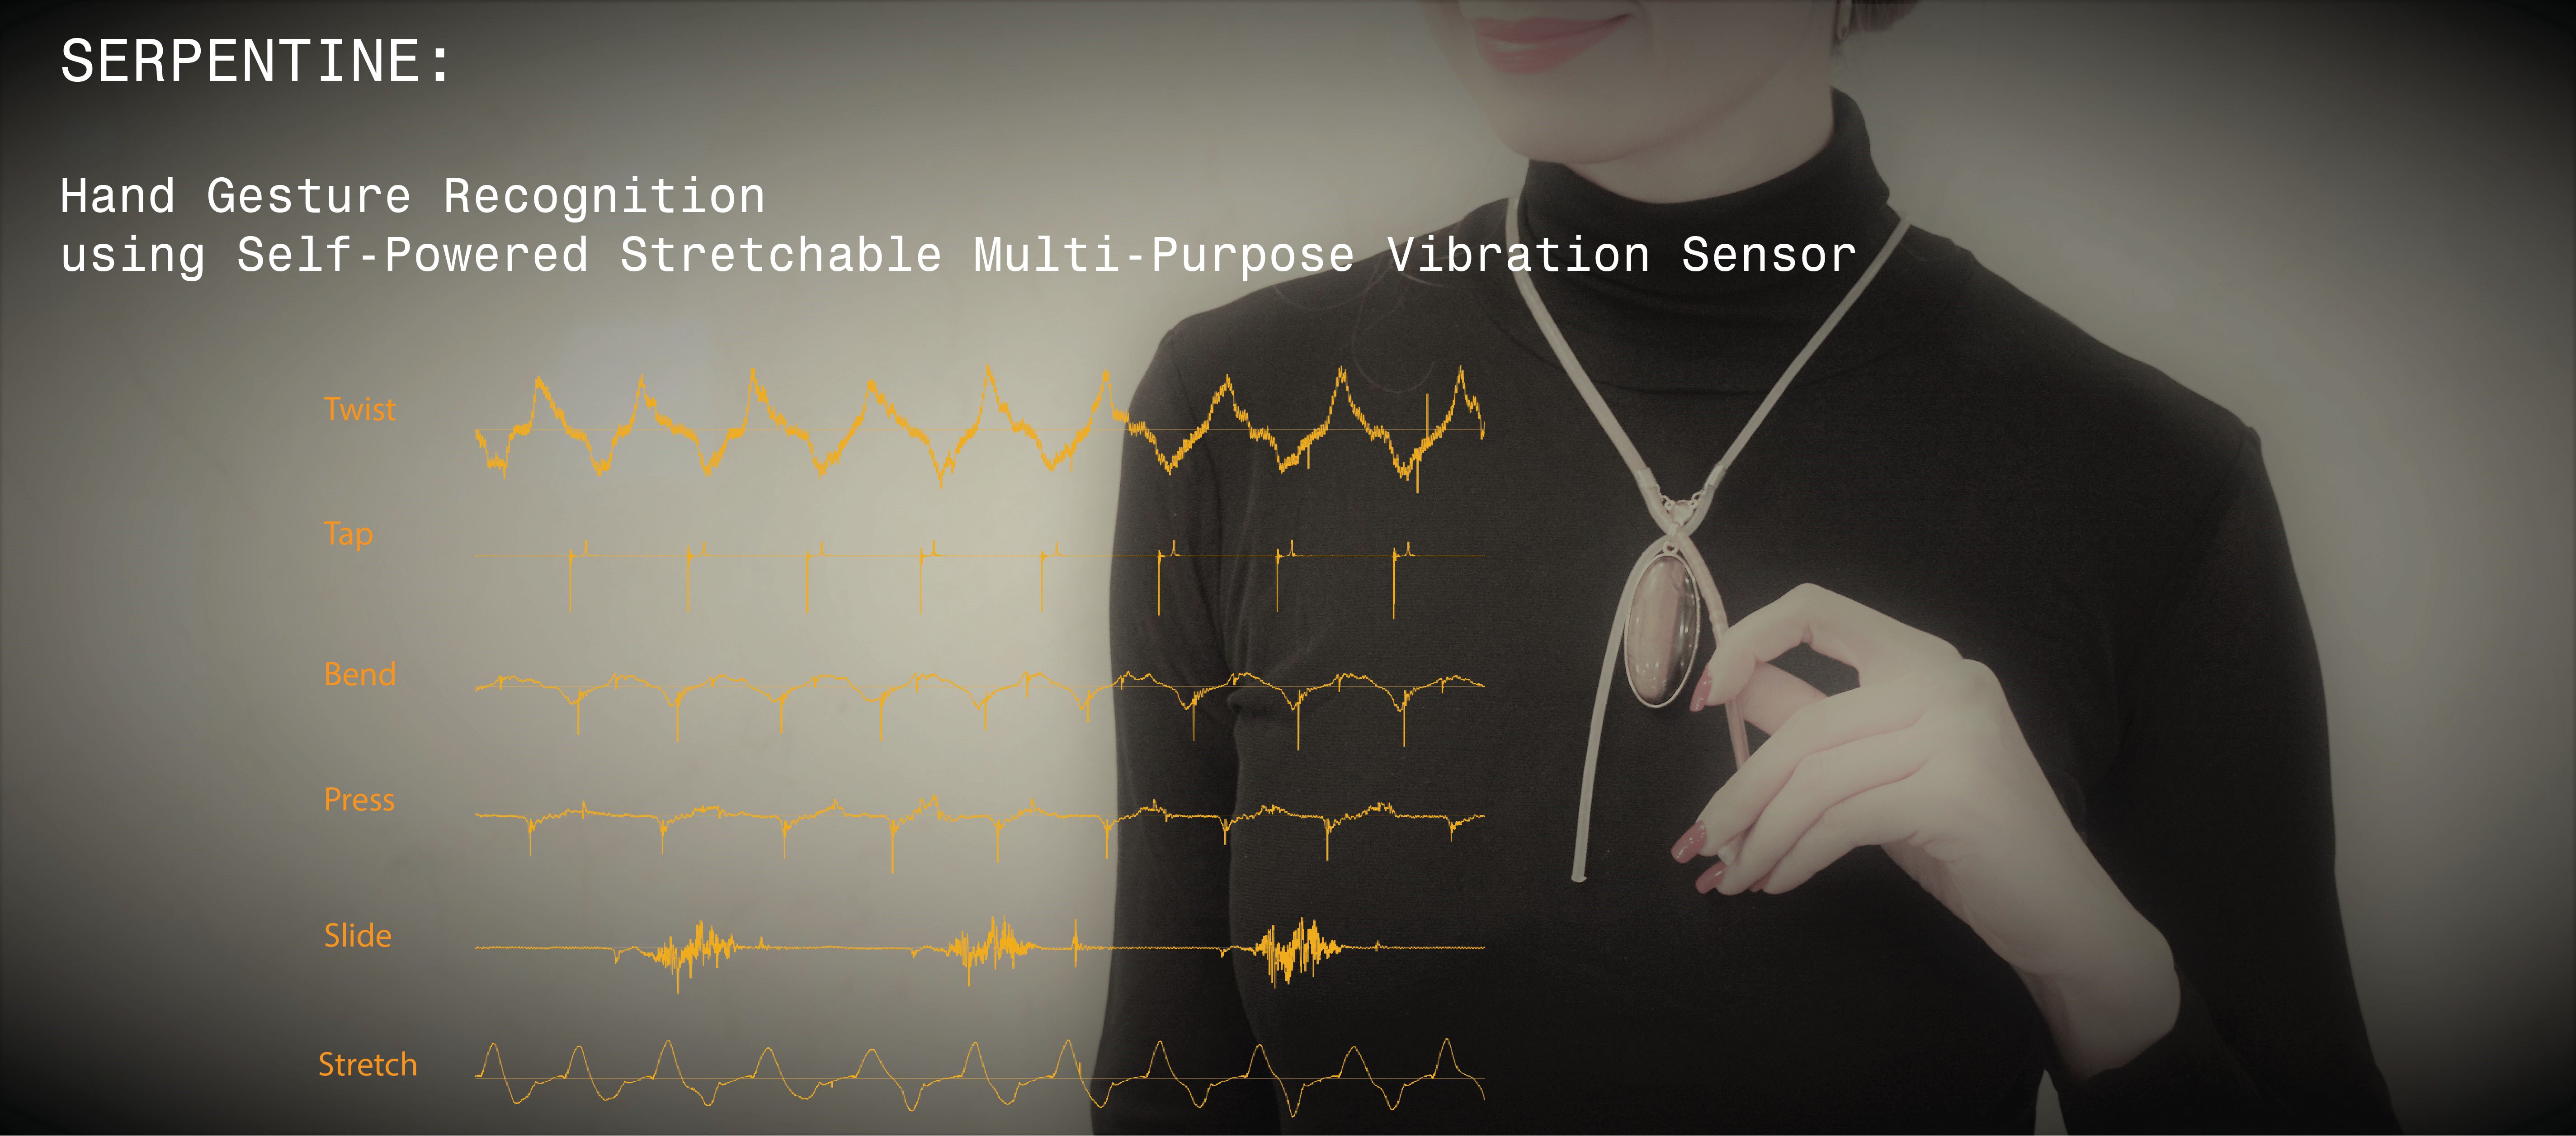
    In a general categorization there are three types of interactions with sensor. 1. Towards the axis (Radial), 2. Along the axis (Longitudinal) and 3. Tangent to the cross-section (Tangential). These three ways of applying force to the sensor make up simple to complex gestural inputs. We have tested our implemented signal processing pipeline with 7 gestures; Tap, Press, Slide, Twist, Stretch, Bend, Rotate. 

    to see how we interact with such gestures check the following link:

    https://youtu.be/T_SP5k-Zab0

    SIGNALS

    to provide more insight on how signals collected from microcontroller look like, we added following images:

    Tap

    Tapping

    Pressing

    Rotating

    Twisting


    Sliding


    Stretching


    Bending

View all 5 instructions

Enjoy this project?

Share

Discussions

Similar Projects

Does this project spark your interest?

Become a member to follow this project and never miss any updates