 fereshteh
-
Bill of Materials for One Unit
10/22/2018 at 10:42 • 0 comments- Sensor Cost - $10.00
Fabricated sensor based on described fabrication process (for a double electrode sensor based on silicone rubber as a dielectric and Nylon and Copper conductive threads; with 30 cm length and 4.5 mm thickness)
- Adafruit Feather M0 WiFi - ATSAMD21 + ATWINC1500 - $37.99
- INA118 Precision, Low Power Instrumentation Amplifier - $11.67
-
Next Step: Self-Powered Wireless Communication
10/22/2018 at 08:58 • 0 commentsComprised of helical conductors, our sensor may also be used as an antenna. To explore its antenna nature, we experimentally measured the S11 antenna characteristic from 30MHz to 10GHz (Upper bound chosen because of the limitation of the measuring equipment) and plotted the results on a Impedance Smith Chart. The best S11 parameter value obtained after first few runs of the experiments was 0.2072 at 10.0 GHz, which implies that about 80% of power delivered to the antenna is transmitted out, or used up internally. It is our ongoing research to optimize this antenna nature of Serpentine and build a system for self-powered sensing and self-powered wireless communication.
Using Serpentine not only as an self-powered sensing interface but also as a self-powered antenna for communication could revolutionize the way humans interact with computing devices. Interactions themselves shall be sufficient to generate electrical signals for sensing and simultaneous wireless communication without external power source or sensing and communicating instruments.
Today batteries are omnipresent in computing devices for sensing and communication. However, battery replacement and disposal burdens the environment, and such battery use is not sustainable.
Nonetheless, with Serpentine we shall soon eliminate the need of such external sources of power, thus, developing a self-sustaining system which is environmentally clean, and may be incorporated into ubiquitous computing devices.
The image illustrates the experimental setup for the measurement of S11 antenna parameter. 
Impedance Smith Chart for S11 parameter of Serpentine as an antenna. Frequencies range from 1 GHz to 10 GHz. 
Impedance Smith Chart for S11 parameter of Serpentine as an antenna. Frequencies range from 30 MHz to 300 MHz. 
S11 Parameter vs. Frequency of Serpentine as an antenna. Frequencies range from 1 GHz to 10 GHz. 
S11 Parameter vs. Frequency of Serpentine as an antenna. Frequencies range from 30 MHz to 300 MHz. -
Gesture Recognition Result
10/22/2018 at 08:51 • 0 commentsFor real-time gesture detection accuracy, the classifier works both as user-dependent and user-independent models. We can not disclose the final experimental results, quantitative or qualitative results, obtained for Serpentine, as they are under review by the honorable scientific community presiding at the CHI Conference 2019.Upon acceptance, all results will be added to Hackaday 2018 project web page.
-
Data Collection and Classification Pipeline
10/22/2018 at 08:38 • 0 commentsData Collection Pipeline
We moved from using Adafruit Feather M0 MCU to Digilent Analog Discovery 2 for acquiring data from the sensor. Because “dwf” Python API allows simpler and more accurate manipulation of sampling rate through the Analog Discovery 2 device, it was favored over the previously tested MCU for data collection.
Data Classification Pipeline
Data for classification is acquired using the Analog Discovery 2 device. It is segmented through frequency domain energy calculations and smoothened to suppress random errors in the data. Simultaneously, the classifier looks for a signal in this segmented data if the signal crosses a threshold energy level. As was determined in the case of MCUs, Random Forest Classifier was experimentally seen to perform the best. “PyAudioAnalysis” Python library was used to calculate frequency and time domain features, and statistics were calculated on the features. Thus, a stable and accurate data processing pipeline was built that successfully distinguished 6 gestures. The required code is available in github and instruction for its usage is explained in Build Instruction section.
Note:
The present system makes use Digilent Analog Discovery 2 which is an expensive device and we DO NOT propose that it is a requirement for the successful functioning of Serpentine as a wearable device. Digilent device serves to prove that the sensing interface and data classification algorithms are functioning well and are ready to be integrated with MCU. Our ongoing research aims to achieve this integration of data acquisition over WiFi from MCU (refer to previously uploaded Python code for MCU) with segmentation and classification algorithms presented in the latest uploads.
-
Demo and Experiment
10/22/2018 at 07:50 • 0 commentsPilot Study
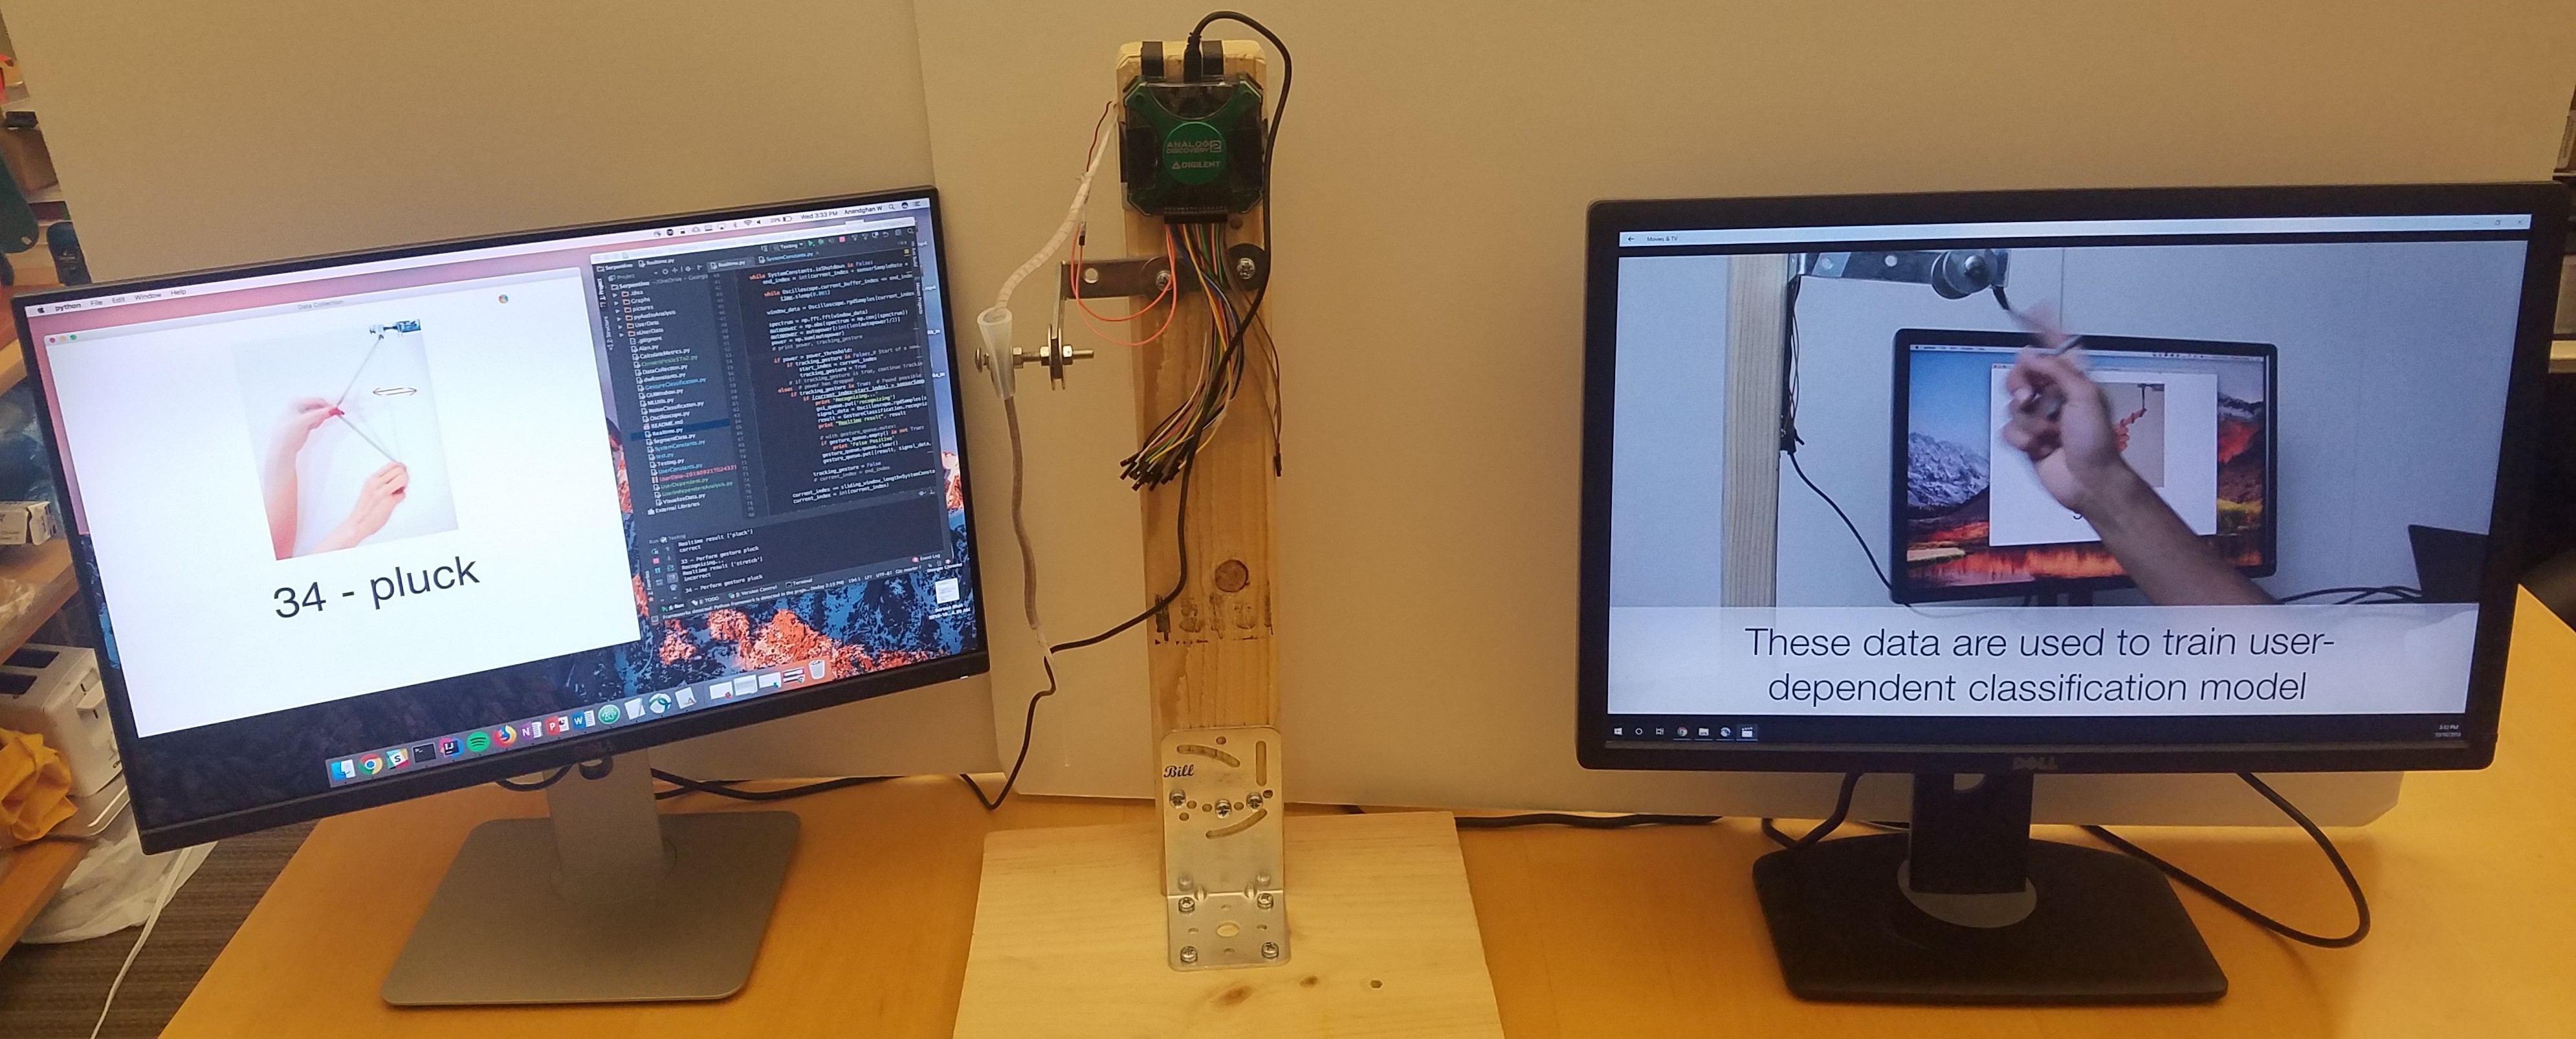
Demo and Testing the System with Random Users
![]()
A user tests the performance of gesture recognition system by interaction through Serpentine.
The system recognize the gestures correctly when user perform right gesture. User intentionally perform wrong gesture to test if system can recognize the performed gesture rather expected gesture.
-
Analyzing Gesture Data sets : Time and Frequency Domain Analysis
10/22/2018 at 07:31 • 0 commentsFrequency Response Analysis
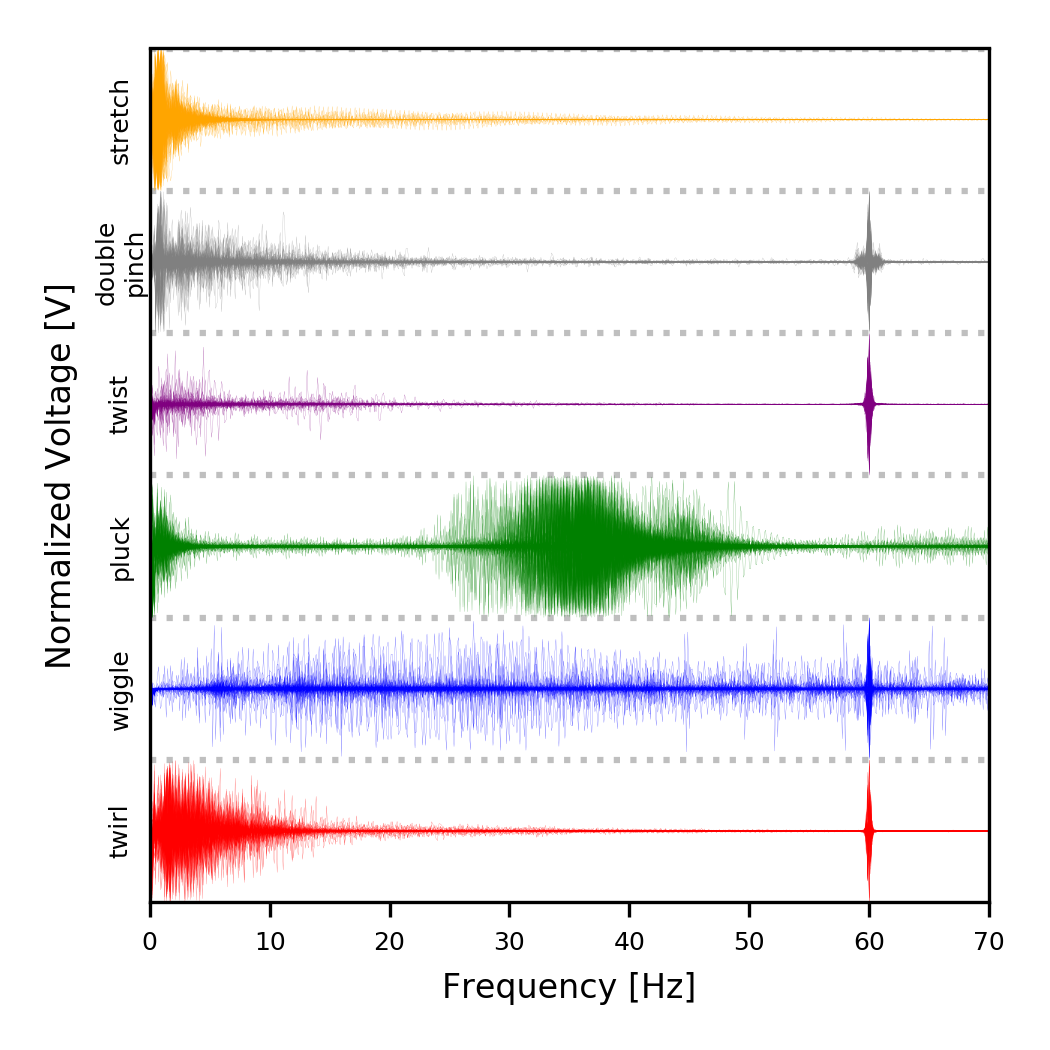
We analysed the frequency domain of data from 6 different users collected in identical physical environment. The data is visualized in the following graph where amplitudes of the signals are normalized, such that the maximum amplitude from each gesture is 1. The graph represents the distinctness of our 6 tested gestures in the frequency domain. For "pluck" gesture, one observes a good response in the frequency range of 25 to 45 Hz, which corresponds to the range of frequencies wherein lies the frequency of first harmonic, given the length of the plucked part of the sensor. This response in pluck gesture promises future application of self-powered pickup in string based musical instruments.
In all gestures apart from stretch and pluck, one notices a peak at 60Hz, which is due to the omnipresent electrical power transmission lines. The amplitude of the signal in pluck and stretch is much higher than the signal intercepted from the 60Hz power line, because of which the 60Hz signal is suppressed in the visualization when the data is normalized.
Frequency Response Analysis :
Collected data demonstrates the frequency response each gesture. Each gesture illustrates 25 samples per user for 6 users .Spectrograms for revising classification algorithm
In the process to debug and improve the machine learning classification, we graphed spectrograms of different gestures to observe which gestures are best distinguished using that feature. Spectrograms also influenced our decision about whether a gesture should be kept in the set of distinguishable gestures for this first study of its kind. Therefore, visualizing features influenced gesture design and vice versa. We are constantly improving our classification algorithm to increase the number of gestures in this first set of 6 gestures.
Wiggle Twist Stretch Pluck -
Gestural Interactions with Serpentine
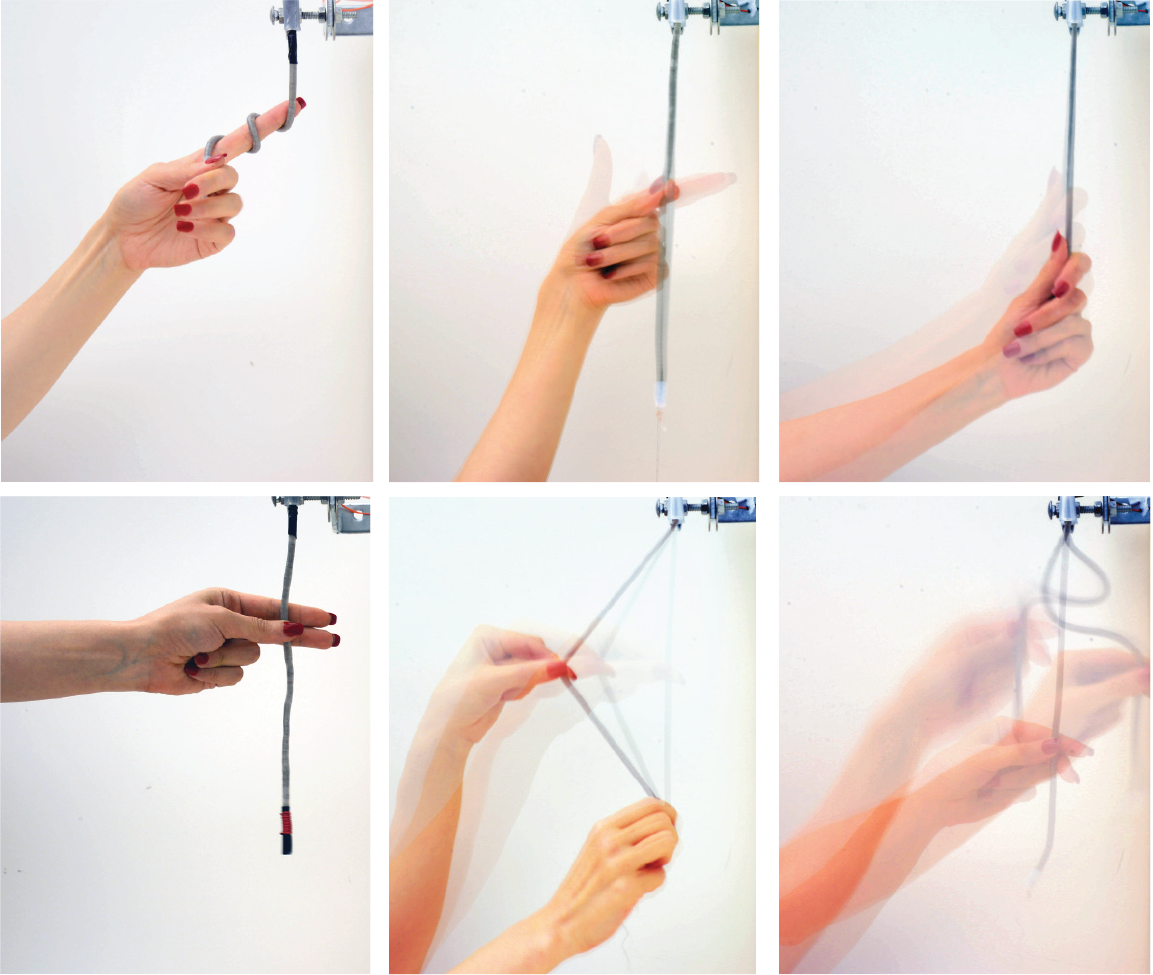
10/22/2018 at 05:47 • 0 commentsMany different expressive one-handed and two-handed interactions are possible with Serpentine. To prove serpentine can detect electrical signals produced by touch and longitudinal forces, we have explored and evaluated some specific gestures which are an appropriate representative sample.
![]()
-
Electro-Mechanical Testing and Analysis
10/22/2018 at 05:07 • 0 commentsSensor Characterization in terms of Electrical Output ( Open - Circuit Voltage, Short - Circuit Current and Output Power) through Longitudinal Displacement
Experiment Setup:
We carried out experiments to characterize our sensing interface’s electrical output in terms of short circuit current (Isc) current, open circuit voltage (Voc) and electrical power for various input frequencies and longitudinal displacement (stretch). First, customized plastic brackets were constructed to hold the sensing interface between the linear motor and Newport 462-XYZ-M Linear Stage. Afterwards, the sensing interface was aligned parallel to the ground and, firmly fixed in a straight line between the laboratory equipment. The acceleration, deceleration and displacement of linear motor arm were controlled through computer to simulate different frequencies and longitudinal displacements of interaction. The electrical output from the interface was measured through Keithley electrometer. The procedure was carried out for two sensors with different stiffness. The following results were obtained:
Open circuit voltage versus frequency plots for 5 different displacements (Left: Soft, Right: Stiff)
Observation: Open Circuit Voltage
On the one hand two different interfaces show some similarities in open circuit voltage: 1. Over the given range of frequencies, open circuit voltage is observed to almost remain unchanged at 5 mm displacement, and 2. With increasing displacement, open circuit voltage shows approximate linear relationship with frequency, but this linear trend is noticeably broken at high displacement of 20 mm and 25 mm. On the other hand, there are prominent differences in the electrical response to frequency and displacement of interactions. For all displacements and frequencies the softer interface generates greater open circuit voltage as compared to the stiffer the alternative. This indicates that the softer interface is more sensitive to stretching interaction. Furthermore, the approximate linear relation between voltage and frequency depicts steeper slope for the softer interface, which suggests that for the tested displacements, sensitivity of the soft interface to frequency, improves with increase in displacement.")
Short circuit current versus frequency plots for 5 different displacements (Left: Soft, Right: Stiff)
Observation: Short Circuit Current
For a given frequency, the short circuit current increases with increase in the displacement. At a given displacement the short circuit current increases almost linearly with increase in frequency up to 5Hz, before the current departs from the linear trend and begins to increase sharply. This trend implies that electric output in terms of short circuit current is highly sensitive to the frequency of interaction for longitudinal displacements of 20 mm and 25 mm.Experimental setup for sensor characterization through linear motor, with variable frequencies and variable strain values can be seen in the following videos.
Observation : Electrical Power
Increase in both frequency and strain cause an increase in the output power measured. The power grows exponentially with increase in frequency for any given strain value. This sensitivity towards frequency increases as the strain increases. Therefore, industrial uses where there exists high frequency and high strain environments such as in car-suspensions, and vibrating machinery provide promising use cases for future applications.
Output power in soft sensor -
Tensile Elasticity and Stiffness Measurements
10/22/2018 at 04:05 • 0 commentsUsing instron device we have conducted Quasistic uniaxial tensile test. To measure the tensile elasticity we have calculated the Young’s Modulus of the prototypes that we have made and conducted electromechanical tests which we will explain in details in following section. The final sensors with the best performance in terms of self-generated electrical signals from linear motor testing have the Young’s Modulus equal to 0.363 and 0.0467 Megapascals . The softest which its fabrication process is illustrated here has 0.363 MPa tensile elasticity.
using Instron device for Quasistatic uniaxial tensile test To measure elasticity of sensors we have conducted Instron testing. The softer prototype perform better than stiffer one in terms of electrical output. By different proportions of silicone elastomer to PDMS, solution exhibit different elasticities. The Young’s Modulus value (measure of elasticity/stiffness) for each is derived from the gradient of the plots in the figure above. -
Design Parameters in Construction of Serpentine
10/22/2018 at 03:45 • 0 commentsSilicone rubber is chosen as the main substrate because of following reasons. Changing the proportions of silicone elastomer and PDMS which is mentioned in fabrication process allows different elasticity for the sensor.
- first, it acts as a dielectric with a highly negative triboelectric polarity. Human skin is highly electropositive. Thus, while it get into contact with sensor for any manipulation, it highly increase the magnitude of the self-powered current generated by mechanical deformation.
- Second, the elastic properties of silicone rubber allows a wide varieties of gestural input and human interactions. It can be easily squeezed, stretched, twisted or twirled, and then return to original shape. Such properties provide many opportunities for many use cases in different contexts.
Copper and Silver coated Nylon are chosen as electrodes for following reasons:
- Coiling conductive threads around the silicone rubber improves mechanical strength and charge flow. Such spiral structure of electrode coils allows manipulation of sensor while reducing the silicone punctures and tensile failures when sensor is stretched.
- The inner electrode copper wire has high conductivity and very low resistivity, about 1.7 * 10^2 Ohm * m^ -1.
- The outer electrode silver-coated nylon is conductive (< 1 Ohm* m^-1) and has specific physical properties like high tensile strength, high elongation tolerance, high tear strength, and high puncture resistance. Such properties support silicone rubber cord under applied loads.
- Tight winding of coils and having no gap between two successive turn of electrodes maximize the structural reinforcement and also maximize the contact area between dielectric layers of the silicone rubber and the PVA. such contact area maximization improve the triboelectric charging and the amount of harvesting power.
SERPENTINE
Hand Gesture Recognition using Self-Powered Stretchable Squeezable Force Sensor based on Triboelectric Nanogenerators Principle


")
