-
1DIY Approach - Fabrication Process
Different materials with different electrical and mechanical properties have been tested in this experiment.
Initial Prototypes - fabrication of different sensors with different physical properties like:
1. Thickness, 2. Length, 3. Winding Density, 4. Strain Values, 5. Different materials for dielectric and electrodes and 6. Different modes of TENGs like, single electrode, contact-separation and lateral sliding modes.The followings are the final chosen materials. The reason of choosing each is described in Design Parameters section.
- Silicone rubber as dielectric layer - Commercial Ecoflex 0050, Smooth-on, Inc
- Polydimethylsiloxane (PDMS) as dielectric layer - Commercial Sylgard® 184 silicone elastomer, Dow Corning Corporation
- PVA coated Copper wire ( Conductive Thread) as inner Electrode
- Silver coated Nylon (conductive thread) as Outer Electrode.
Sensor structure and choice of different materials are optimized to maximize the triboelectric effect in Serpentine.
The unique form factor of serpentine allows it act as different types of force sensor simultaneously like touch, pressure, strain and torque sensor. Depend on a broad range of applications from wearable to furniture, medical devices and human health monitoring use cases, the Serpentine’s form factor is adjustable in length, thickness and stiffness. It is a great contribution to adjust such physical properties and collect wide range of electrical outputs.
![]()
DIY FABRICATION PROCESS:
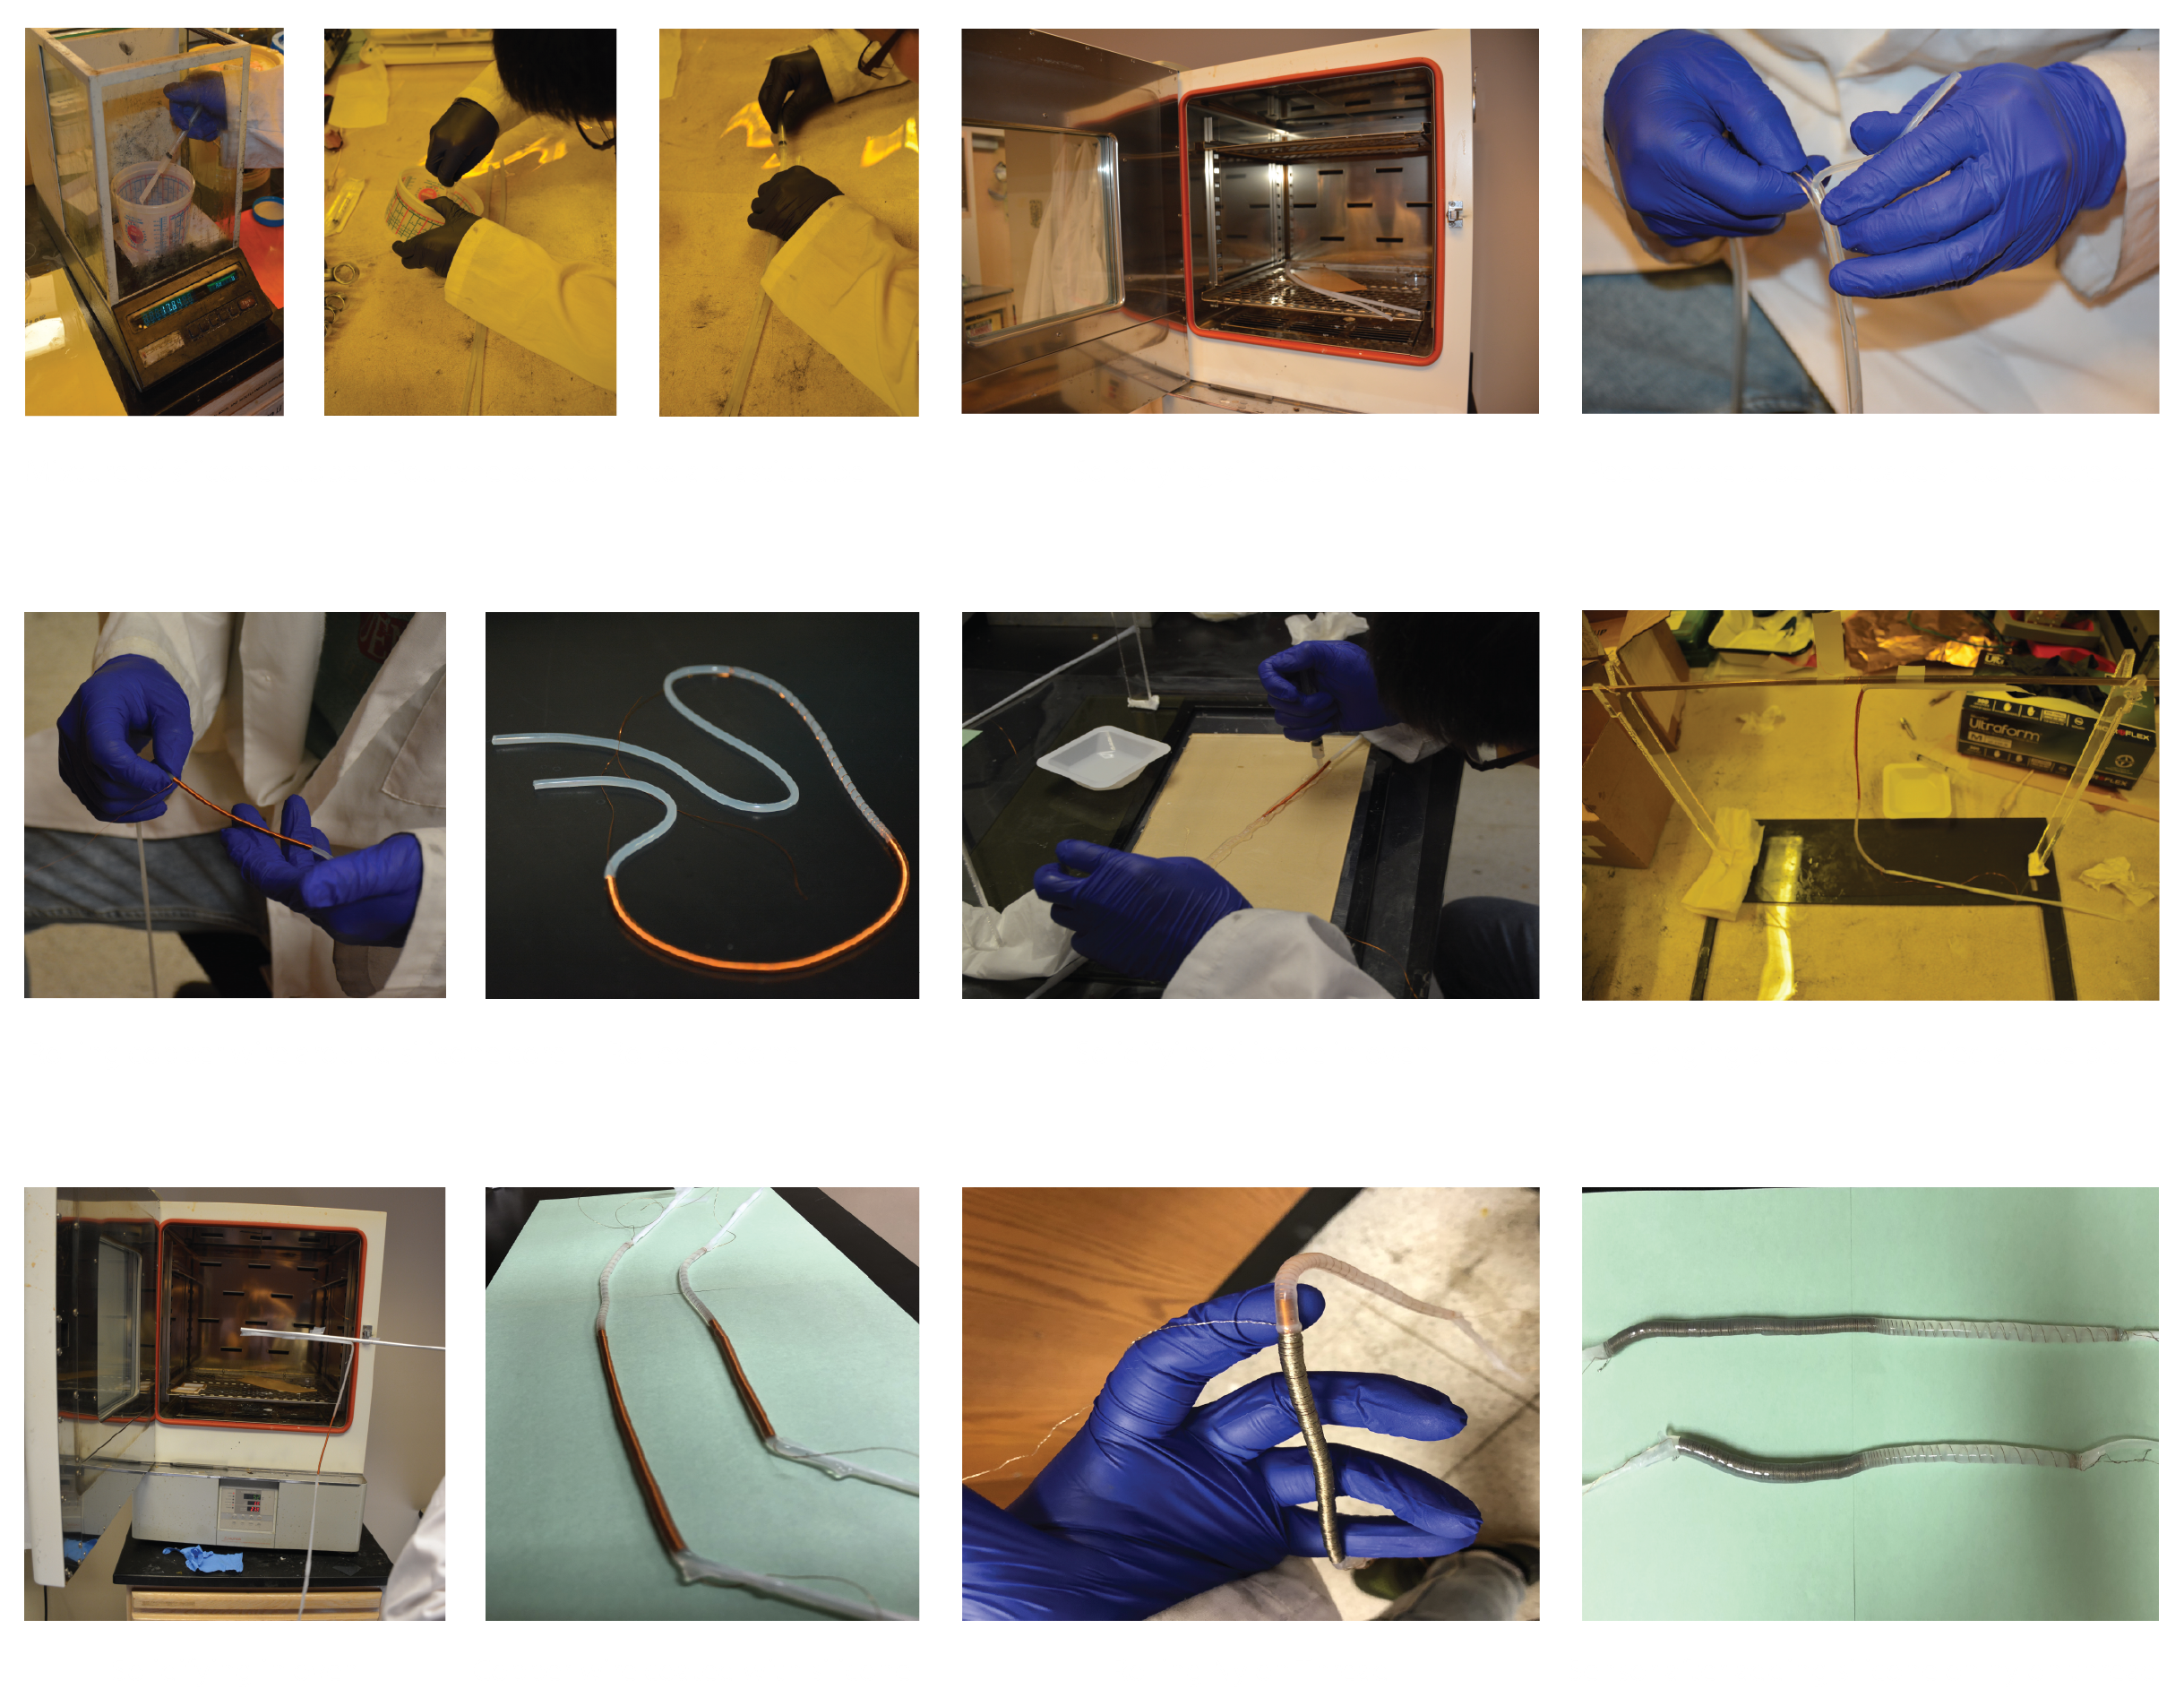
Our novel self-powered stretchable cord-shape sensor has low-cost, cheap, easy and safe fabrication process. To fabricate the sensor:
Step 1 - Silicone rubber as dielectric material:
For the proper stiffness, silicone rubber and Polydimethylsiloxane(PDMS) were mixed. We have chosen low-cost commercial materials to allow users for manual fabrication in any environment even out of lab environment. Commercial silicone rubber and PDMS have two parts, a base (B) and a curing (C) agent. For the silicone rubber, these two parts are mixed in 1:1 weight ratio and stirred for 3 minutes. For PDMS, the two parts are mixed in 10:1 weight ratio (B:C) and stirred for 5 minutes. Then, both solutions are mixed in a 4:1 weight ratio (silicone:PDMS) and stirred for 3 minutes.
Step 2 - Inner core tube:
The prepared solution in step 1 is poured into a plastic tube. The length and thickness of core layer is up to your project. In our final optimized model, we made such silicone core layer with 2.5 mm thickness and 30 cm length. Silicone got solidified in an oven at 60 °C for 5 minutes. It also, can be cured in room temperature in 4 hours. At this stage we peeled the plastic tube, resulting in a solid pure tube-shape silicone rubber.
Step 3 - Winding Copper thread around core layer:
A commercially available conductive Polyvinyl Alcohol (PVA) coated Copper wire with 0.17 mm diameter was tightly wound spirally around the core silicone rubber. Such spiral winding should be dense enough to provide maximum contact area between each single turn of conductive thread around the dielectric material.
Step 4 - Encapsulating the wound copper wire with silicone rubber:
We laid down the assembly on a flat surface and used a syringe to apply the prepared silicone solution in step 1 over the entire surface of prepared assembly in step 3. This structure was then hung vertically for five minutes and then cured for five minutes in an oven at 60°C.
Step 5: Winding Nylon thread around assembly:
A commercially-available silver-coated nylon yarn with 0.18mm diameter is used as the outer electrode. It was also tightly wound around the whole assembly. The fabrication process is similar to step 3.
Step 6 - Encapsulate the whole assembly with silicone rubber solution:
We repeated step 4 to coat the entire assembly with silicone rubber solution. The final prototype has 4.5 mm thickness and 30 cm length.
![]()
-
2CIRCUIT
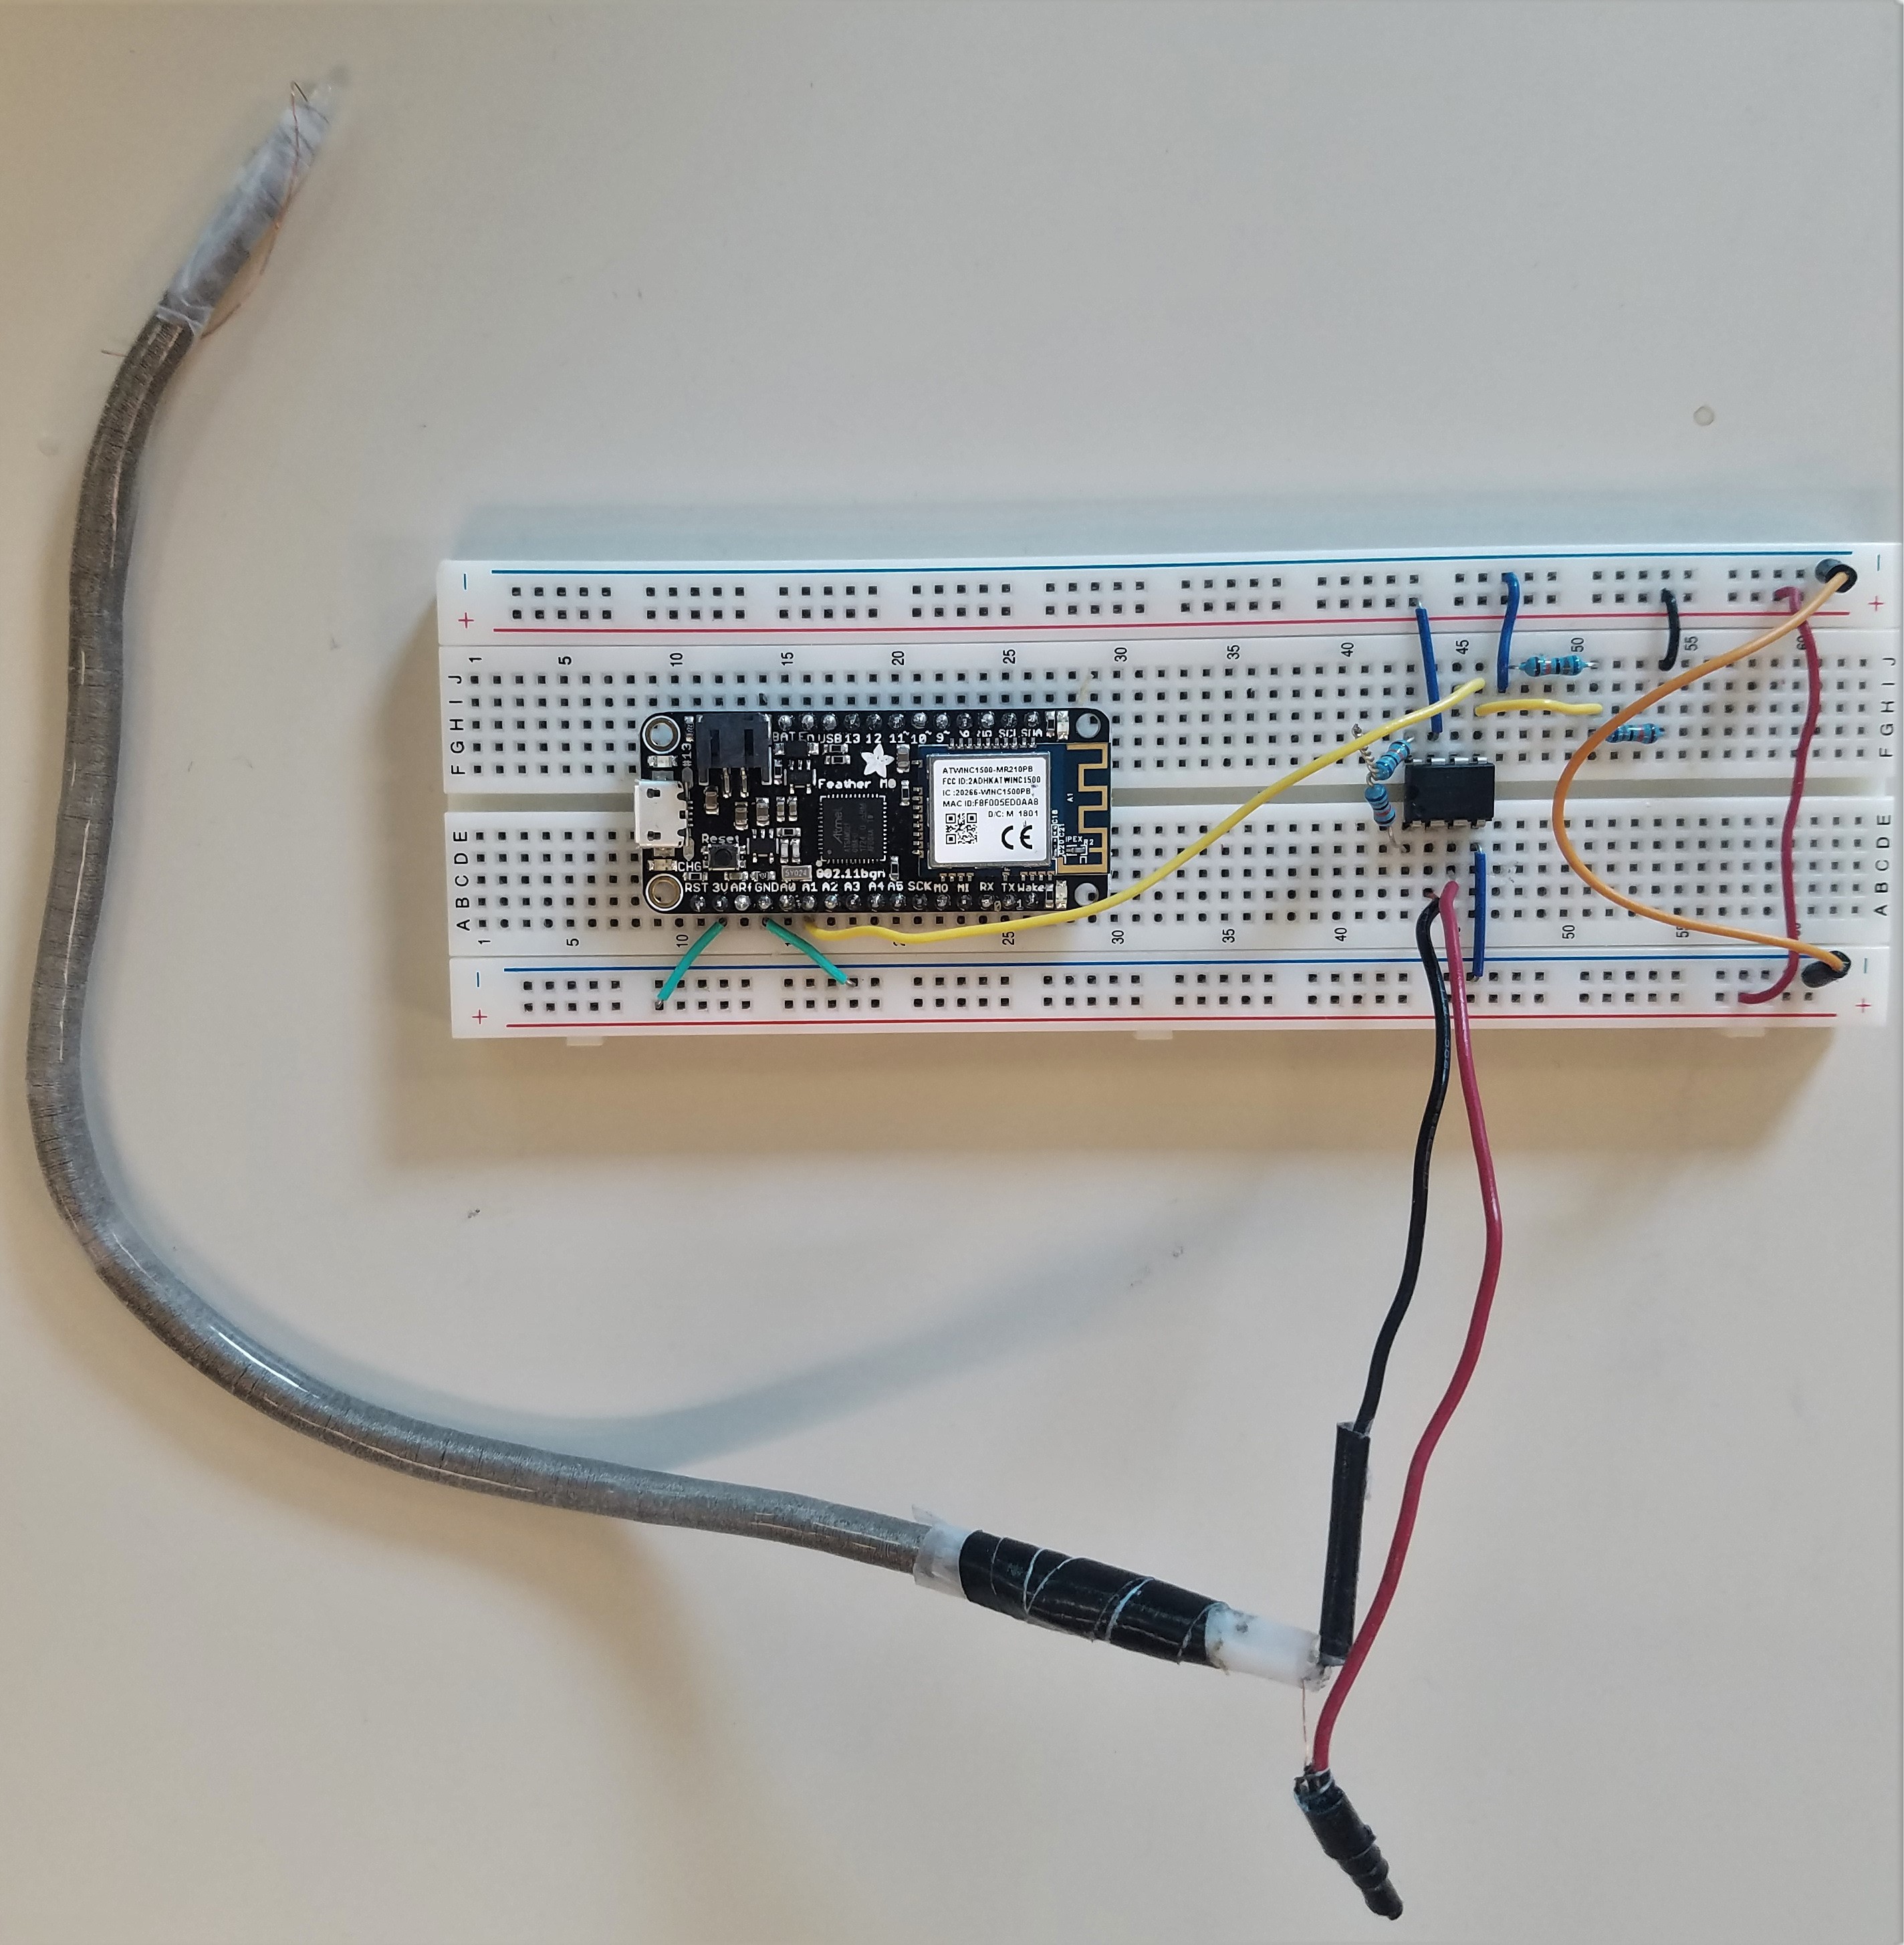
The sensor signal, because of the mechanism of its generation is bidirectional in nature (AC). In order to preserve the negative half of the signal, we offset the data by 1.6V using DC bias. The electrodes of the sensor are connected to “V In +” and “V In -” of the amplifier as shown in the circuit diagram below. The amplified signal is fed to the ADC of the MCU. The signal is converted with a 12 bit resolution, before being wirelessly transmitted to a computing device for real-time classification.
Schematic diagram of connection sensor to microcontroller ![]()
Collecting Analog data from differential potential between two electrodes in circuit
How System work by using micro controller -
3HAND GESTURES & SIGNAL PROCESSING
GESTURES
In a general categorization there are three types of interactions with sensor. 1. Towards the axis (Radial), 2. Along the axis (Longitudinal) and 3. Tangent to the cross-section (Tangential). These three ways of applying force to the sensor make up simple to complex gestural inputs. We have tested our implemented signal processing pipeline with 7 gestures; Tap, Press, Slide, Twist, Stretch, Bend, Rotate.
to see how we interact with such gestures check the following link:
SIGNALS
to provide more insight on how signals collected from microcontroller look like, we added following images:
Tapping Pressing Rotating Twisting Sliding Stretching Bending -
4CLASSIFICATION (While Using Micro controller)
When there is a gesture performed on the input device, the self generated signal is wirelessly sent (e.g. via WiFi) to a computing device for analysis. The computing device employs dedicated signal processing algorithm that denoises the signal and extracts relevant features from the signal. Then the pipeline makes use of pre-trained machine learning models to predict gestures from the inputs. Finally, users receive feedbacks of the classification results in real-time.
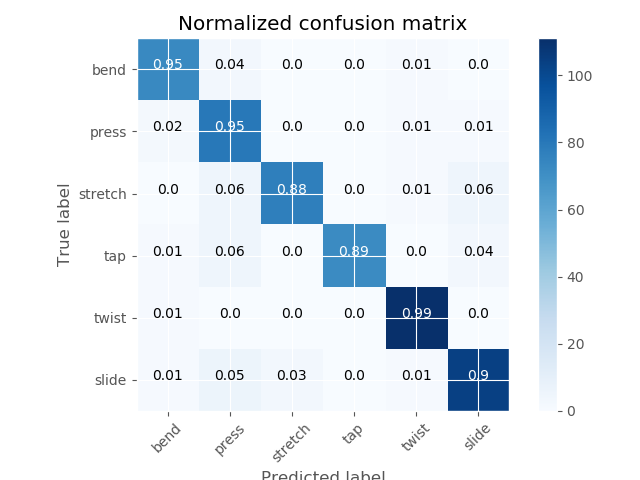
From 10 classification algorithms that we have tested to classify input signal based on 5 feature extraction, Random Forest Classifier produced the best classification accuracy of 90 +/- 2 %.
We arrived at this result by dividing the input data set into 5 stratified K-Folds and carrying out 10 such tests, over two 42 minute data sets collected by different experimentalists. Our signal processing pipeline uses a threshold power level to distinguish and register signals from the noisy input. This threshold is also observed to affect the accuracy scores. However, the above reported result is obtained without optimizing this threshold value. Therefore, our ongoing research to extract more features from the gestural input signals and optimizing the algorithm guarantees very accurate results in the near future.
![]()
Theoretical Confusion Matrix -
5Gesture Recognition System - Using Analog Discovery for Data Aquisition
- In file UserConstants.py change participant_name
- Run DataCollection.py and let the user play with it till n ( any number that you know is enough for your trial session).
- Run DataCollection.py again as a real session. The count goes till m (m = any number that you know is enough for your training session. for our system m = 150).
- Optional - To find training accuracy, uncomment last two lines in file GestureClassification.py and run GestureClassification.py
- In file UserConstants.py, set the variable test_session_number.
- Run Testing.py for test demo.
- Stop and run Testing.py again for first test session
- Optional - In file UserConstants.py, set the variable test_session_number for next roundd of testing.
- Stop and run Testing.py again for second test session
- Optional - Run CalculateMetrics.py for knowing accuracy
SERPENTINE
Hand Gesture Recognition using Self-Powered Stretchable Squeezable Force Sensor based on Triboelectric Nanogenerators Principle
 fereshteh


Discussions
Become a Hackaday.io Member
Create an account to leave a comment. Already have an account? Log In.