Daniel James Evans
-
Testing The Updated/Fixed Spectrophotometer
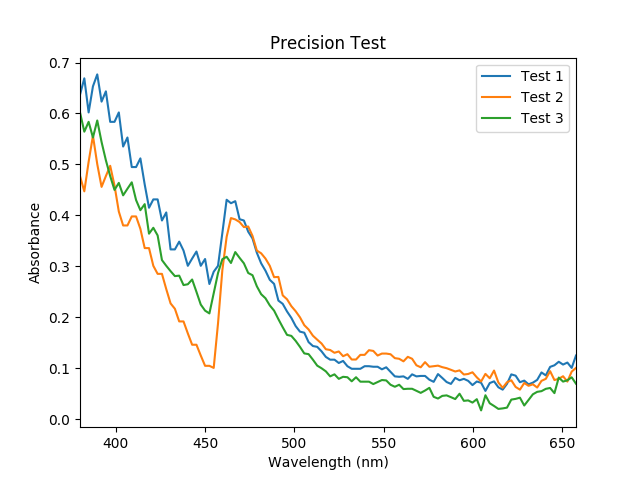
08/31/2019 at 16:41 • 0 commentsAfter making the changes discussed in the previous posts, I tested the precision by measuring the same oil (Extra Virgin Sample 1) 3 times. Here is the result:
![]()
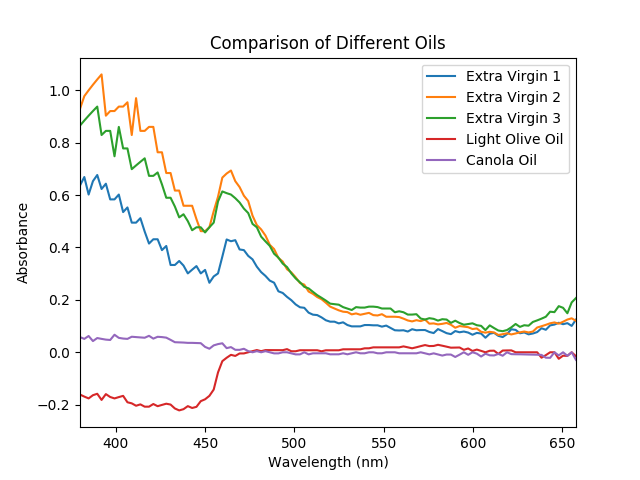
I also re-tested the different oils. I'm surprised (and concerned?) by how little absorbance was detected in the canola and light samples. But in general I think the results are decent.
![]()
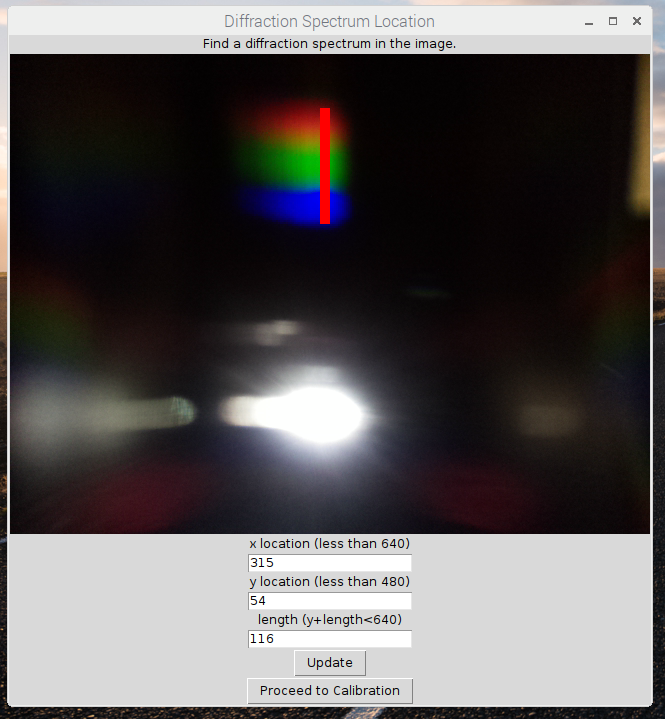
Lastly, here is an updated illustration of the spectrum-finding GUI. The previous version shows inadequately collimated light; the issue is visible in the middle of the spectrum. This version doesn't seem to have that issue.
![]()
-
More Improvements To Accuracy
08/31/2019 at 00:50 • 0 commentsI fixed the bug that caused the x-axis to be reversed.
I realized that the light wasn't fully coherent when it reached the diffraction grating. (The issue can be seen in the middle of the spectrum image; there is white where there should be green and blue.) To fix this, I made a thinner slit and moved the LED back.
I decreased the resistor from 1 k ohm to 330 ohm. As expected, the LED is now brighter.
The holder for the diffraction grating was slightly wobbly. I glued it to the base. The glue is still drying; I plan to perform new tests this weekend.
-
An Improvement and an Unfixed Bug
08/29/2019 at 02:43 • 0 commentsI changed the code so that it takes 3 images and averages them, instead of taking 1 image. This dramatically improves the precision of the device.
I found a major bug in the code: the x-axis was reversed! This escaped detection because there are peaks on both edges of the olive oil spectrum. But when I started averaging images (see above), it became apparent that the right-side peak was much bigger than the left-side peak. This is incorrect; it caused me to investigate and find the bug. I still haven't fixed the bug; I need to do this before taking more measurements. The spectrophotometer is currently NOT accurate (because of the bug); it should NOT be used right now. I hope to fix the issue soon.
-
Data Collection
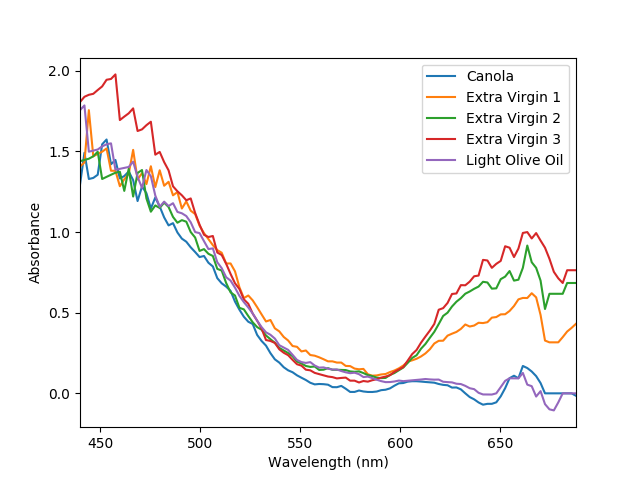
08/28/2019 at 01:28 • 0 commentsI collected spectra from 3 brands of extra virgin olive oil. I also collected spectra from light olive oil and canola oil.
The right side of the spectrum shows a clear difference between the extra virgin samples and the other samples. I'm worried that the left side of the graph is inaccurate. I'm not convinced that canola oil should have that much absorbance at low wavelengths.
Despite the possible issue on the left edge, I consider the test to be mostly successful. The device shows a clear difference between extra virgin olive oil and other oils, demonstrating its usefulness for food inspection.
![]()
Pi Spectrophotometer Tests Olive Oil
An RPi spectrophotometer distinguishes extra virgin olive oil from canola oil and light olive oil.