-
inverting high freq noise stabilizes measurements
02/08/2021 at 20:50 • 0 commentstaking high frequency noise and inverting it back into main signal output for distance is the way to go. the main source of the noise is from voltage spikes, and laser power variation. i will keep track of when laser measurements are out of spec, or out of control and flag them. i also will use the equivalent of a high frequency pass filter to allow the voltage noise thru, and be amplified and inverted.
this filter will allow noise thru that takes less than 50 samples or is spiking. so it is wide range.
output=sense
invertL=invertL*0.98+output*0.02;low pass averages 50 samples
invertH=invertH*0.99+output*0.01; low pass averages 100 samples
invert1=(invertL-invertH)*100;//we compare the curves of the 50 and 100 samples//we limit the response to be within a set percent of output
if (invert1>output+0.1){invert1=output+.1;}
if (invert1<output-0.1){invert1=output-0.1;}invertOffset=invertOffset*0.99+output*0.01;//we use this to generate the dc bias.
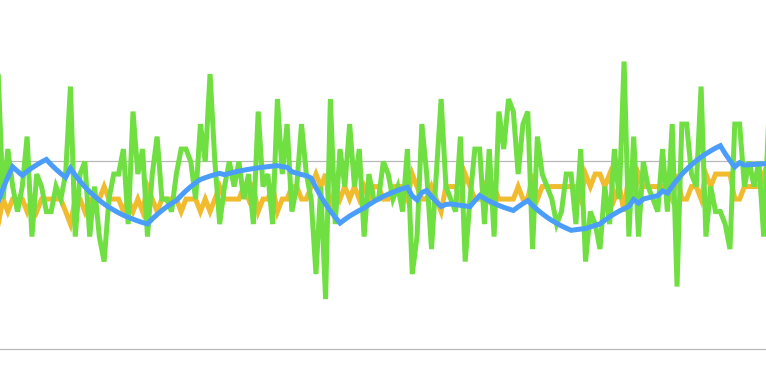
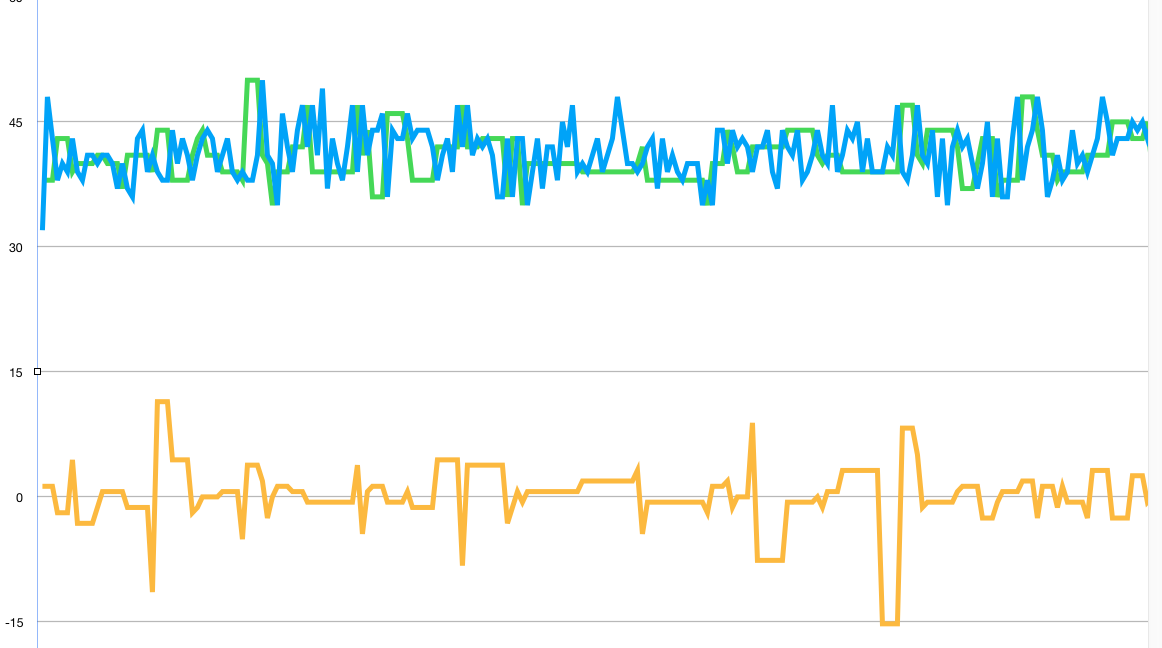
the yellow line below is raw data, with a noise removal adjustment. i still have some work to do since variation is still between 5-8mm in raw data with no additional filtering.
![]()
the green is the raw measurement data, the blue is the in spec data filtered by 10x
the yellow is the noise compensated raw output. i'm still optimizing gain which currently is set to 1.175
Serial.print(output-(invert1-invertOffset)*1.175,0);//raw output- inverted noise
this chart is from 2 seconds after sampling started at ~30-50 samples a second
-
removing voltage variation of +/- 0.01 averave voltage spikes reduces variation.
02/04/2021 at 11:11 • 0 commentsi have started coding in automatic adjustments for two reasons. 1 simplifies things, and 2 the voltage bias adjusts over time slightly. the file that shows over 5000 samples of data is uploaded here as filteredeffect.xlsx and arduino code used for the sampling and filtering is here arduino_2_4_filtering.ino
previously i have had excel datat to suggest lowering noise was possible and i was able to do it short term by hard coding the values and calibrating the adc voltage of Arduino with volt meter. by allowing automatic adjustment by the code, manual measurement and calibration is not needed.
so i'm average the voltage over 20 samples and then compare to raw data.
i hard encode the range to look at.
#define min_delta_V 0.01
#define max_delta_V 0.01i also decided to have data repeat last good value, when voltage out of control limits, this is just so i can compare the same data, and do it live instead of thru excel. i do export it all to excel, but i get all the data in a single run and get to see how the filtering works. i am starting with filtering out out of spec low voltage and out of control variations. in the near future i will be implementing correction from all but the out of spec voltages. for now i am just rejecting these measurements and showing last known value in spec and in control
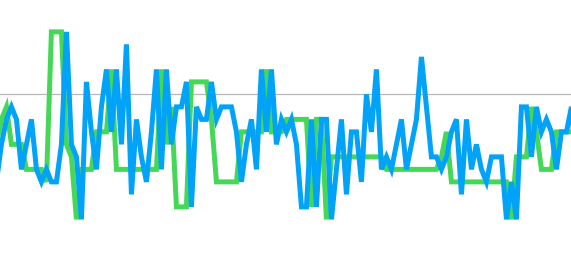
most the data looks like this the green is the filtered.
![]()
but sometimes the data looks like this
the blue is the raw data, the spikes are rejected from looking at the voltage levels.
![]()
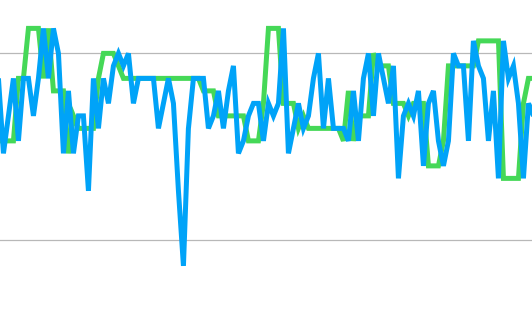
here is another one
![]()
it does not filter it all, but it makes a difference of filtered is a range of (max-min) of 18, versus blue raw data that is a range of (max-min) of 25.
this is only the first step, reject out of control values and out of spec measurements.
next step is to in software on Arduino is to adjust noise and reduce variation from compensation.
there still will be rejected measurements, for example out of spec low voltages because they are on the range of laser power and bias of laser.
currently i reject measurements that are out of spec, out of deviation limits of +/-0.01v, and replace those values with known good values in filtered data, and show unfiltered data column as well.
i should also add this. the above values are just replaced values when voltage is out of control limits
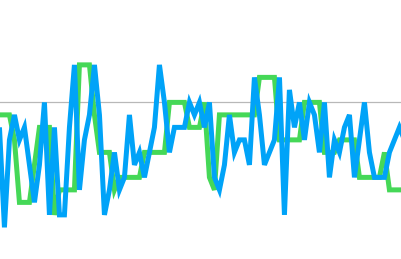
here is a graph that also shows voltage delta x100. the spikes are where the green values are replaced with last known good value, and the blue is the raw data.
![]()
-
two different frequencies of noise. laser power and voltage spikes, phase issues
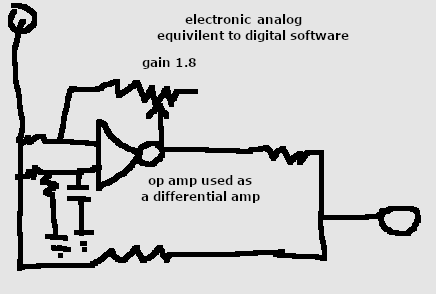
02/02/2021 at 19:20 • 0 commentsi need to explain. this is not a filter in the normal sense. it does not average out the data. the high pass filter described below is just used as a feedback loop into the raw data. the raw data still needs further filtering, but here we are just trying to reduce variations from noise. the raw output will always have wide swings, until properly filtered if sampling at high speeds for example 30-50 times a second. in software the filtering is like this circuit below. the gain is adjustable to cancel out the correct amount. the raw dat goes in, and comes out with inverted difference of a low pass filter and a comparator of raw data from differential amplifier that gains the signal to invert and compensate output. it is more like noise cancelation, or noise reduction, as it still leaves most of the raw data value there, just removes the spikes that are above average.
![]()
i'm trying to get accurate high speed sample measurements, i know the sensor can do better accuracy when measurements are at 1 time a second. but when doing 30 times a second sampling noise issues are an effect 1 of the following:
1) out of spec voltage low measurements on the chip (even when voltage regulation is stable and external capacitors)
2) laser power variation most likely from voltage spikes and internal compensation
3) voltage spike swings between measurements.
it is difficult to filter out the voltage as it's phase slightly shifts, and the laser power variation is similar. so i'm taking a different approach, isolate the higher frequencies to cancel them out.
here is what i came up with.
(f(2)*0.9+ f(1)*0.1 -f(2) )*gain(1.8)=Δ higher frequency pass filter that is inverted and applied to the raw data
f(2)- Δ=compensated distance output
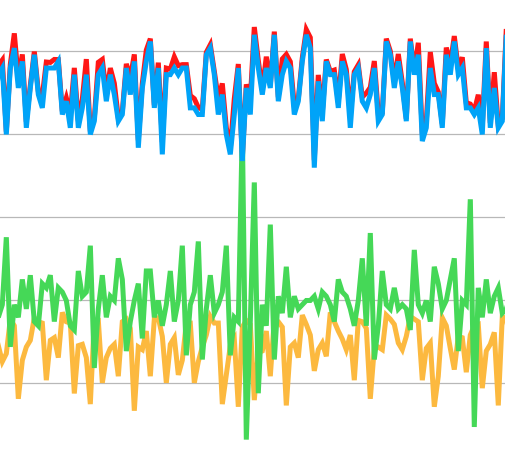
this graph shows old method. red is 2.2 less than blue. (max-min)
![]()
green: voltage Δ x 100, yellow: cds sensor for laser power output
blue: output variation unfiltered MM distance 30 times a second variation (max-min)=34
red: trying to compensate voltage and laser output. deviation (max-min)=31.8
i'm having issues looking at voltage and laser output and getting more than 2.2 reduction in noise (all of this is with removing out of spec voltage measurements)
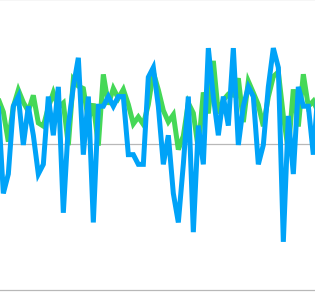
now when i drop the looking at the voltage measurement except for making sure it is in spec, and drop the laser measurement, and just look at removing the high frequency components of the data here is what i get.
keep in mind this is not averaging it is inverting the high frequency.
![]()
![]()
with using a high pass filter to create inverted feedback to the raw data the delta of it we get a variation (max-min) of 13.8 so this seams to be the way to go. keep in mind these are raw measurements and when filtered properly should average out over time. i can easily implement this method of noise reduction before filtering data. gain needs to be automatically determined, as well as dc offset so still some more work to do. in this case gain was set to 1.8 and offset was 20 so graphs data would overlap.
data used is in files reduceNoise1.xlsx, and reduceNoise2.xlsx
so next is to move out of excel and into real use.....
-
making data and info public
01/30/2021 at 11:35 • 0 commentsthe info here includes some raw data and some loose code for monitoring distance, laser output and chip voltage, i have yet to upload the compensation methods as they are complex and i have yet to test them. it is easy to graph data and with a whole set average data and look at how samples and noise works, but there are issues of dc bias on the noise as well as gain that need to be better understood. what i can tell for sure so far is that even though regulator power can remain stable the chip itself has power spikes, and internally can compensate for noise, except when it is out of the spec range of the chip voltage.
if your having issues with one out of 100, or 1 out of 50 huge outliers it is because the chip power use is spiking (assuming laser)
-
votage has a higher consistent variation with distance change over time
01/21/2021 at 15:58 • 0 comments![]()
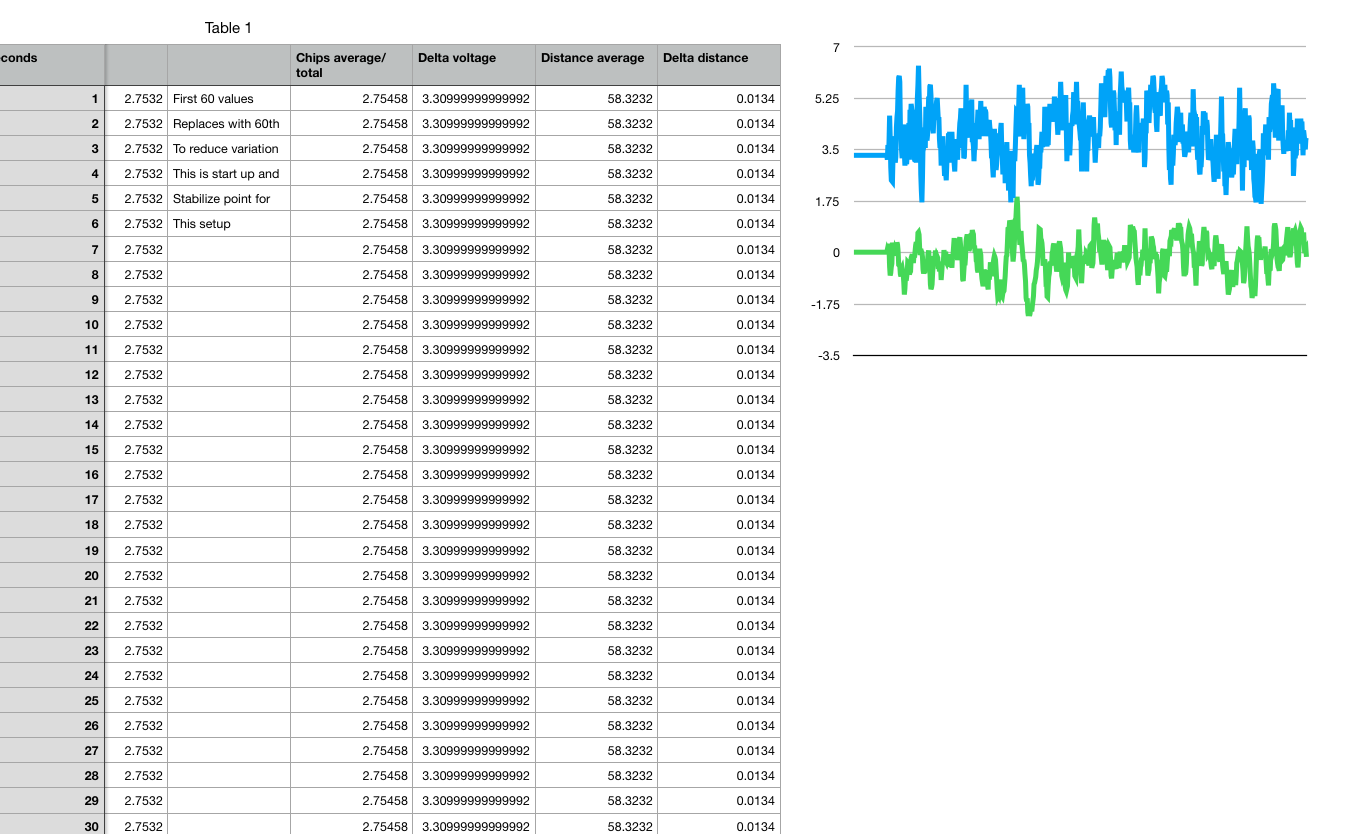
the blue color is voltage variation x 100 the distance is scaled by 1. i dc offset the voltage by 5 for so they could be seen next to each other. they do not perfectly overlay, but it is enough for me to design a run that takes distance_mm-((ΔchipV) x100) and see if total distance variation reduces
my average voltage per the setup is
2.75458
so i will take sample distance -(vsample-2.75458)x100 to get my adjusted distance.
for original data range of min to max was 2.1688mm measuring a distance of 58mm with 800 averaged samples of 1 sec (but averaged each 30 times a second)
here is how it samples with voltage compensation.
-
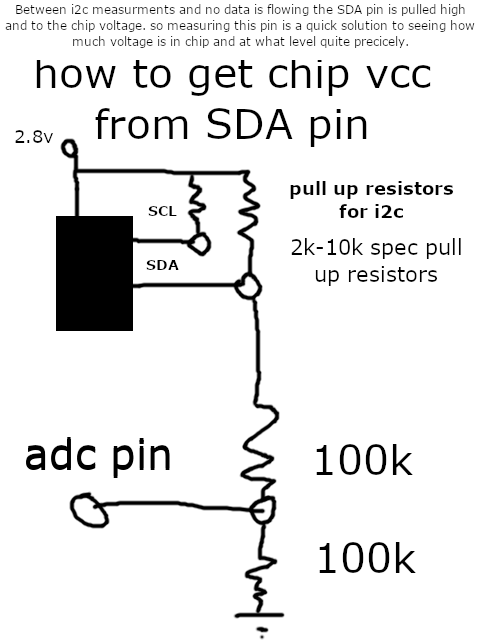
here is how to measure voltage to vl53l0x chip. thru the SDA line
01/21/2021 at 02:46 • 0 commentsthe SDA line is pulled high with a 2k to 10k resistor normally. so when the i2c is idle, measuring the SDA line pin with a 100k resistor, and 100k to gnd will put the adc within a range to see up and down voltage changes. you can use gnd, or a output pin put to gnd, you will need to verify voltage with a volt meter across gnd of 100k resistor and adc pin to adjust gain to see what actual voltage is.
![]()
-
sample data suggests temp has no direct correlation to measurement drift!
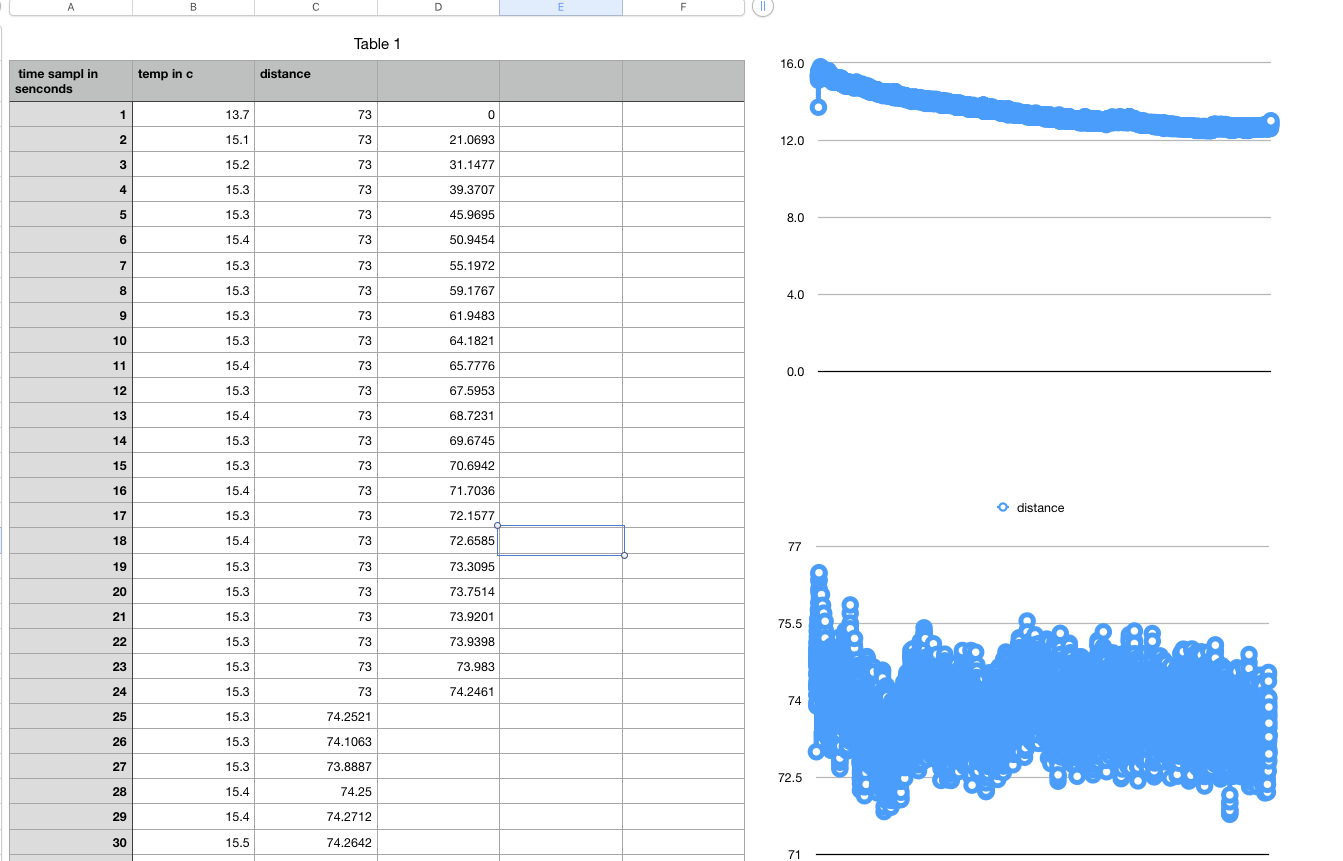
01/21/2021 at 01:01 • 0 commentsit is interesting, i logged temp changes over 8 hours, along with measurements over 528 minutes worth, and i can say fore sure in my case, that with my version of the VL53L0x, that temp is not the main noise issue! if it is then it is from a voltage regulator or something not directly related to my temp. here is 8hrs of temp data, and 8hrs of measurement data.
the first 24 values are required for stabilizing from zero. temp is averaged out over 10 samples with average showing every second but it is updated 30-50 times a second as with VL53L0x lidar. i left heat off in a room and the temp went down consistently over night from about 16deg c to 12deg c. (60F to 53F sensor variation was wide over this time but consistent after stabilizing, there were some up and downs, but it is not consistent with temp. more than likely it has to do with voltage in chip, and possibly temp effect on voltage regulator. needless to say it is quite obvious that temp is not directly related to sensor variation!
first several values of distance are set to 73 to allow for a zoomed show of variation from +/-3 from 72 on axis rather than +/-73 degrees on axis. there are about 32000 values shown here! data is in article as excel, and cvs and as raw data.
![]()
10x improve VL53L0x. Volts, laserPOW analog mod
collecting data on distance variation, room temp, voltage on chip, and laser power, results: laser and voltage compensate improve accuracy!
