David H Haffner Sr
-
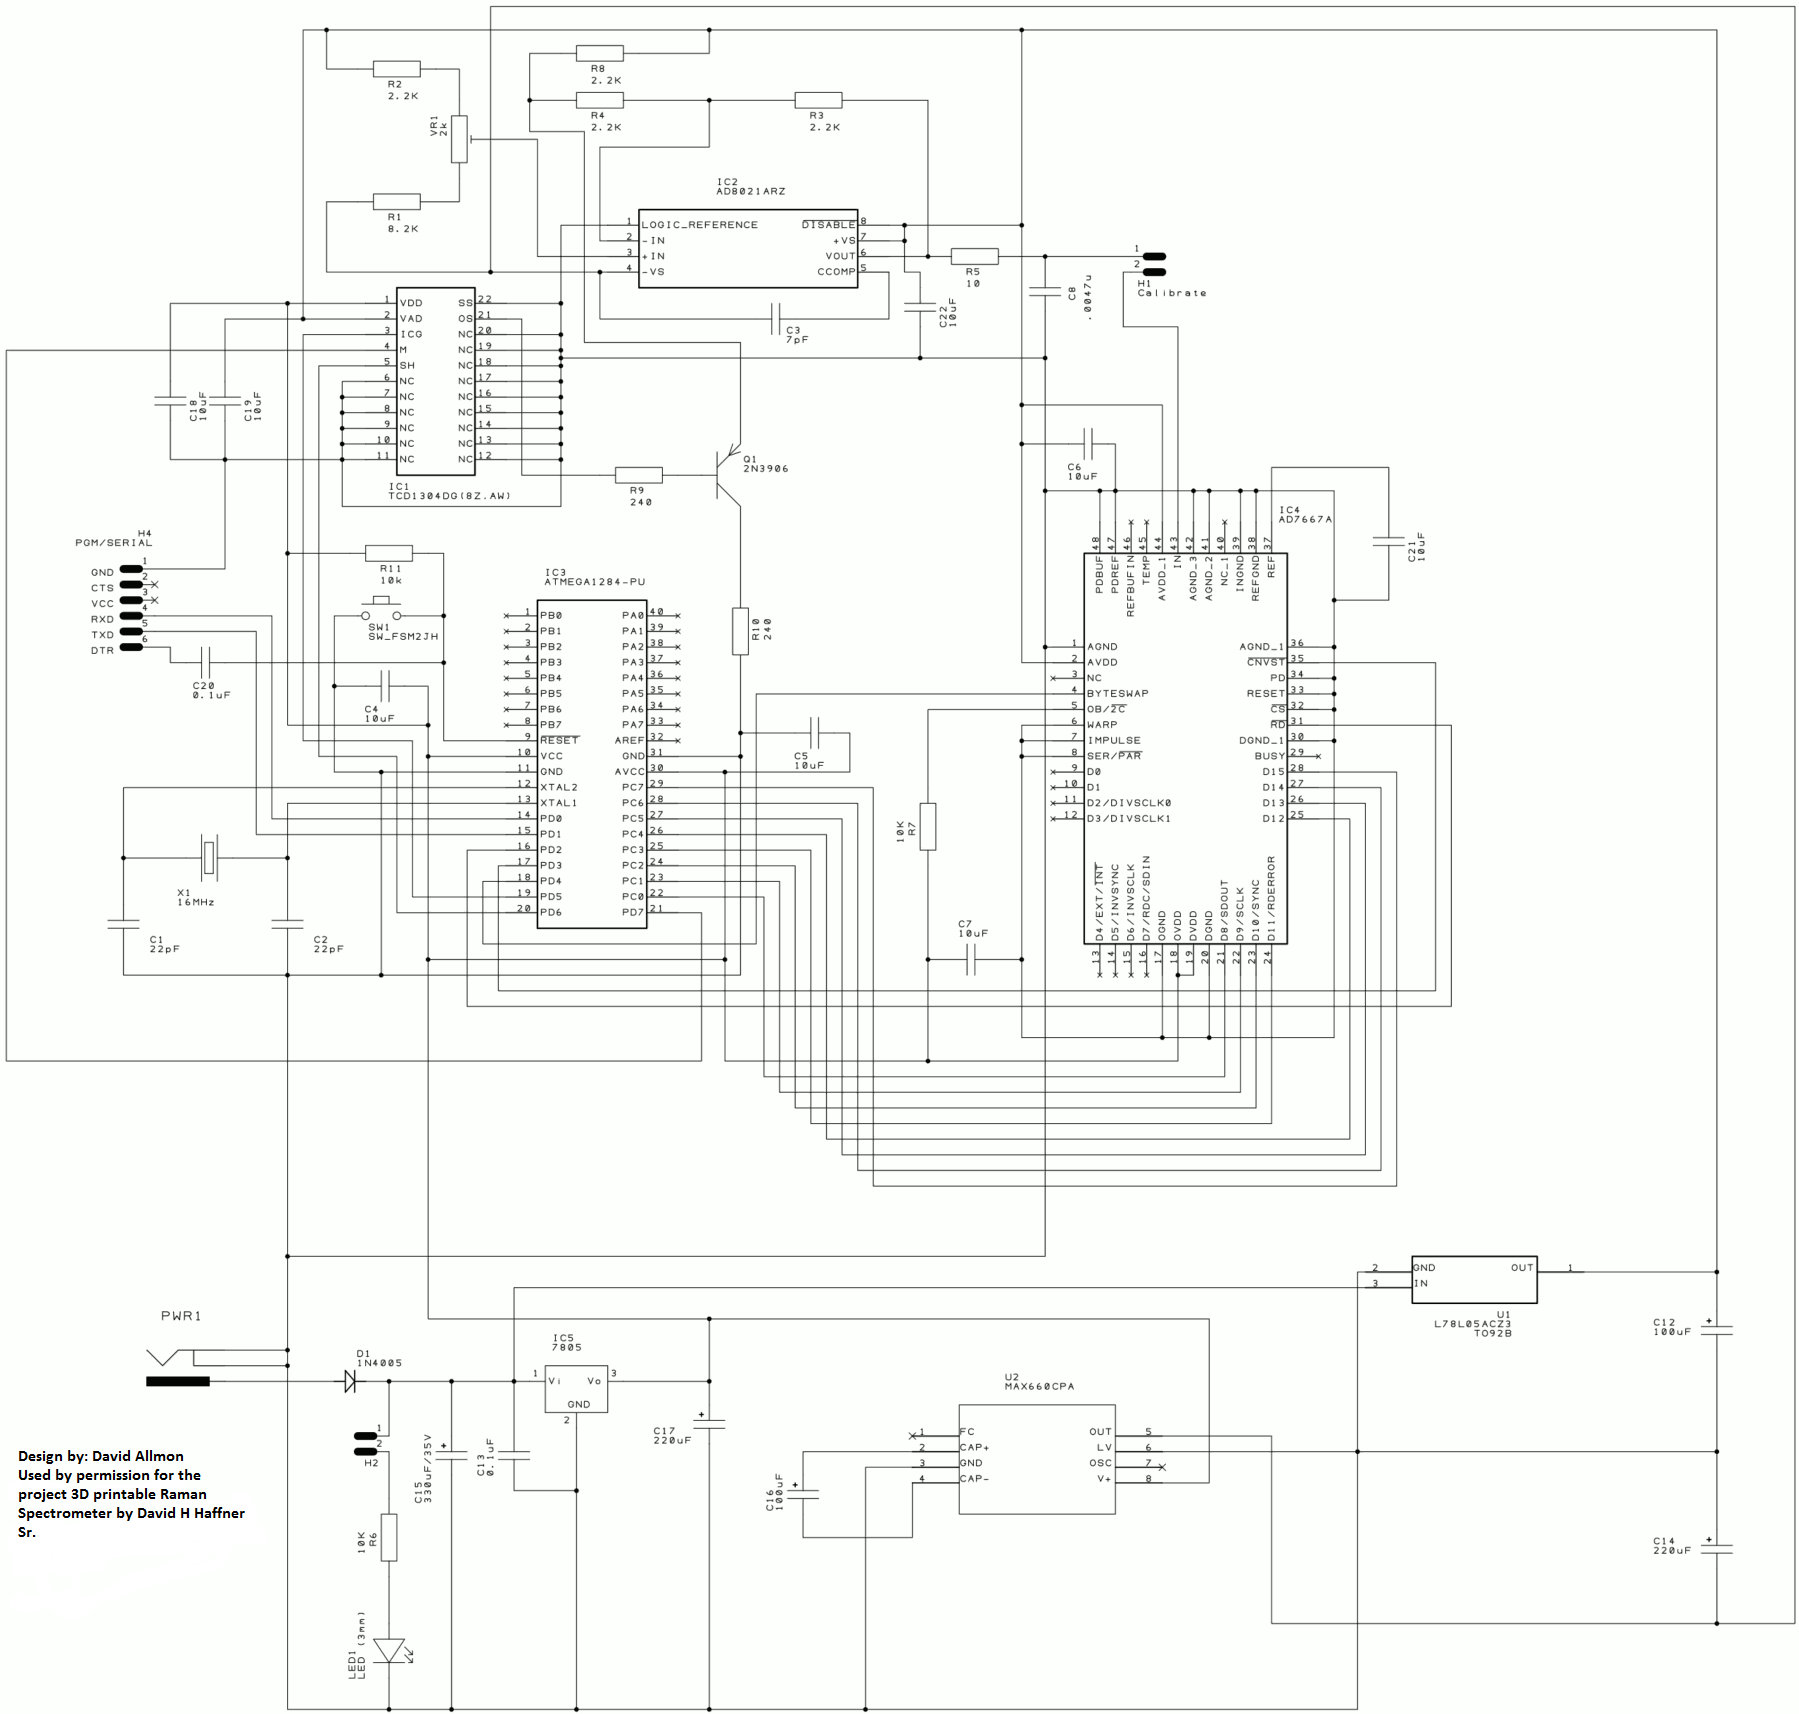
**Updated Schematics** for CCD Driver Circuit/BOM/ 3D Printable Raman Spectrometer
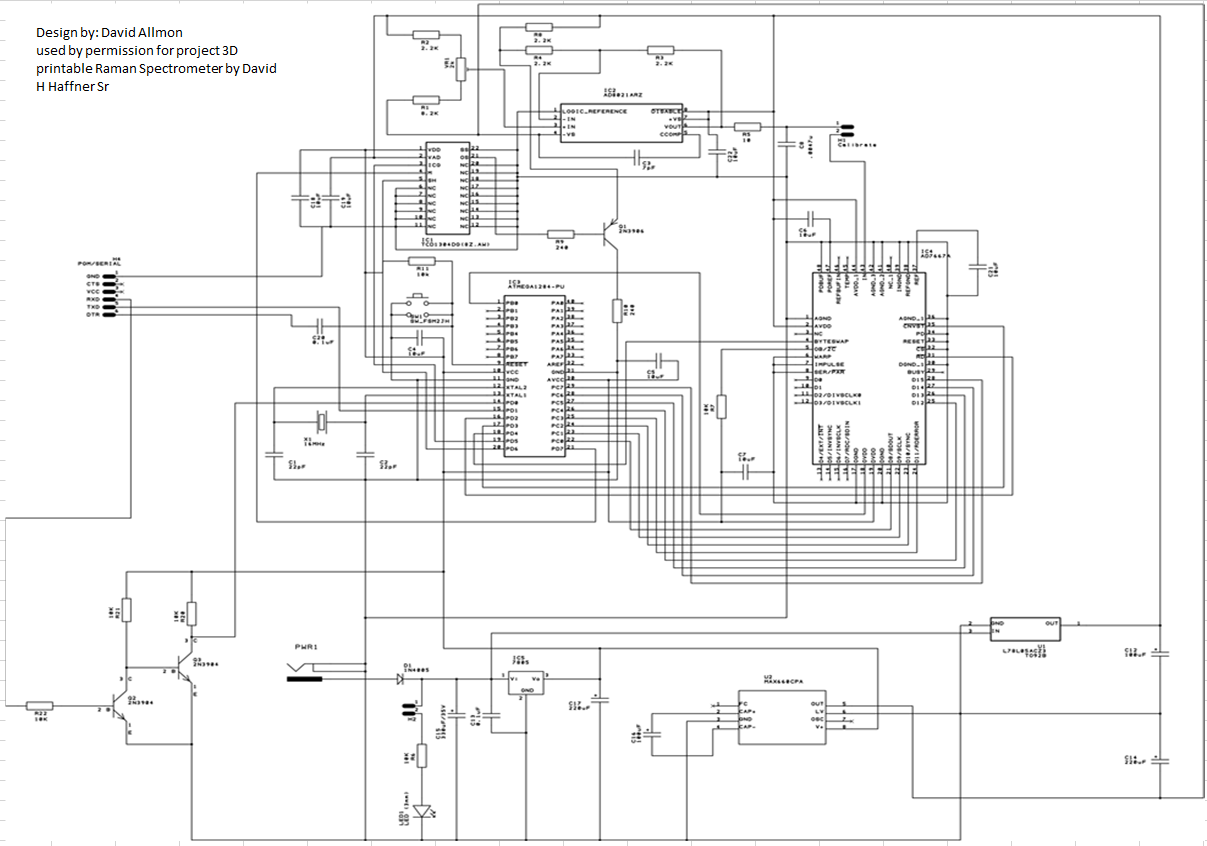
05/03/2017 at 12:28 • 0 commentsHere is the updated schematics for the CCD/TCD1304DG driver circuit and an updated BOM also.
![]()
![]()
-
Major Circuit Board Re-design/ Updated Gerber files and Design Spark project files
05/02/2017 at 21:41 • 0 commentsI have been working with David Allmon on this CCD driver circuit for a couple of months now and there seems to be a unique problem with the circuit and I do not want to prematurely post the results nor post erroneous build files so there needs to be some explanation and also some help from anyone out here with mucho experience in electrical engineering, especially with ADC circuit design and operation.
Apparently, David Allmon didn't have this problem until he started using the AD7667 ADC, even though the data sheet calls for the AD8021 op amp as it's pair up component. We have been kickin' ideas around and this guy is brilliant no doubt, I just think the more grey matter on this the better, it would be so greatly appreciated!
Well here is part of the problem;
"The ADC is prone to latchup when OVDD is brought up at the same time as DVDD. OVDD needs to be off until DVDD has reached 2.4V or so. There is a fix for this. I cut the trace around pin 18 of the ADC in two places to isolate it from the 5V supply. Then I run a wire from pin 1 of the ATmega1284 to pin 18 of the ADC. A little firmware tweak and the OVDD line is controlled by the MCU, which brings OVDD up after its own 5V comes up. OVDD on the ADC only draws around 200µA, so it is safe to power through the MCU. OVDD is the voltage supply for the MCU interface on the ADC.
Even though Dave made the fix for this both on the board and in the firmware, there can still be a problem with latchup if you have the USB plugged in before powering up the board. The board will be powered by the current going through receive line and the protection diodes. It will be powered and the MCU can't prevent latchup on power up. Not sure why. It is probably already latched up at that point. On all boards I do with a USB-TTL converter I have begun putting a 2-transistor buffer that leaves no path for the USB-TTL transmit line to get to VCC."
Ok, so that's that little tidbit. Here is the link to his website for the full explanation; http://davidallmon.com/pages/ad7667-spectrograph - board re-design and circuit changes
Also you will find the new gerber files and Design Spark project files there also, I will have them available here and on Github also.
Ok so that's the status update we are workin' hard on this but it never hurts to get a little help from UR friends!
Thanks David H Haffner Sr :)
-
ATMega1284P Dev Board
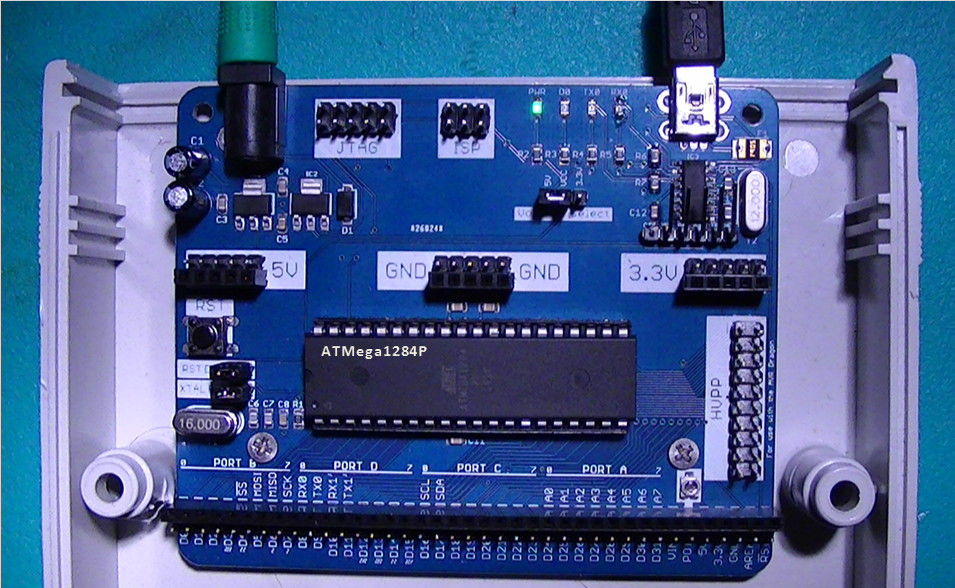
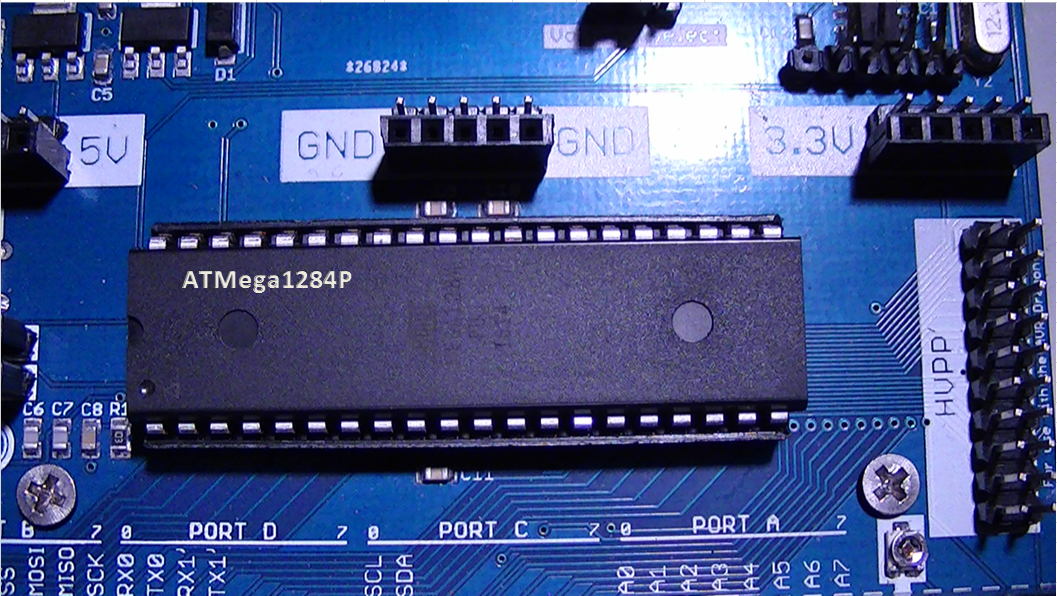
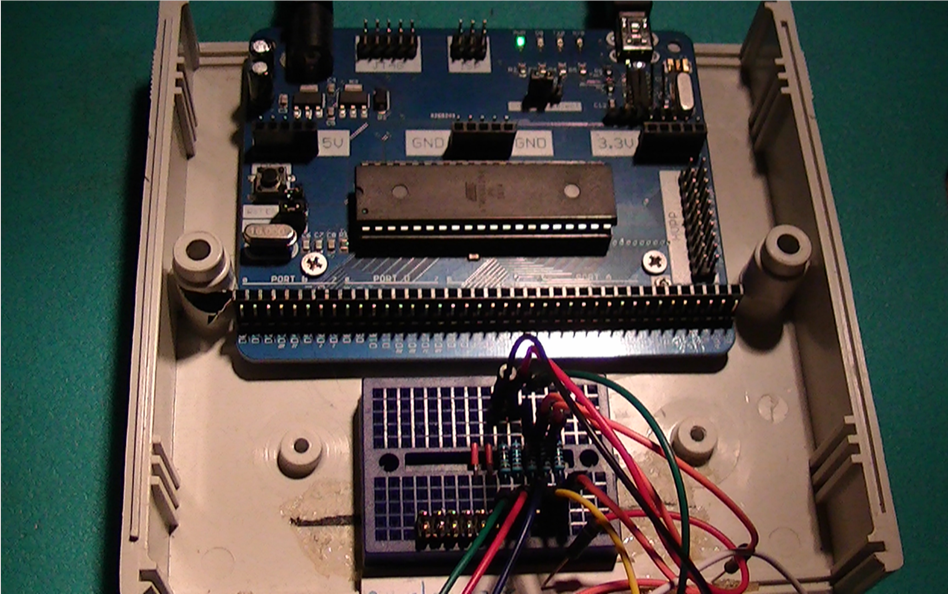
04/29/2017 at 17:57 • 0 commentsThis is the latest pics of my Dev board with the ATMega1284P chip;
![]()
![]()
![]()
Available at Tindie.com but comes with the ATMega32 chip already installed and ready to go.
-
BOM for The TCD1304DG Driver Circuit/ATMega1284P
04/27/2017 at 21:45 • 0 comments*UPDATE* 4/28/2017 7:35AM
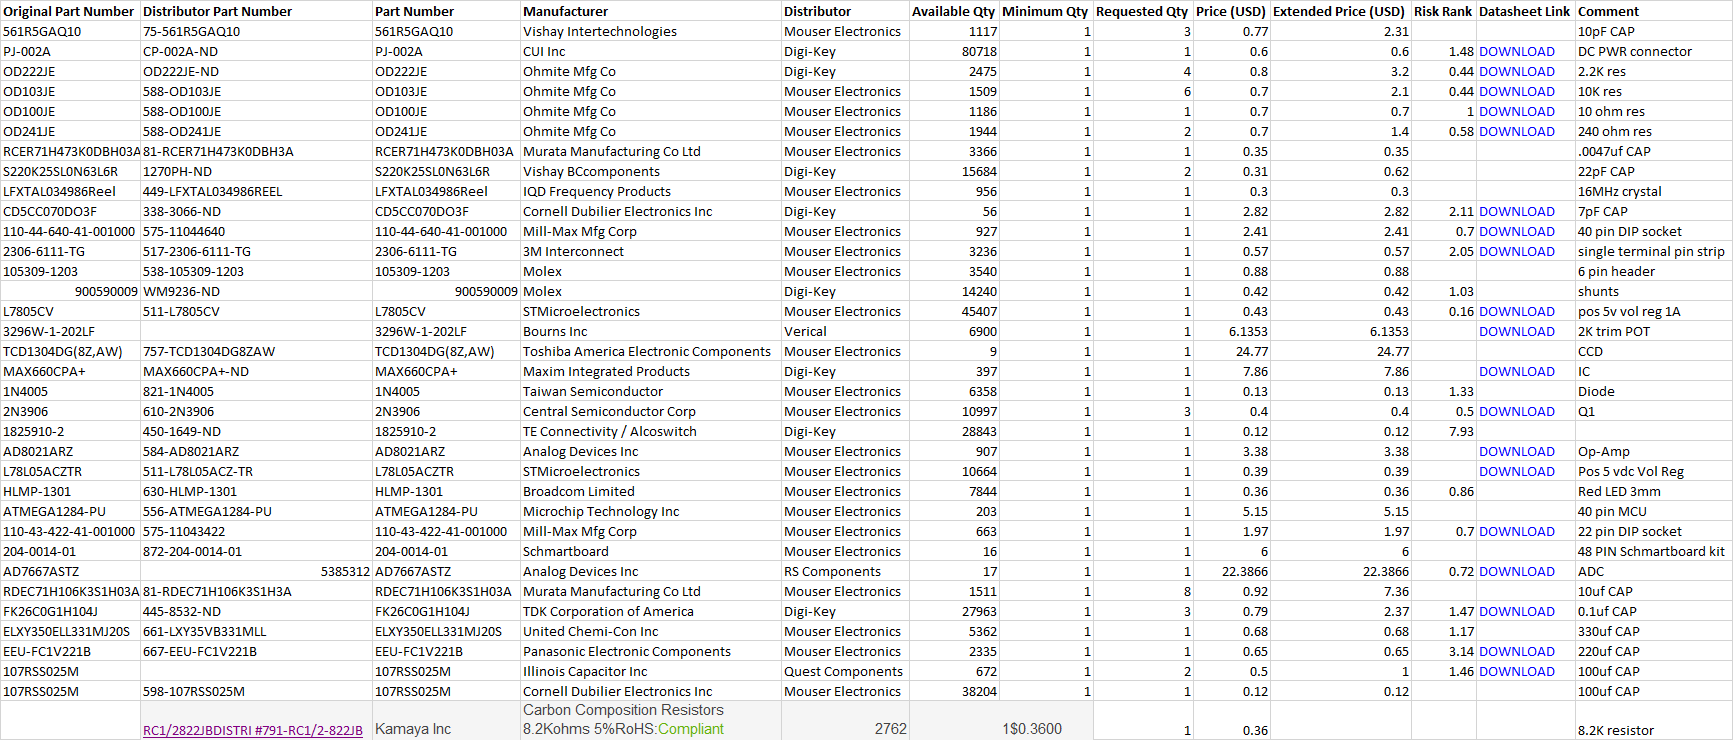
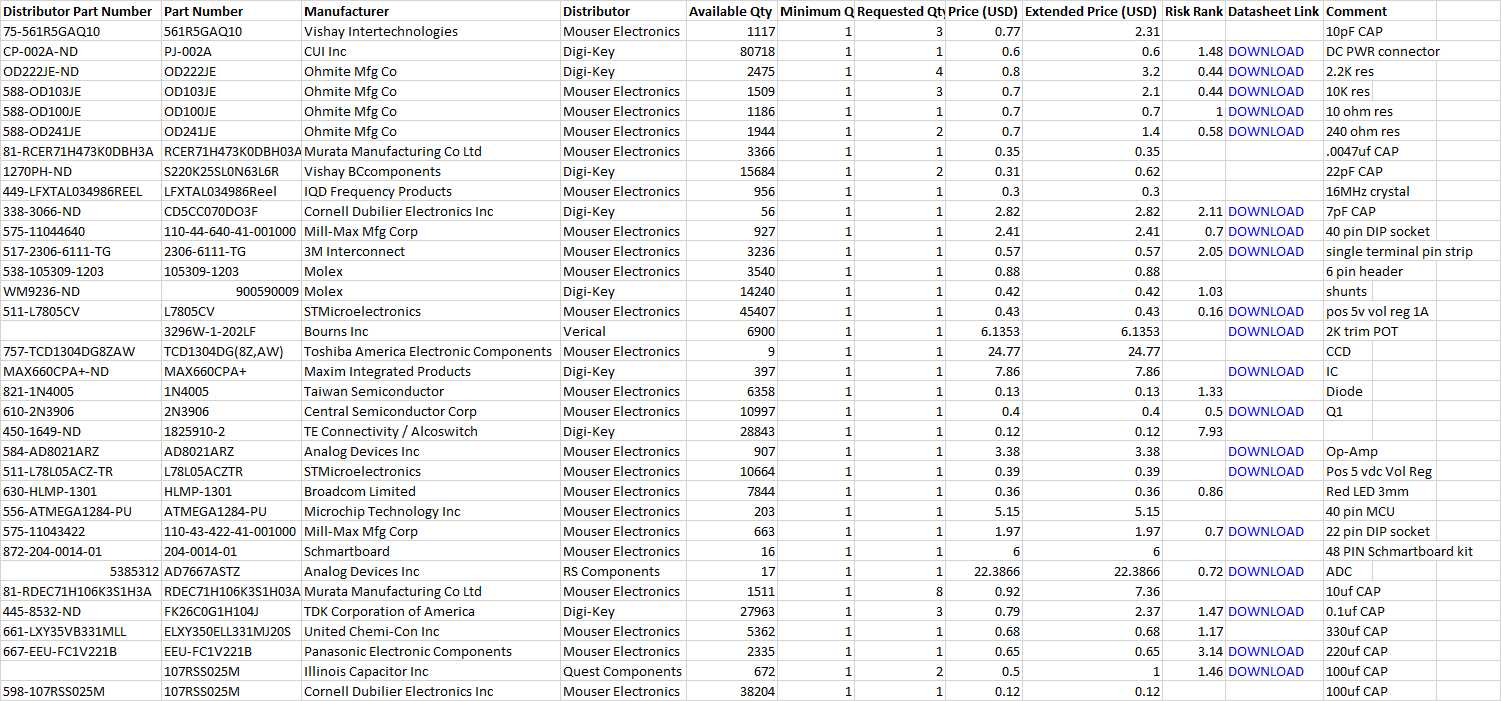
I updated my BOM and included a "comment" section at the end that gives a description of the component as it relates to the part # for better clarification, and uploaded a csv file version in my files section for you to download.
@Sophi Kravitz Hipped me to a great tool called FindChips, she may have sent individuals the email already, but I went ahead and created the BOM for the driver circuit for the CCD detector. What an easy way to create a BOM!
Here is the link for my BOM...
http://www.findchips.com/u/list/28511-3d-printable-raman-spectrometer
![]()
![]()
![]()
![]()
:)
-
1616 Research Lab Files for the DH4.0 V4 DAV5 V2 and DAV5 V3 Spectrometer
04/24/2017 at 23:59 • 0 commentsI have uploaded 1616 files from Jan 2016 - Oct 2016, which encompass all documentation relating to my first spectrometer build the DH4.0 v4 to the DAV5 V3 and all related absorption and emission spectra and excell files, PNG pics and data tables ect.,
The zip file is 83MB (quite large,) but a lot of information contained there in, even all my CAD files for the DAV5 V3 Raman spectrometer build. I still have about 9000 files left to go and trying to figure out a better platform for organizing the info like the NIST uses and others for data acquisition and downloading.
I feel this is important work, because it demonstrates the viability of citizen scientist and hobbyist's building instrumentation such as this and acquiring the same quality scientific results as the professionals do.
So this zip file is available only at my open source website at http://osf.io/x9gm6/files/
Just scroll down to were it says; "google drive files," and you will see it.
![]()
![]() In process of enclosure re-design to accomodate the TCD1304DG detector ( the board dimensions are 100mm x 100mm) no way around it, both analog and digital circuitry are located on same board. I could not extend the PGM (serial port) because the TCD1304 does not behave properly and can be damaged by extending wires beyond 4".
In process of enclosure re-design to accomodate the TCD1304DG detector ( the board dimensions are 100mm x 100mm) no way around it, both analog and digital circuitry are located on same board. I could not extend the PGM (serial port) because the TCD1304 does not behave properly and can be damaged by extending wires beyond 4". -
Synchronized Pulse Generator With The TCD1304DG MCLK Timing sequence
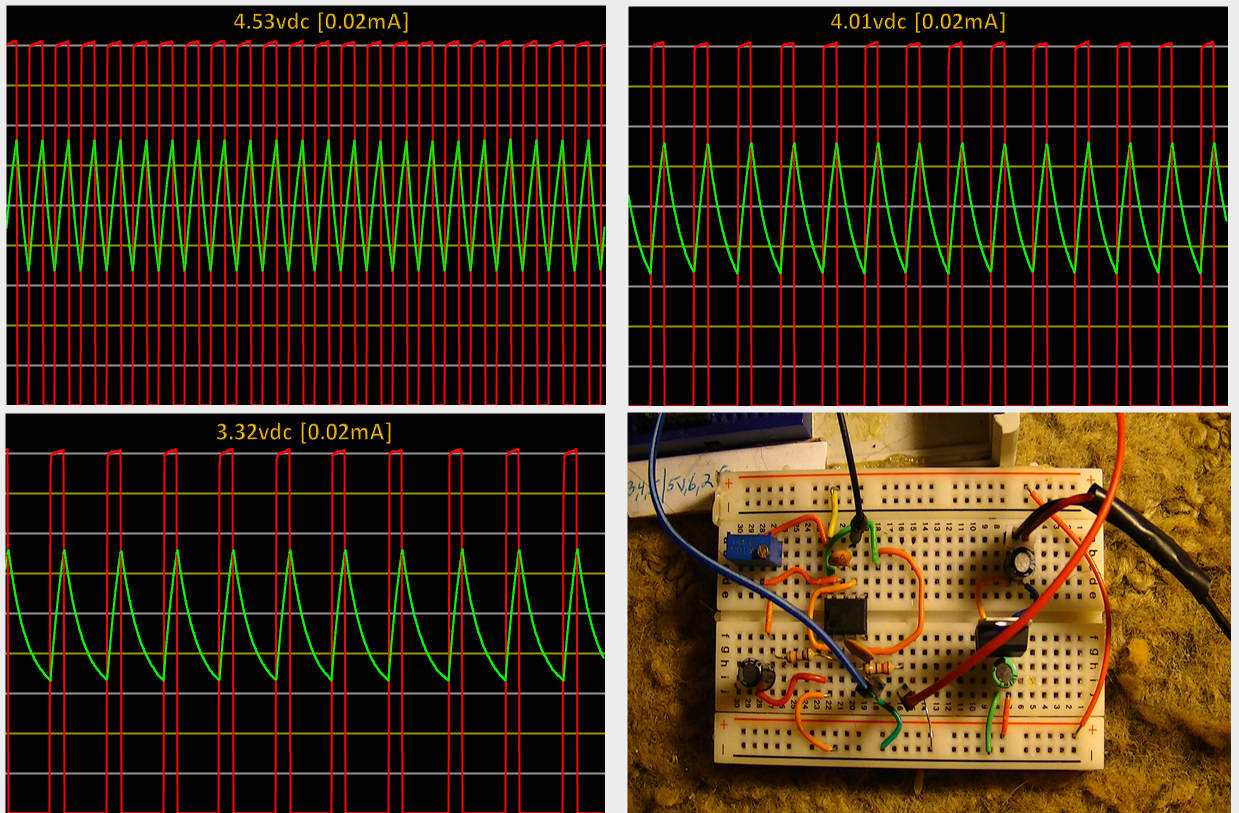
04/23/2017 at 07:44 • 0 commentsWhile I am waiting for some component parts to arrive this week, I modified my 555 timer pulse generator test circuit to be in sync with the TCD1304's Master clock sequence. I used an L7805CV 5vdc + voltage regulator and 2 well placed ceramic disk capacitors at pins 6 and 3, to smooth out any ringing and keep a lot of the noise down and got the pulses to be quite tame.
I am providing my schematic design and plots, along with the mathematical equations to solve for T1 and T2 timing sequences.
Timing is set at 10ms at a frequency of 470 Hz (due to L1 (470uf fixed induction coil at pin# 3)
The circuit can be further modified to be a mono stable circuit by untying pins 2 and 6, use pin 2 as the triggering incoming pulse and make reset and trigger input (pin# 4,) momentarily low to reset timing cycle, otherwise keep reset at vcc.
![]()
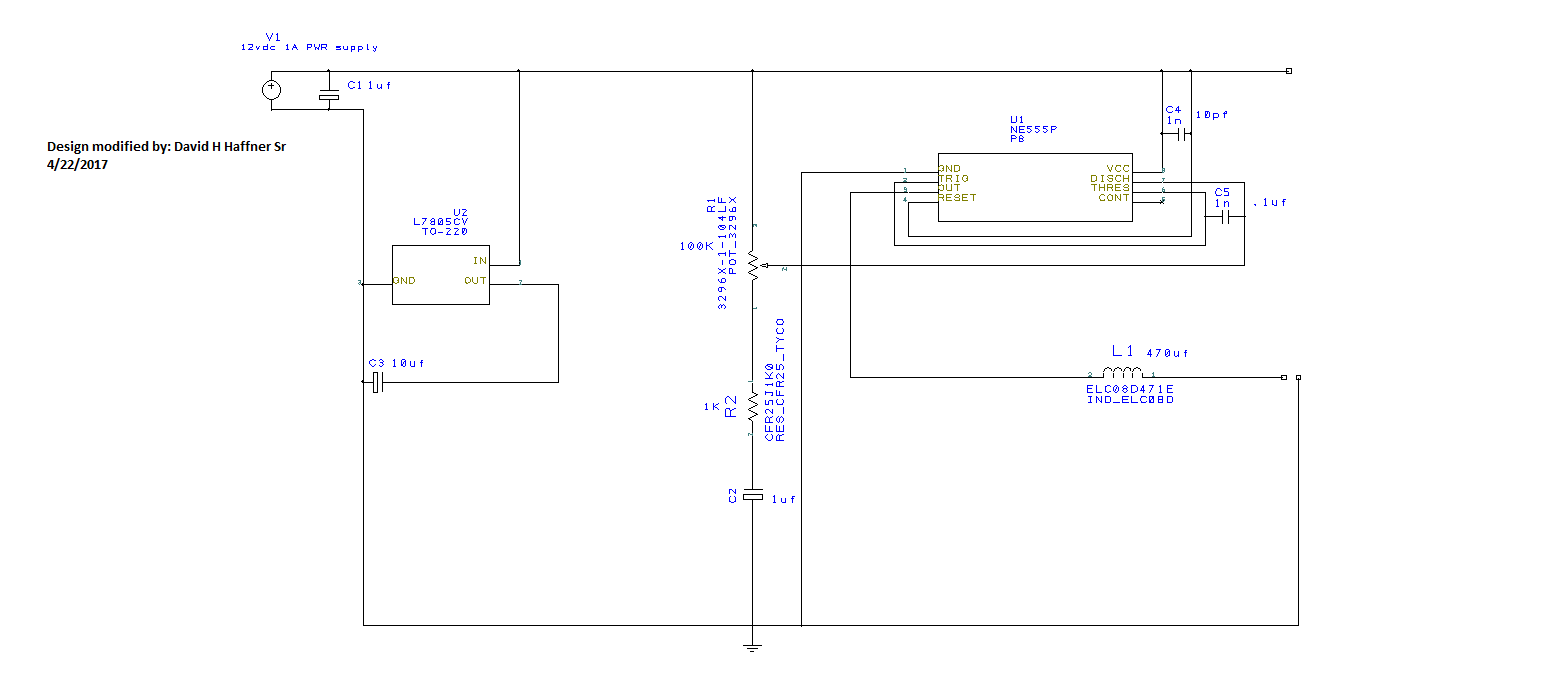
Below is the schematic for the circuit in the picture above:
![]()
L7805CV voltage regulated Pulse Generator using a 555 Timer
12vdc supply voltage
L7805cv volage regulator
R1 = 100k (trim POT)
R2 = 1K
C1 = 1uf (electrolytic/35v)
C4 = 10pf
C5 = 0.1uf (ceramic/104m)
C2 = 1uf (electrolytic/35v)
C3 = 10uf (electrolytic/35v)
L1 Induction coil (470uf/7.09ohm @ pin# 3)
Solving for Timing sequence of T1 and T2:
T1 = .693(R1+R2)C1
T2 = .693(R2)C1
Frequency = 1.44/(R1+2R2)C1
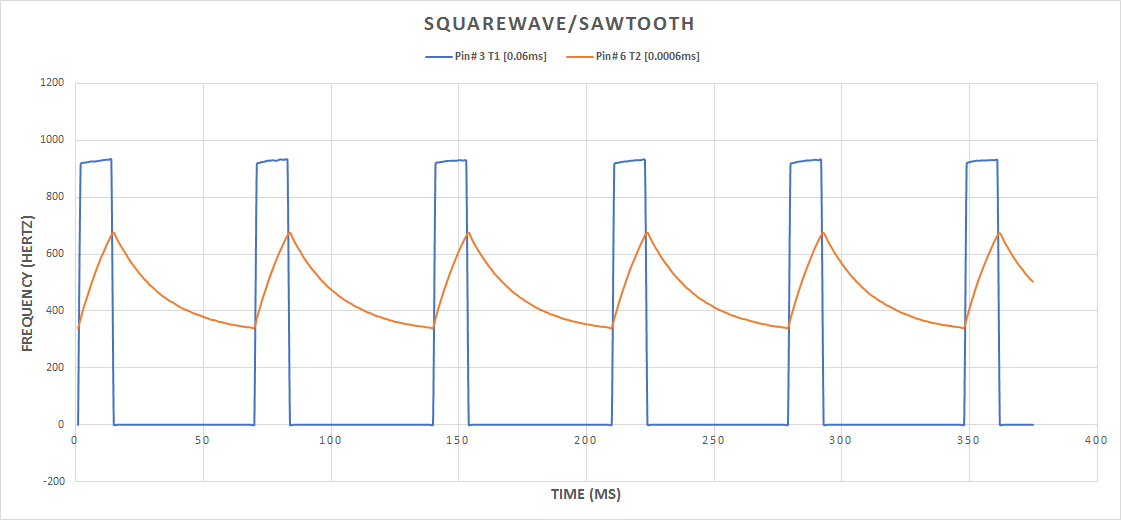
![]()
The plot above was done on processed using Excel
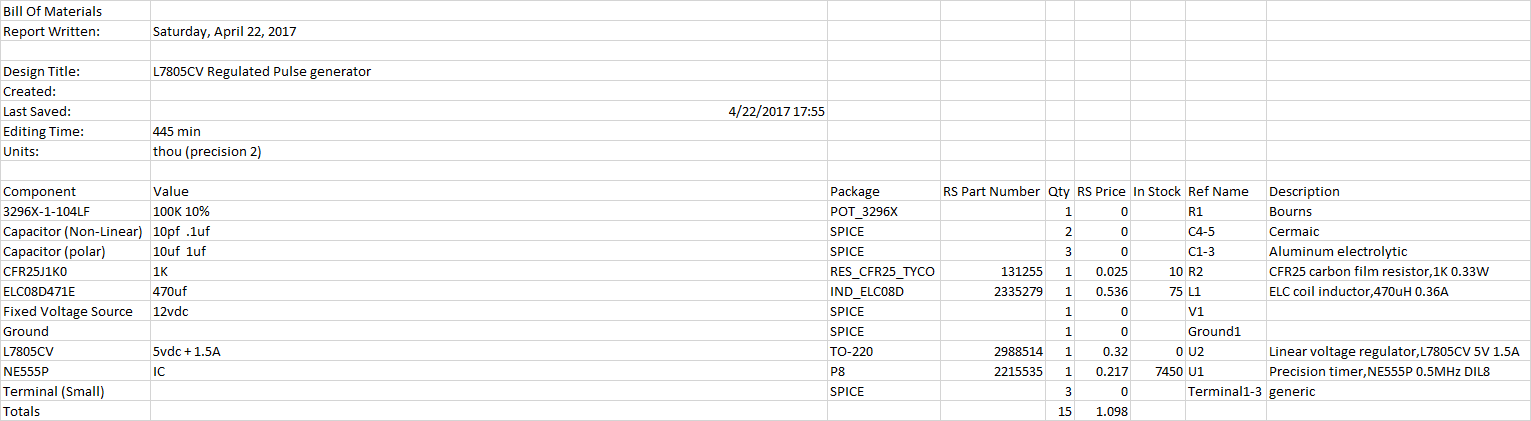
![]()
Bill of Materials (BOM)
-
C programming Script For 2 Channel Arduino Ocilloscope (virtual)
04/17/2017 at 16:43 • 0 commentsThe first part of this script is a java based version for opening up a dual trace window (albeit an 'el cheapo version,) but very useful. I use it to monitor analog pins PA0 and PA1 on my Dev board for the ATmega1284P, using my 555 pulse generator circuit (the 1 with the 100k trimmer POT to adjust integration timing,) and a 220 ohm resistor at pin 3 at output, I can now monitor pins 3 and 6 of the 555 timer chip.
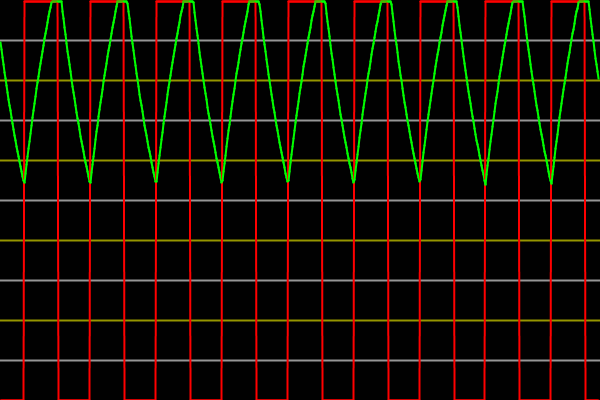
The first illustration will be the ocilloscope graphing plot and then the scripting itself:
The Red line is pin# 3-output and the Green line is pin# 6
![]()
Plot is continuous at 50ms
Next is the Java script (which you need to run first, then load the arduino script.)
/*
* Oscilloscope
* Gives a visual rendering of three analog pins in realtime.
*
* This Software expands the channel amount of a previous version.
* The previous version was a project that is part of Accrochages
* See http://accrochages.drone.ws
*
* The author of this adapted software has no relation to Accrochages.
* He thanks them for the great template and the inspiration to write this software.
*
* The following declaration was part of the original software.
* This is for your information.
*
* (c) 2008 Sofian Audry (info@sofianaudry.com)
*
* This program is free software: you can redistribute it and/or modify
* it under the terms of the GNU General Public License as published by
* the Free Software Foundation, either version 3 of the License, or
* (at your option) any later version.
*
* This program is distributed in the hope that it will be useful,
* but WITHOUT ANY WARRANTY; without even the implied warranty of
* MERCHANTABILITY or FITNESS FOR A PARTICULAR PURPOSE. See the
* GNU General Public License for more details.
*
* You should have received a copy of the GNU General Public License
* along with this program. If not, see .
*/
import processing.serial.*;
Serial myPort; /* Create object from Serial class */
char HEADER = 'H'; /* character to identify the start of a message */
short LF = 10; /* ASCII linefeed */
short portIndex = 0; /* determines the USB port used */
int[] val = {-1, -1}; /* Variable used for getY function, 2 positions for 2 channels */
int[] valuesCh1; /* The next three variables will hold the data of the window in memory so that they can be pushed and displayed */
int[] valuesCh2;
float zoom; /* Define "zoom" as floating-point variable */
void setup()
{
//size(1014, 690); /* Opens a window of specific size, max size of my laptop screen, delay problems may occur */
size(600, 400); /* smaller screen => less to calculate => no delay problems */
myPort = new Serial(this, Serial.list()[portIndex], 115200); /* Open the port that the board is connected to and use the same speed (115200 bps) */
valuesCh1 = new int[width]; /* Define array with as many elements as x-pixel in window, used for plotting data of Channel1 */
valuesCh2 = new int[width]; /* ... of Channel2 */
zoom = 1.0f; /* Start with 1x zoom factor */
smooth(); /* Drawing images with smooth edges */
}
/* This function converts a channel data value into pixels shown from
* top of graph (which is the 0 position)
* this function returns an integer value */
int getY(int val)
{
return (int)(height - val / 1023.0f * (height - 1));
}
/* Function that reads the serial string data that were sent by arduino
* Puts out an array with the three values of the arduino
* Function is called in draw function */
int[] getData()
{
int[]ChValues = {-1, -1}; /* Define array for this function */
String message = myPort.readStringUntil(LF); /* Read in the serial data string sent by arduino */
if(message != null) /* Do this only when a complete valid message was received */
{
String [] data = message.split(","); /* Split the comma-separated message into it's segments */
if(data[0].charAt(0) == HEADER) /* Check for header character in the first field, always true for complete message */
{
for (int i = 1; i < data.length-1; i++) /* Skip the header and terminate cr and lf => look only at the three data points */
{
ChValues[i-1] = Integer.parseInt(data[i]); /* Write channel data into array, i shifted from data to array by 1 due to header */
}
}
}
return ChValues; /* Returns array ChValues which contains channel data */
}
/* This function pushes all the data points of the window one position further to the left, then it adds the data point that was just read */
void pushValue(int[] value)
{
for (int i=0; i<width-1; i++)
{
valuesCh1[i] = valuesCh1[i+1]; /* Move the data point over by on position */
valuesCh2[i] = valuesCh2[i+1];
}
valuesCh1[width-1] = value[0]; /* Add data point */
valuesCh2[width-1] = value[1];
}
/* This function draws the data into the window */
void drawLines()
{
int displayWidth = (int) (width / zoom); /* Calculates width of window, considering the x-change if a zoom is set */
int k = valuesCh1.length - displayWidth; /* This calculates position up to which the data points are shown */
int x0 = 0; /* x value at very left of window (=0) is assigned to x0 and used for all channels */
int ya0 = getY(valuesCh1[k]); /* y value of the last shown point is assigned to ya0 for channel1 */
int yb0 = getY(valuesCh2[k]); /* y value of the last shown point is assigned to yb0 for channel2 */
for (int i=1; i<displayWidth-1; i++) /* Loop that runs from point k to the very right side of window */
{
k++; /* Increment k for next data point */
int x1 = (int) (i * (width-1) / (displayWidth-1)); /* Calculate next x value */
int ya1 = getY(valuesCh1[k]); /* Get next y-value for channel1 */
int yb1 = getY(valuesCh2[k]); /* Get next y-value for channel2 */
strokeWeight(2); /* Draw thicker lines */
stroke(255, 0, 0); /* Draw a red line for channel1 */
line(x0, ya0, x1, ya1); /* Plot a line segment for channel1 */
stroke(0, 255, 0); /* Draw a green line for channel2 */
line(x0, yb0, x1, yb1); /* Plot a line segment for channel2 */
x0 = x1; /* Shift x value to calculate next line segments */
ya0 = ya1; /* Shift y-value for channel1 to calculate next line segments */
yb0 = yb1; /* Shift y-value for channel2 to calculate next line segments */
}
}
/* This function draws grid lines into the window
* I spaced the lines so they represent 10% and 20% steps in 2 different colors
* For Signals of 5V max, that is 0.5 & 1.0V steps */
void drawGrid()
{
stroke(150, 150, 0);
line(0, height/5, width, height/5);
line(0, height*2/5, width, height*2/5);
line(0, height*3/5, width, height*3/5);
line(0, height*4/5, width, height*4/5);
stroke(150, 150, 150);
line(0, height/10, width, height/10);
line(0, height*3/10, width, height*3/10);
line(0, height*5/10, width, height*5/10);
line(0, height*7/10, width, height*7/10);
line(0, height*9/10, width, height*9/10);
}
/* This function allows to zoom in the x-axis of the data
* It runs in the background and notices when the right key is pressed
* Zoom in with pressing "+"
* Zoom out with pressing "-" */
void keyReleased()
{
switch (key)
{
case '+':
zoom *= 2.0f;
println(zoom);
if ( (int) (width / zoom) <= 1 )
zoom /= 2.0f;
break;
case '-':
zoom /= 2.0f;
if (zoom < 1.0f)
zoom *= 2.0f;
break;
}
}
/* This is the main function that calls the other functions
* This function runs continuously */
void draw()
{
background(1); /* Sets the background of the window */
drawGrid(); /* Draws the grid into the window */
val = getData(); /* Reads the data from the three Channels as sent by the arduino into an array */
if (val[0] != -1) /* If data is in first channel, then carry out function */
{
pushValue(val); /* Pushes data down one position and adds one new data point */
}
drawLines(); /* Add the next data set to the window */
if (mousePressed) /*perform action when mouse button is pressed */
{
save("/2 channel ocillscope pics/OsciData1.png"); /* save screen shot of data window, but beware image will be overwritten with second mouse click */
}
}
This is the Arduino 2 channel ocilloscope script:
#include <util/delay_basic.h>
/* CommaDelimitedOutput sketch */
#define ANALOG_IN_Ch1 PA0
#define ANALOG_IN_Ch2 PA1
/*Arduino script for 2 channel ocilloscope program, I have this set up for my Dev board but you can easily configure it for your own applications */
void setup()
{
Serial.begin(115200);
}
void loop()
{
int val1 = analogRead(ANALOG_IN_Ch1); /* Reads values from analog Pin0 = Channel1 */
int val2 = analogRead (ANALOG_IN_Ch2); /* Reads values from analog Pin1 = Channel2 */
Serial.print('H'); /* Unique header to identify start of message */
Serial.print(",");
Serial.print(val1, DEC);
Serial.print(",");
Serial.print(val2, DEC);
Serial.print(","); /* Note that a comma is sent after the last field */
Serial.println(); /* send a cr/lf */
delay(20); //This may be able to be faster than 50ms
}
-
My Spectral Database Now Contains 125 UV/VIS Spectral Scans...
04/15/2017 at 15:00 • 2 commentsI have added to my files page 3 zip files for download, (1) (2) (3), which now contain 125 absorption and emission spectra from my lab experiments starting from my first spectrometer build to my present build the DAV5 V3.
This is an open source citizen science project I started, so the average hobbyist and interested scientists at home can have a place to contribute their own work for free, a way for all of us to benefit from our own research collectively.
This project is still in its infancy but hopefully will keep growing, I still have about 11,000 for files to go :)
*Spectral-Database-1.0-master (3).zip
This is the latest installment to my spectral database on github, there are now 125 absorption and emission scans. PNG pics are also included relative to the particular studies being done.
x-zip-compressed - 3.19 MB - 04/15/2017 at 14:16
*Spectral-Database-1.0-master (2).zip
4 new raw data files added, parts 1 and 2 from; Effects of Solvents on Fluorescence of Biological Dyes done on 8/26/2016
x-zip-compressed - 1.70 MB - 04/13/2017 at 15:00
*Spectral-Database-1.0-master.zip
This is the begining of my spectral database collection project over at Github
x-zip-compressed - 1.49 MB - 04/13/2017 at 08:31
http://github.com/dhaffnersr/Spectral-Database-1.0
http://scistarter.com/project/17352-Open-Source-CSV-Spectral-Database-on-Github
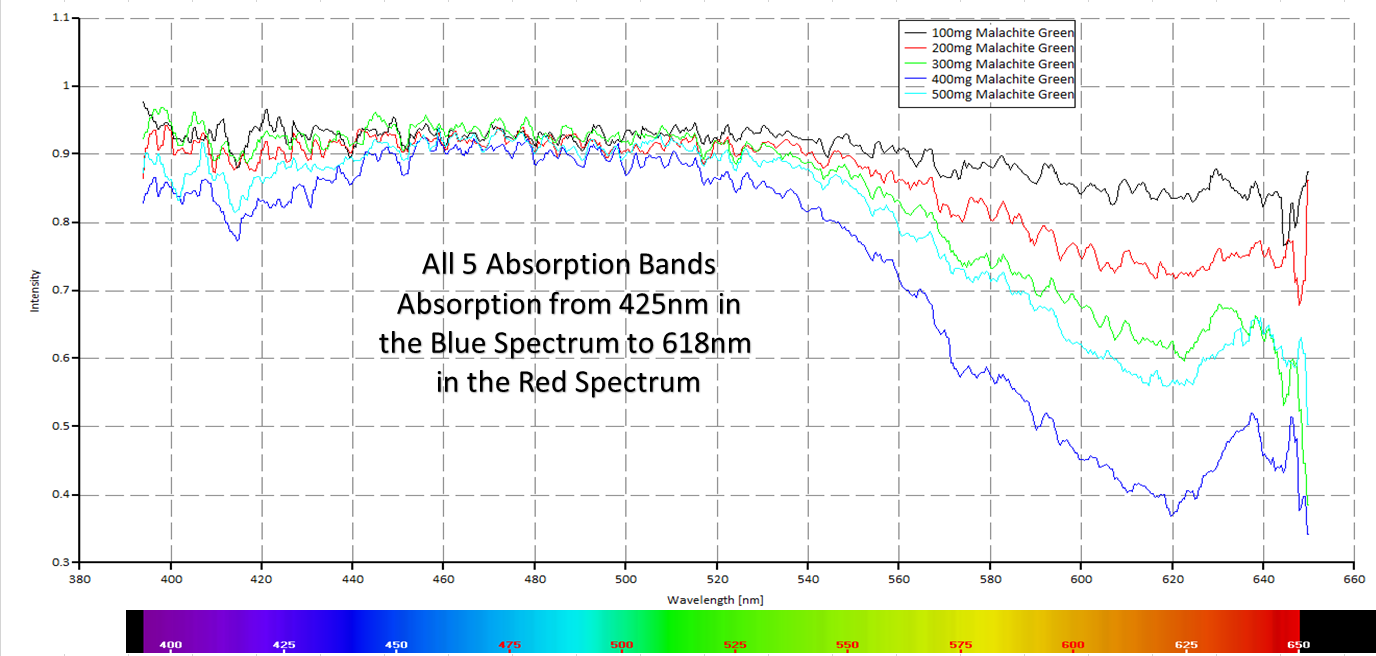
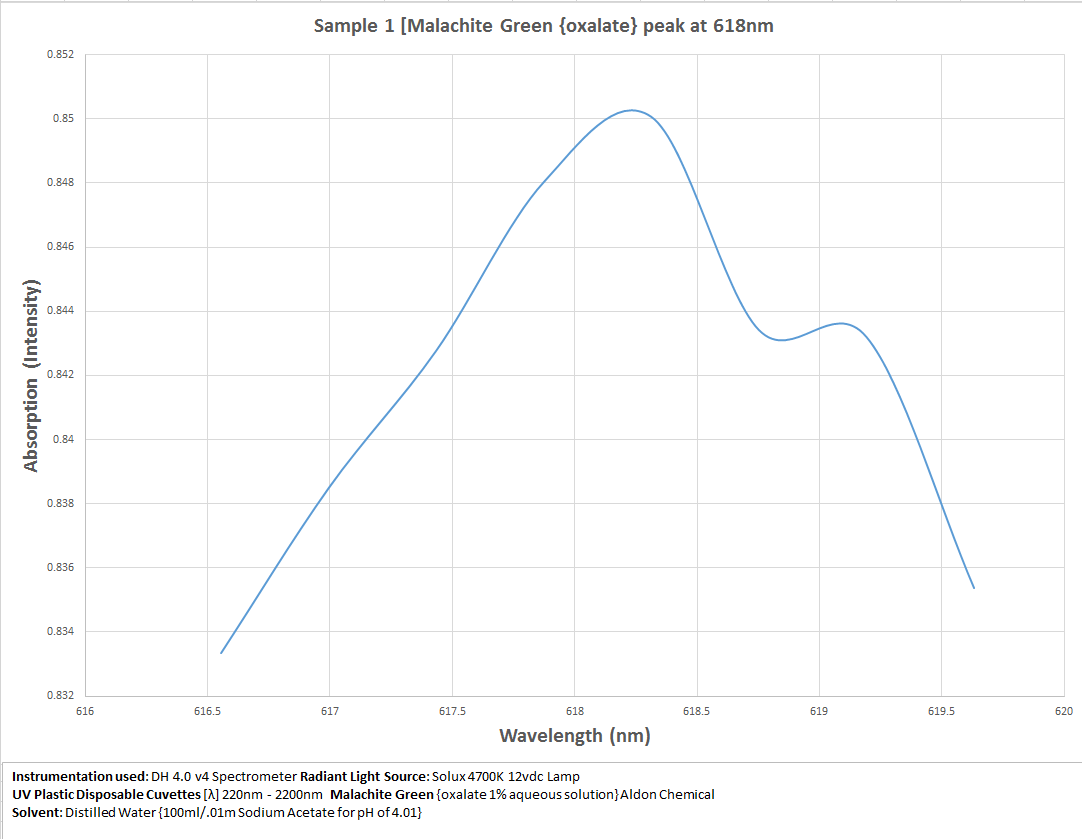
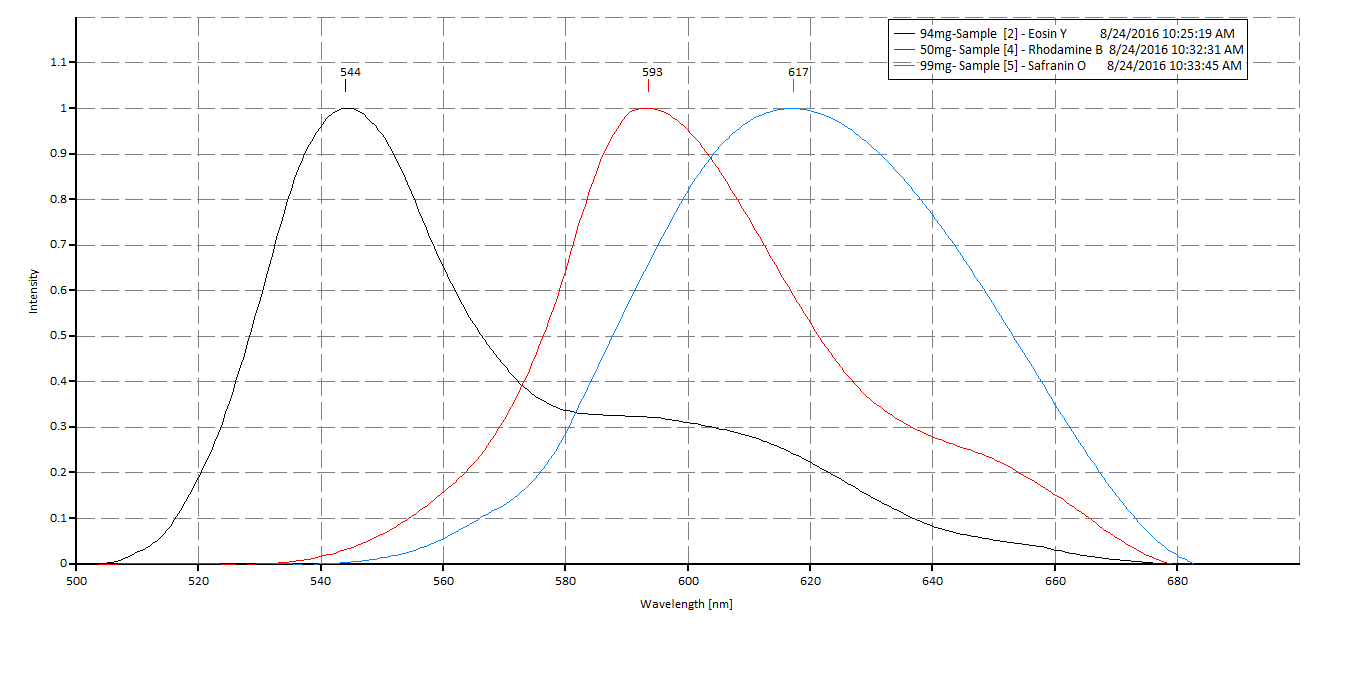
An example of some of the data plots are illustrated below:
![]()
![]()
![]()
![]()
-
*UPDATE* Creating My Own Spectral Database On Github!
04/12/2017 at 13:38 • 0 comments*Update*
I have included my Scistarter website, so anyone who wants to join this open source project can contribute their files also to the spectral database on Github:
http://scistarter.com/project/17352-Open-Source-CSV-Spectral-Database-on-Github
I have over twelve thousand lab spectral files (processed and raw data,) in csv format from all my spectrometer builds, starting from the first one I built to the present V3 version. I am always disappointed when trying to search the web for spectral data, either they feel that the data is top secret or they want an unreasonable payment for the knowledge.
I'm pretty fed up with it so, I've decided to hunker down and catagorize my work and post it for "free" on Github. I've just started so please be patient, this will take some time but I will get their, my first upload is a little sample of the catagories; light sources (CFL, Halogen, laser,LED and IR) next is dyes, which are my specialty (used for microbiological staining,) eosin y, Rhodamine B, I will be including carbol fuschin, safranin o, malachite green, methylene blue and fluorescein also at a later date.
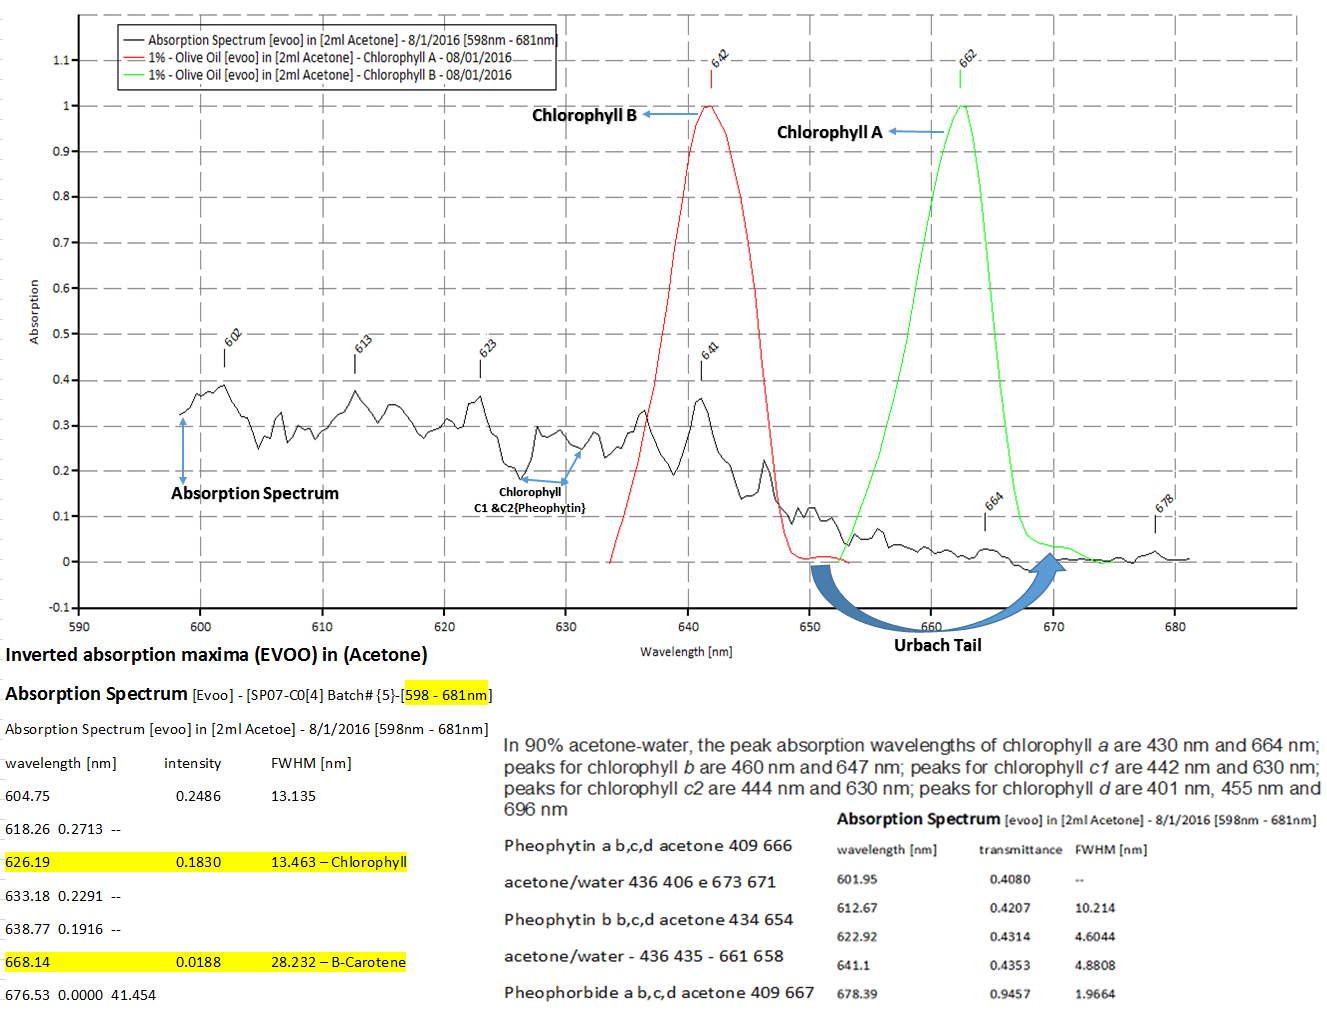
I also included some of my studies in EVOO (extra virgin olive oil,) and will be including a study I did on Wyoming sweet crude oil.
The data sets will always include the raw data sets plus the processed data with a labeling legend attached for easy identification on plot legends. This way there is a clear trail of scientific evidence that we all should be using when doing good scientific research.
I hope this project will be helpful now and in the future, its a lot of work on my part but I don't mind doing it because I feel someone has too and it's going to be me :)
Here is the link to my Github repository; http://github.com/dhaffnersr/-Lab-Files
-
CCD Driver Circuit Board Finished! (TCD1304DG)
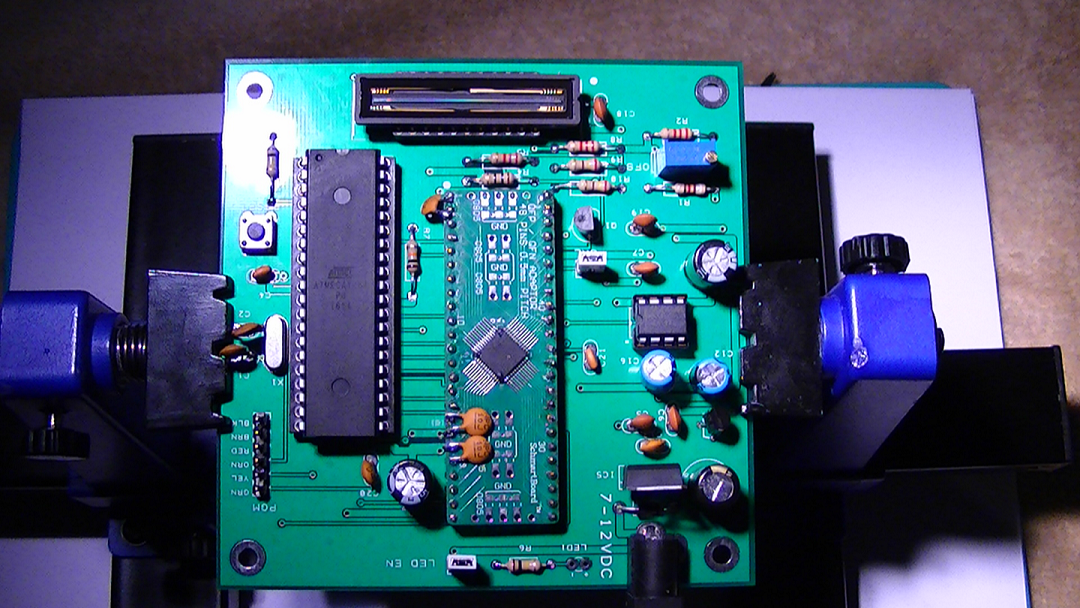
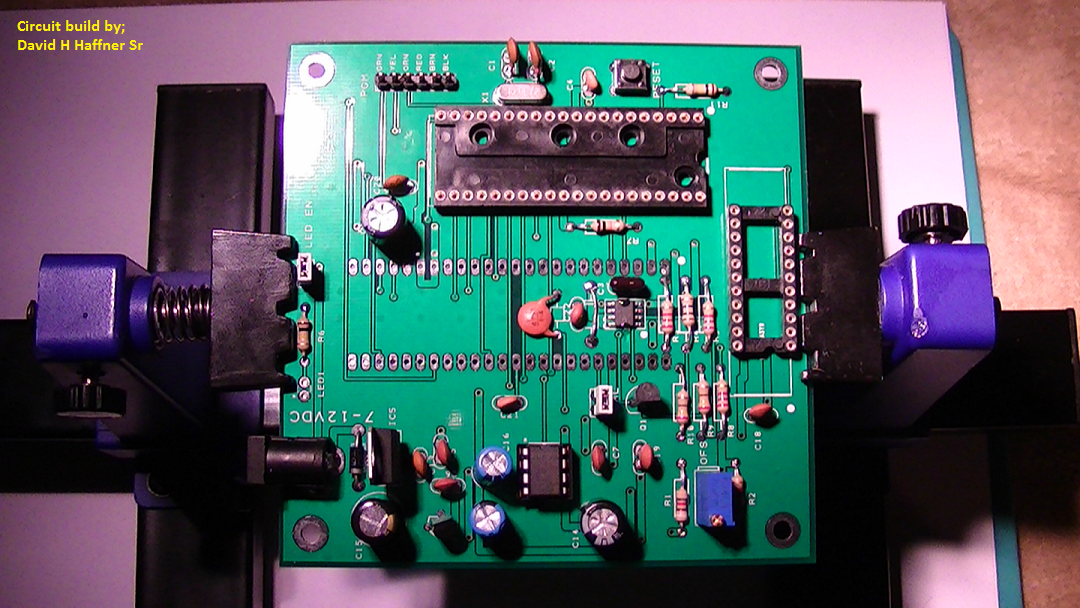
04/07/2017 at 17:44 • 0 commentsWell, I gotter' done, next will be testing after I burn the bootloader on this, and a few other tweaks;
![]()
The picture above is before placing the ADC (AD7667,) you can see the placement of the AD8021 op amp underneath the AD7667.
![]()
Finished product, the ADC (AD7667) placed on top of the AD8021 op amp, the TCD1304DG above and the ATmega1284 MCU to the left. (the MAX660 you can see off to the right.) I am powering this with a 12vdc 1A wall plugin pwr supply.
DAV5 V3.01 Raman Spectrometer
The only thing worth doing, is the thing worth doing right!

 In process of enclosure re-design to accomodate the TCD1304DG detector ( the board dimensions are 100mm x 100mm) no way around it, both analog and digital circuitry are located on same board. I could not extend the PGM (serial port) because the TCD1304 does not behave properly and can be damaged by extending wires beyond 4".