David H Haffner Sr
-
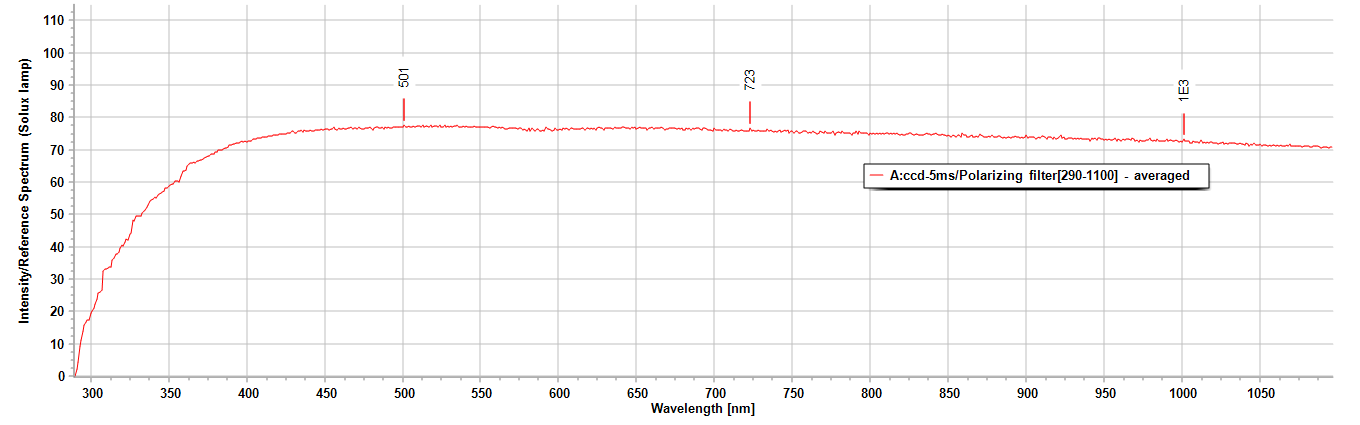
*Update* V3.02 Raman Spectrometer Solux Lamp spectrum Scan
11/30/2017 at 15:06 • 0 commentsThis is a critical alignment test before I install the new 1st collimation mirror and 1200ln/mm diffraction grating, I wanted to make sure that my mirror and diffraction grating placement are in their proper aligned positions.
The results are very good, so now I can be assured that the CCD's angle will be correct as it relates to the 2nd mirror and I will get the full spectrum on the CCD.
![]()
These are the main 3 points of reference for this particular broadband spectrum (Solux lamp 4700K, 50W, 12vdc.) The Original spectrum from the Solux factory has the points of reference at 529, 701 and 1013nm.
MIne is a little off right now because of my 1st mirror ( a special silver coated reflective flat mirror [99% reflectivity]
not bad, but not good enough. The 1st mirror will be like the 2nd mirror, 1'' convex focusing mirror with a focal length of 100mm, and a working distance of; 3.54''.
-
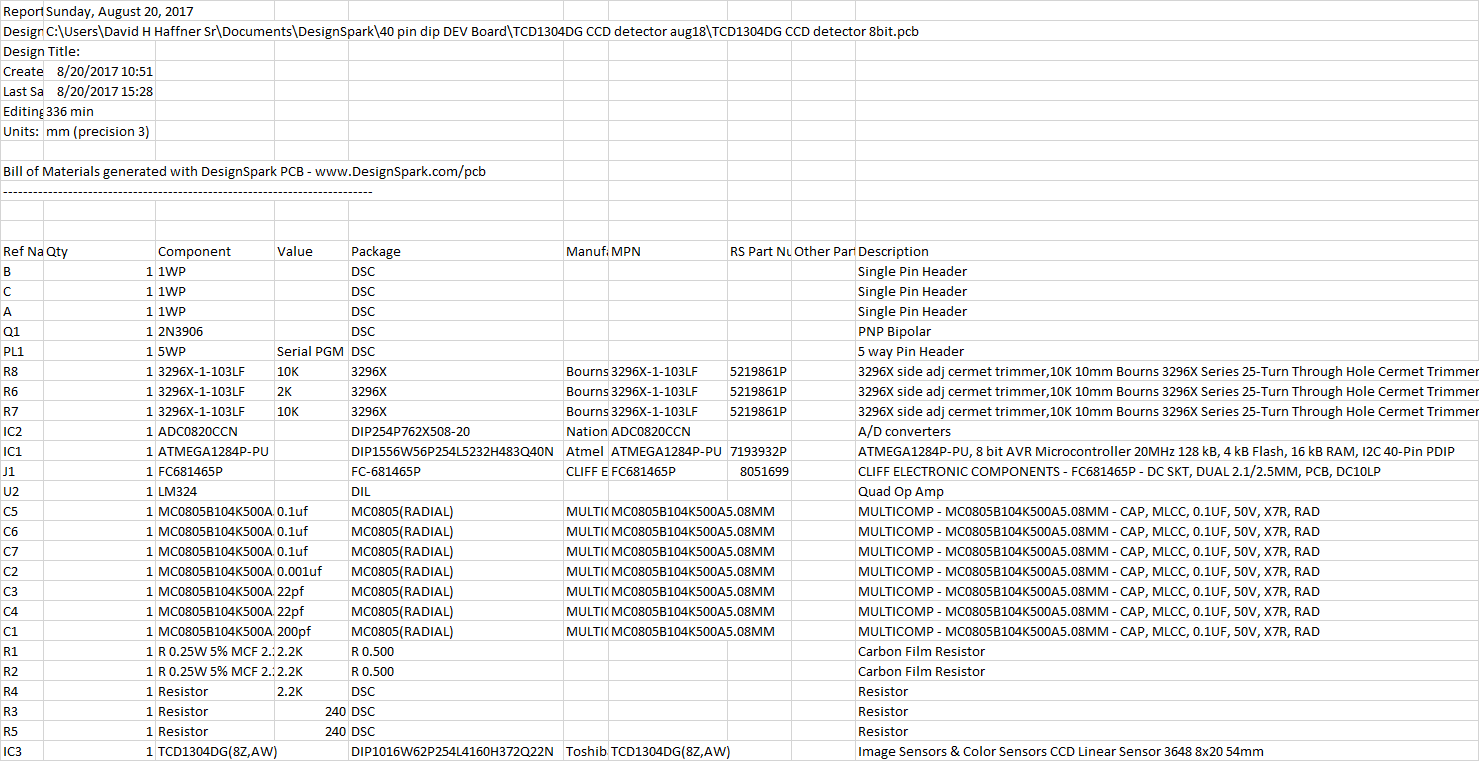
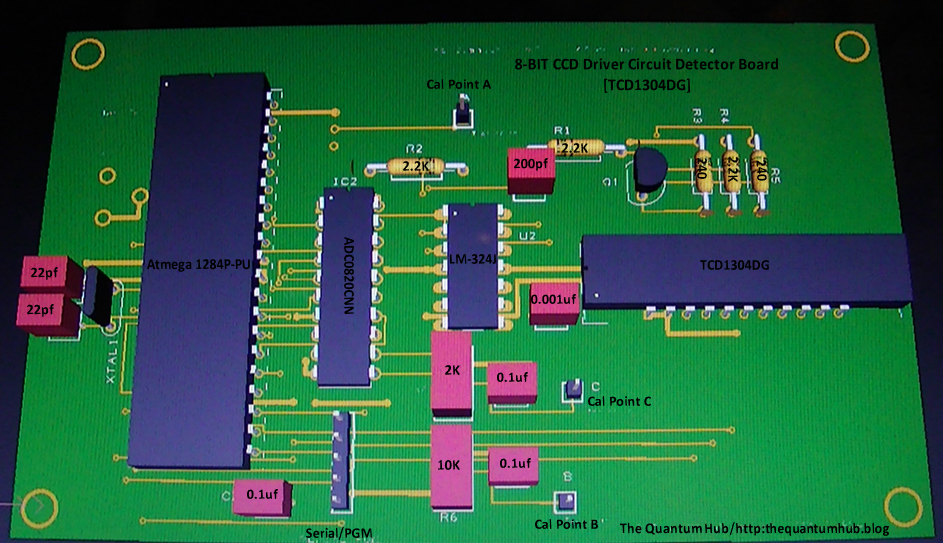
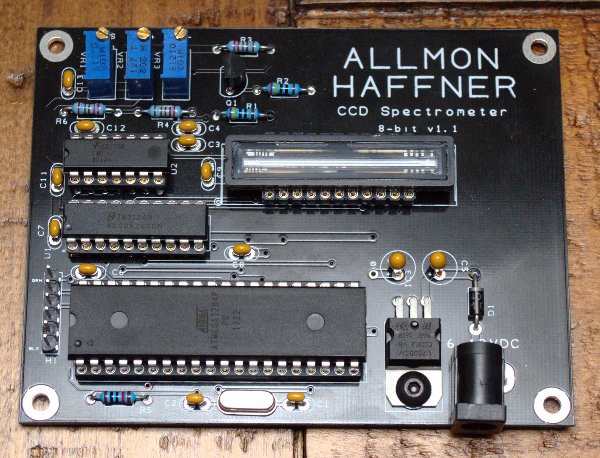
CCD Detector 8-Bit TCD1304 Finished
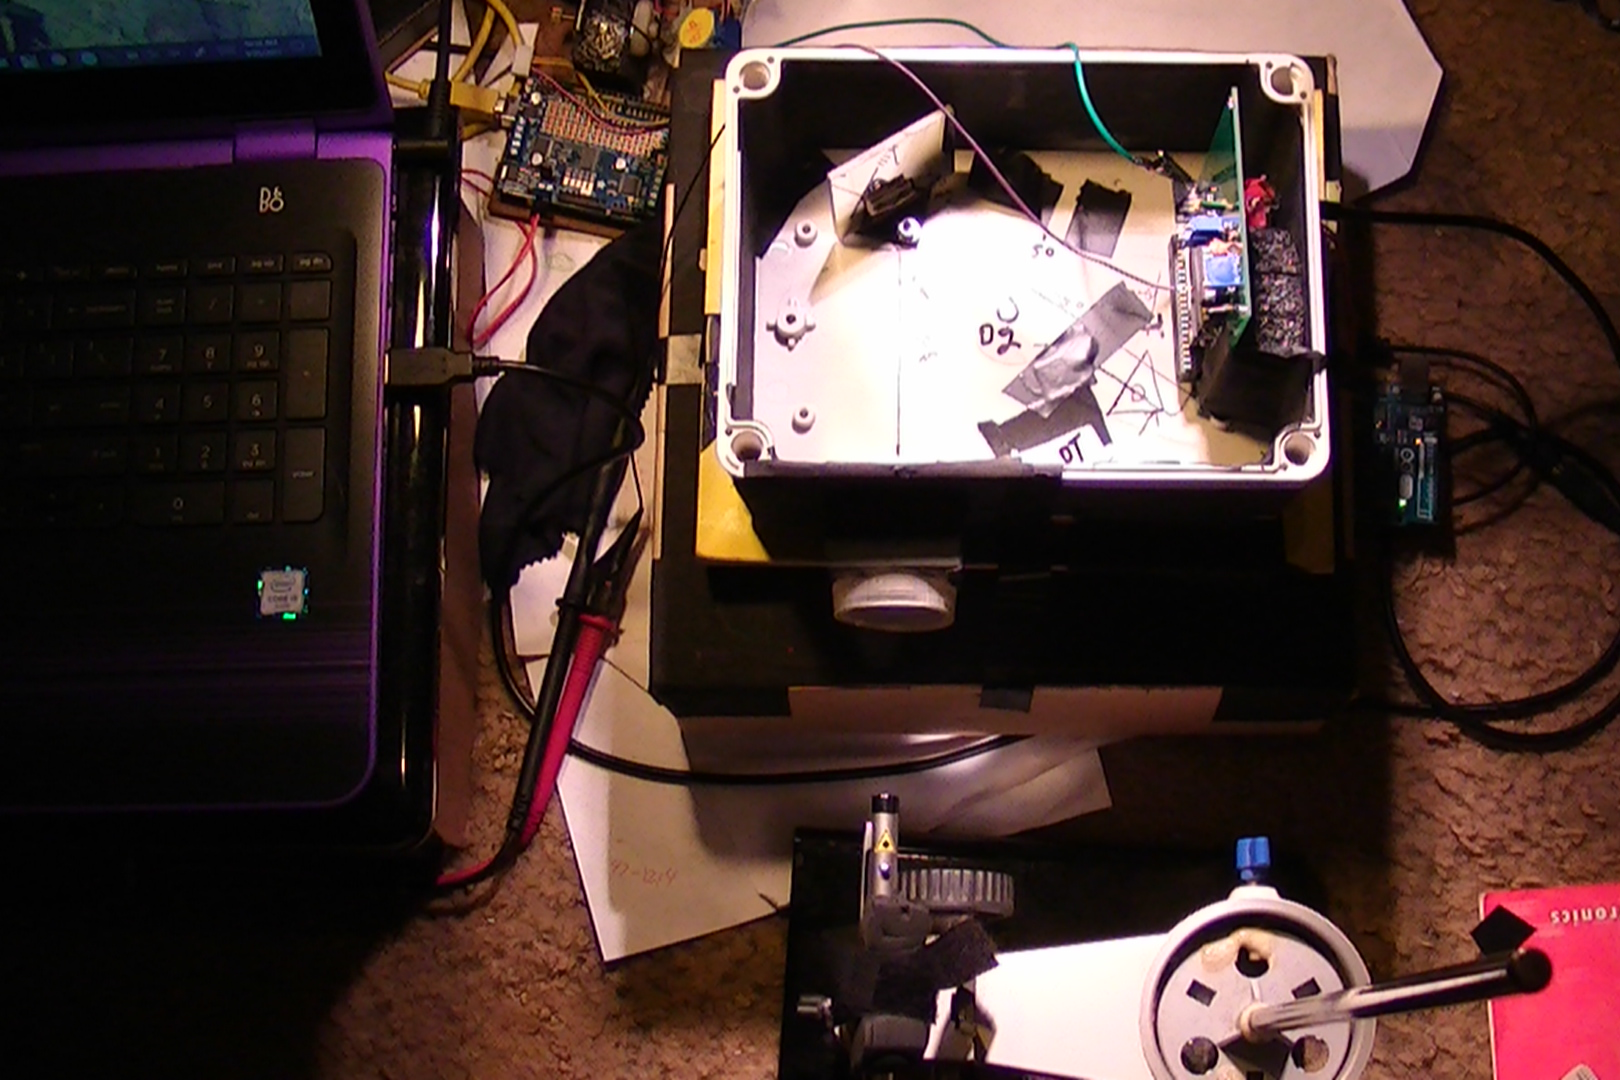
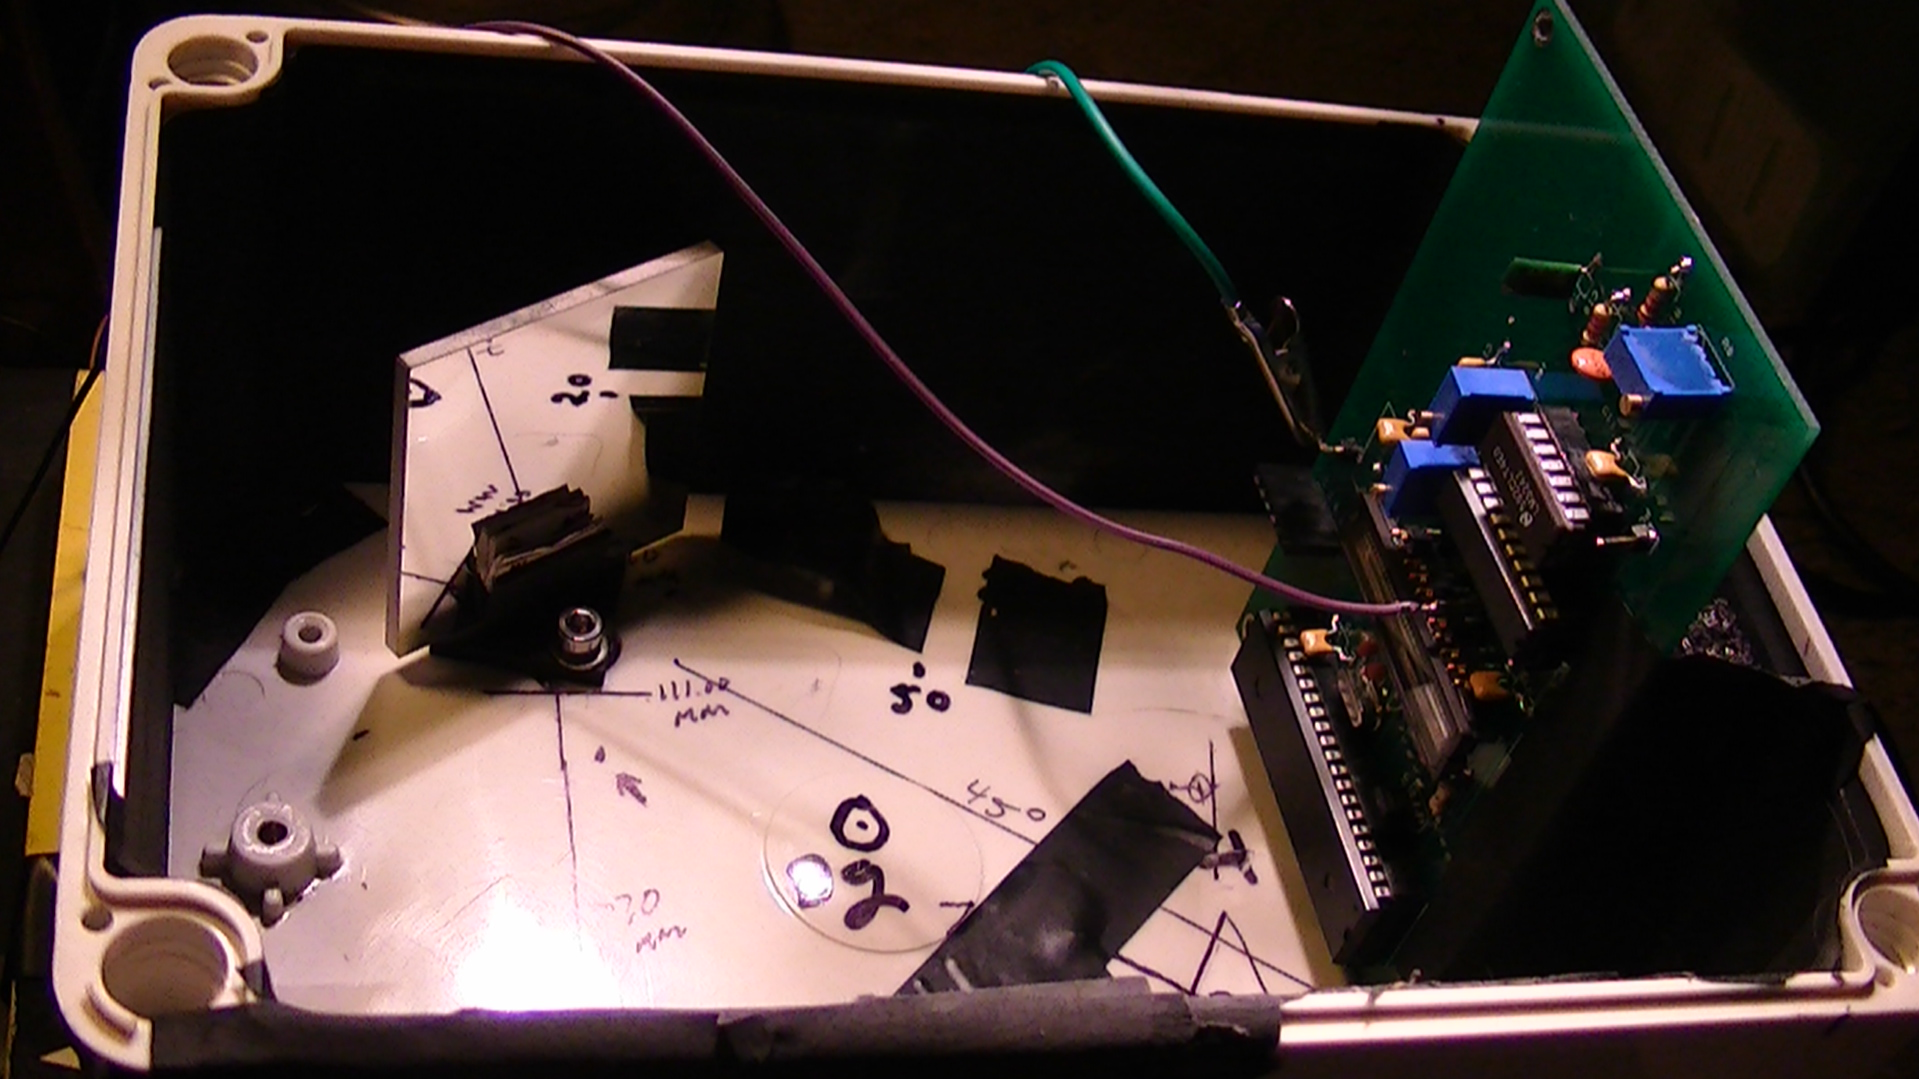
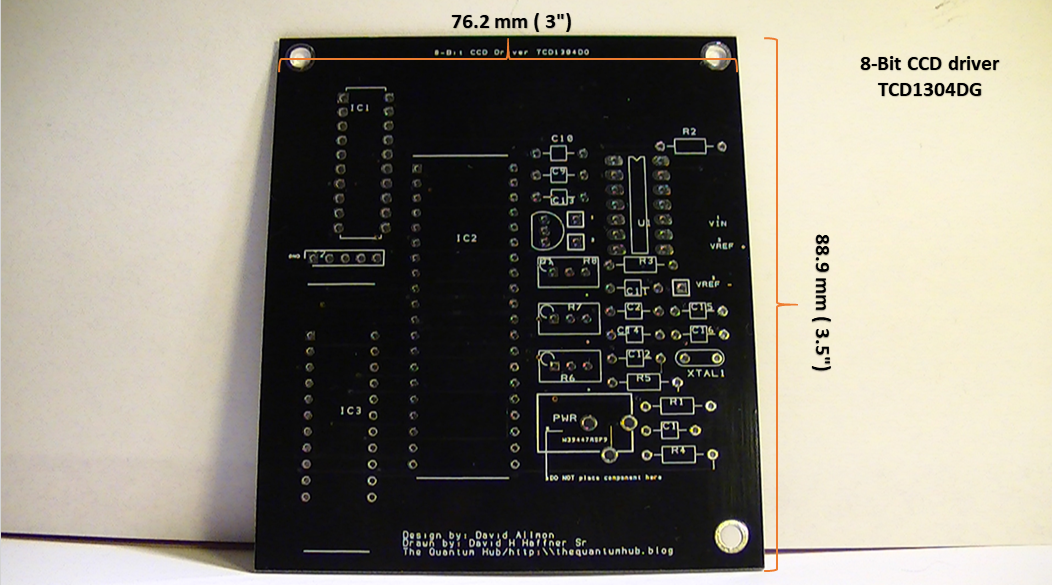
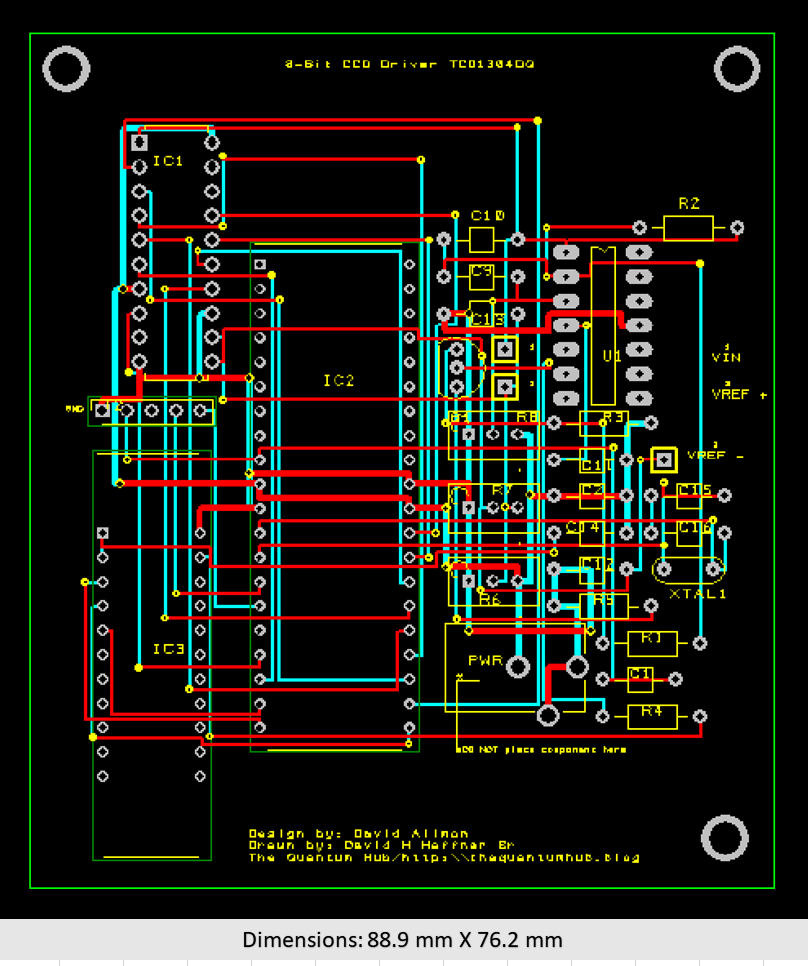
11/09/2017 at 19:24 • 0 commentsThe TCD1304DG CCD detector for the DAV5 3D printable Raman spectrometer is finished, this CCD was a collaborative effort between myself and Dave Allmon. His design, my work and experimentation and finally his debugging and final PCB product have made this beautiful detector possible :)
All details and specs can be found here: Fast 8-Bit CCD detector TCD1304
![]()
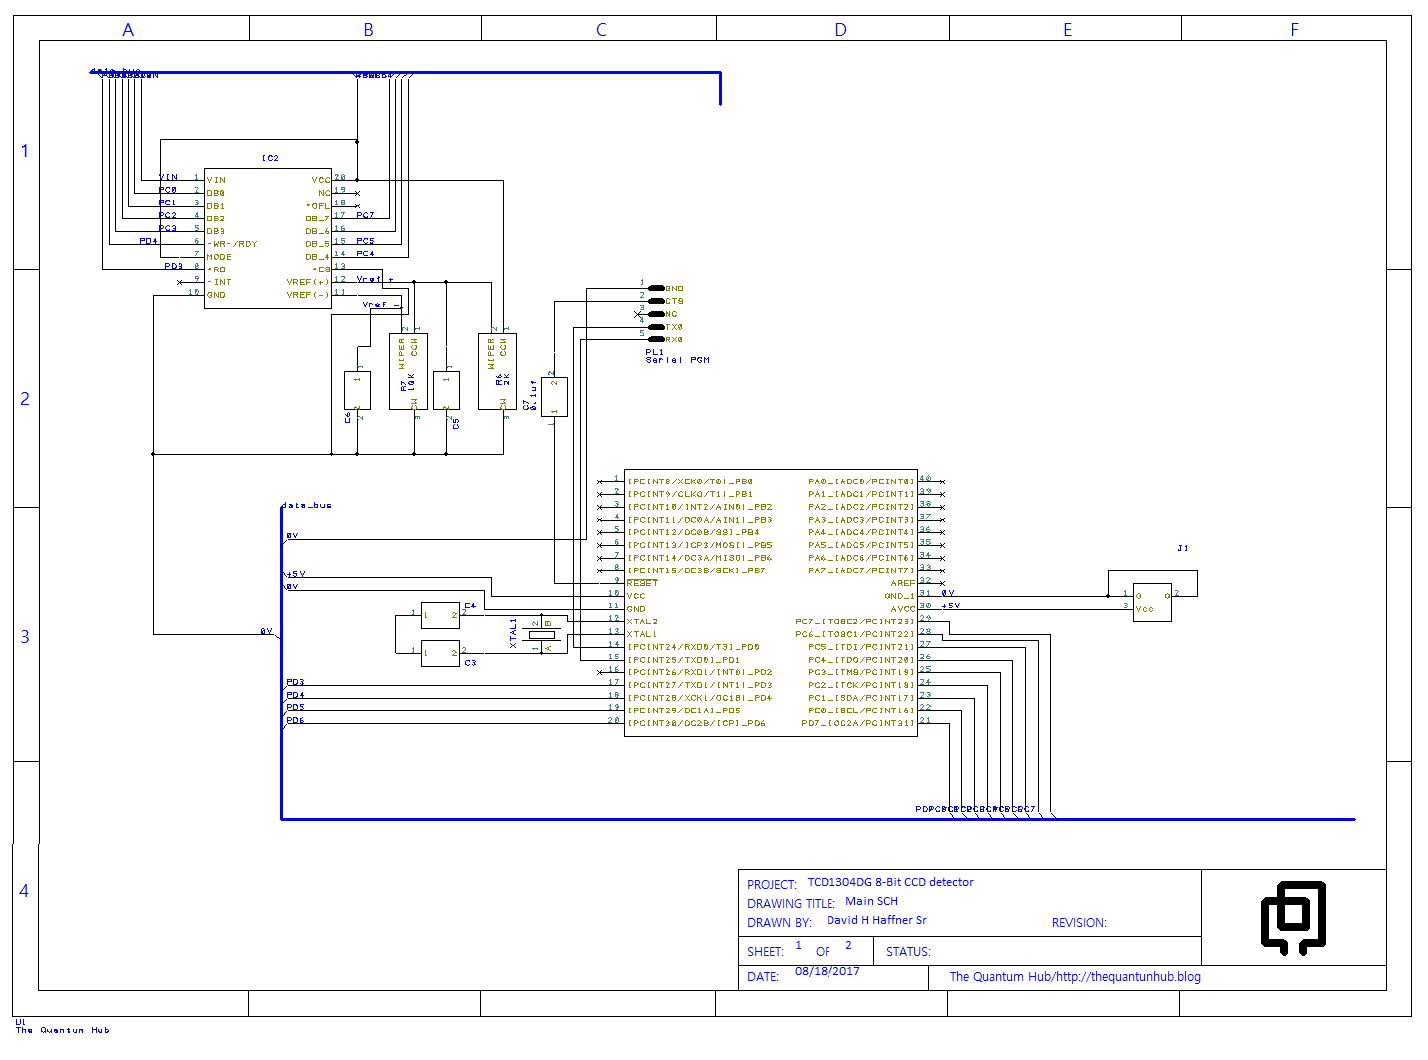
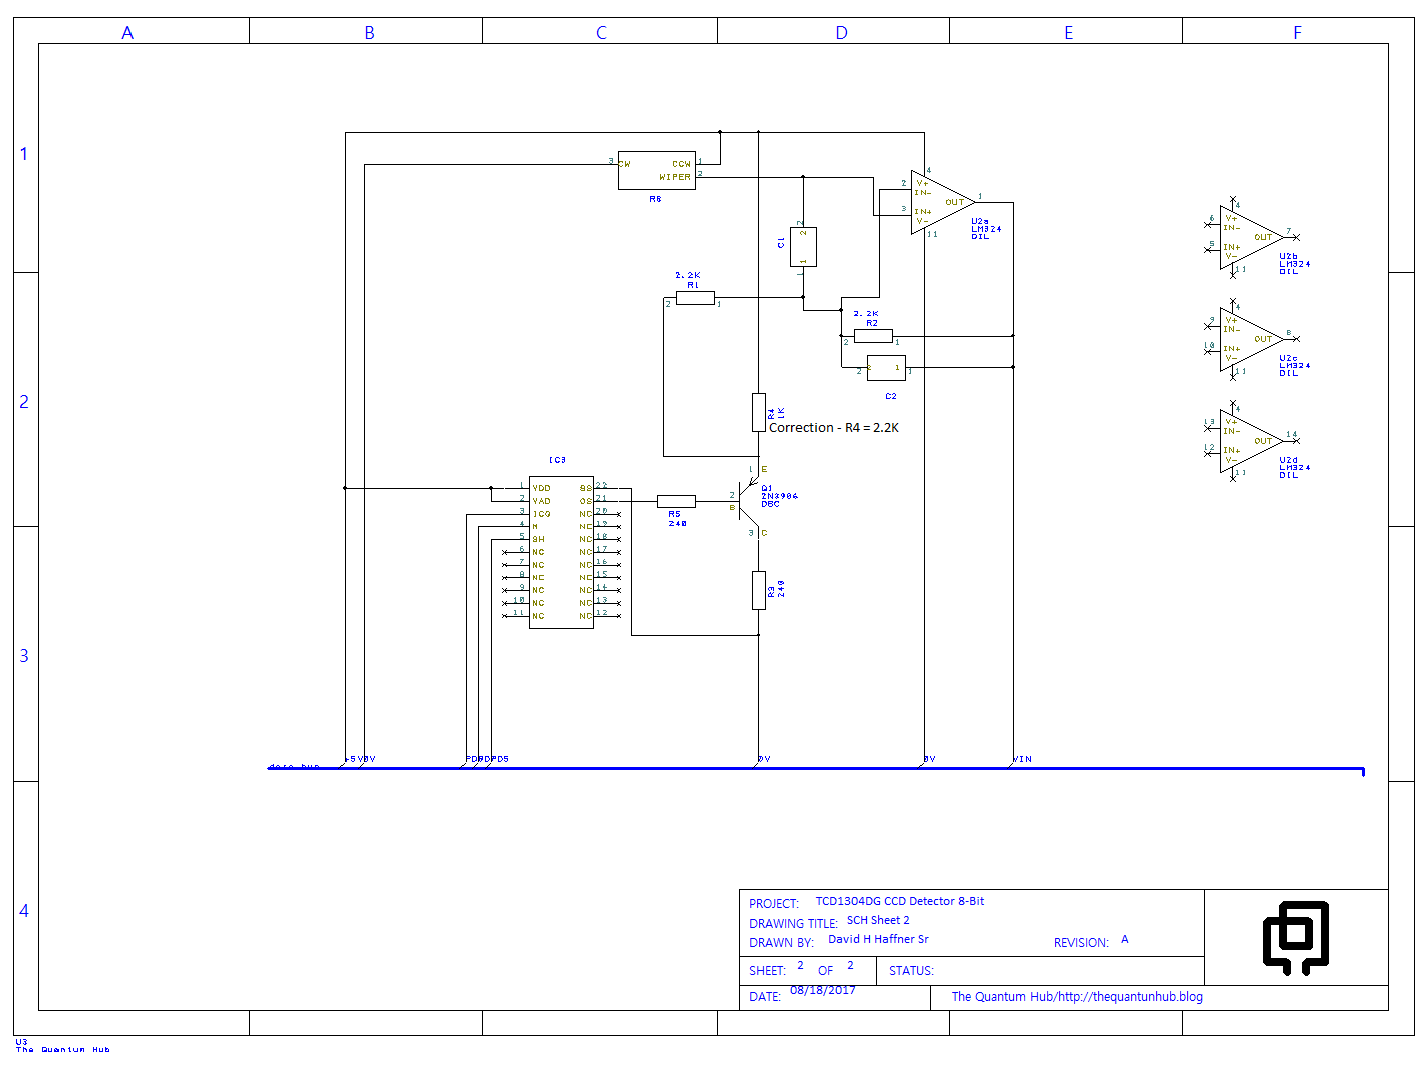
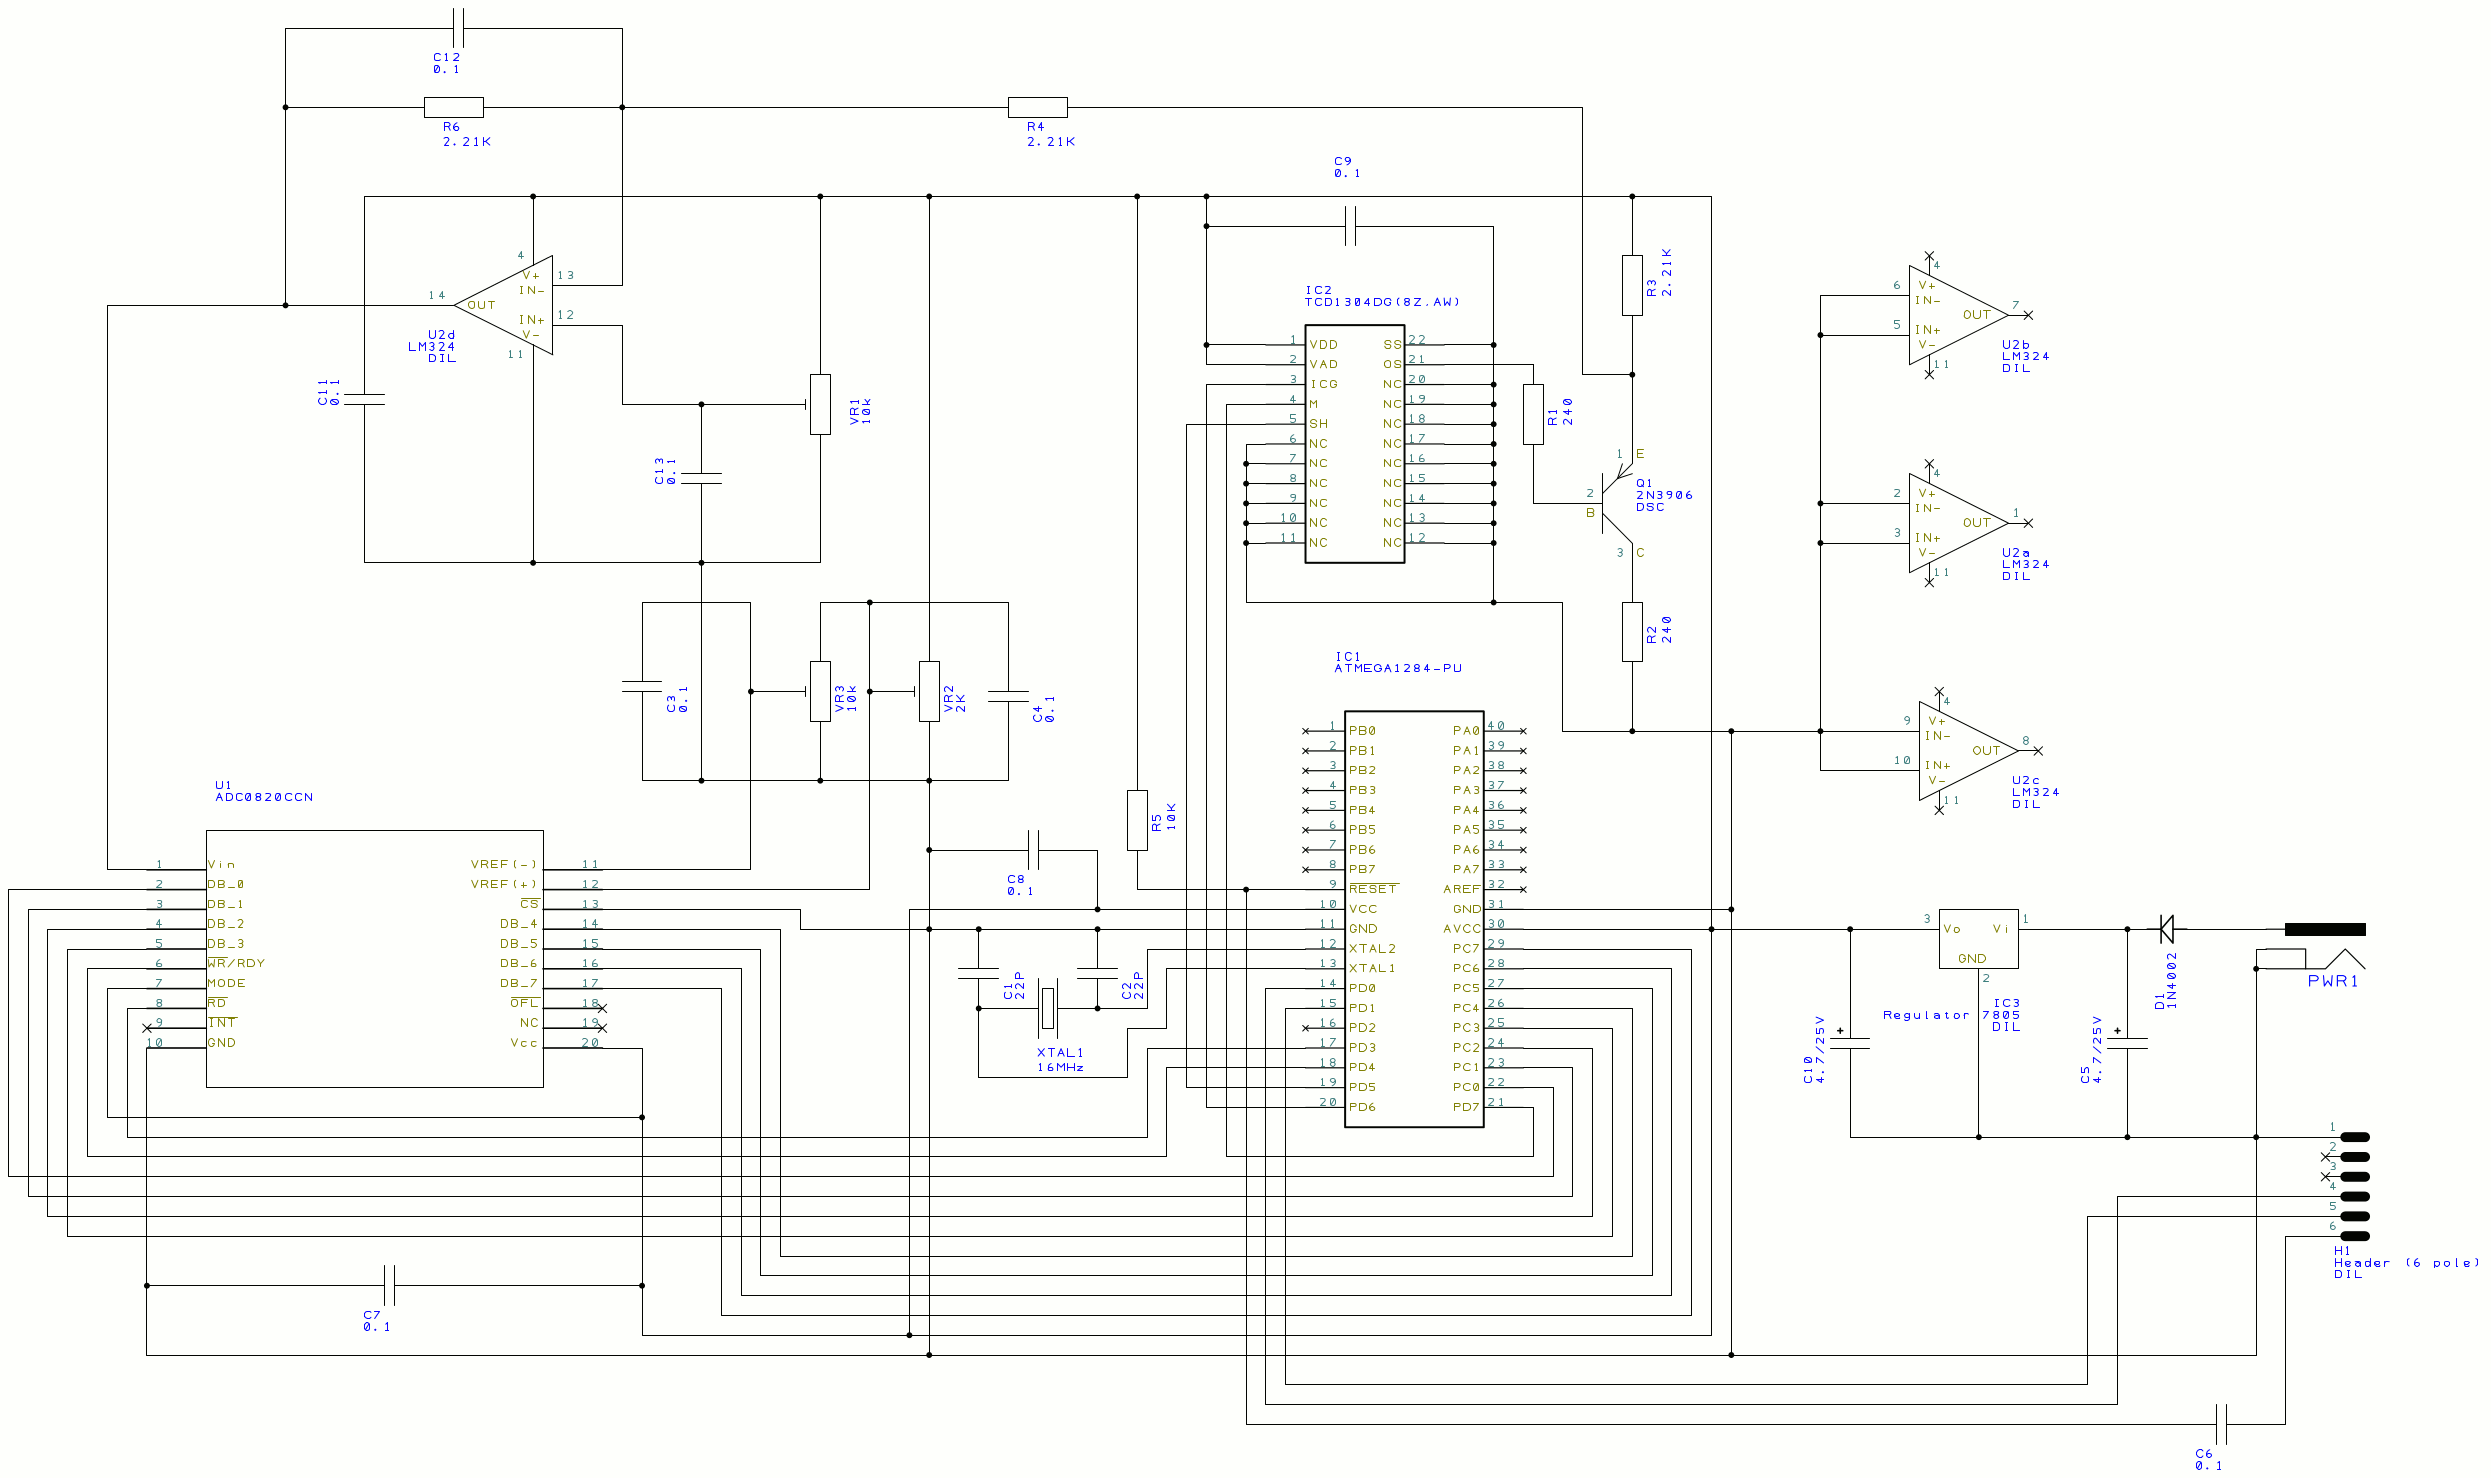
CCD detector MAIN SCH
![]()
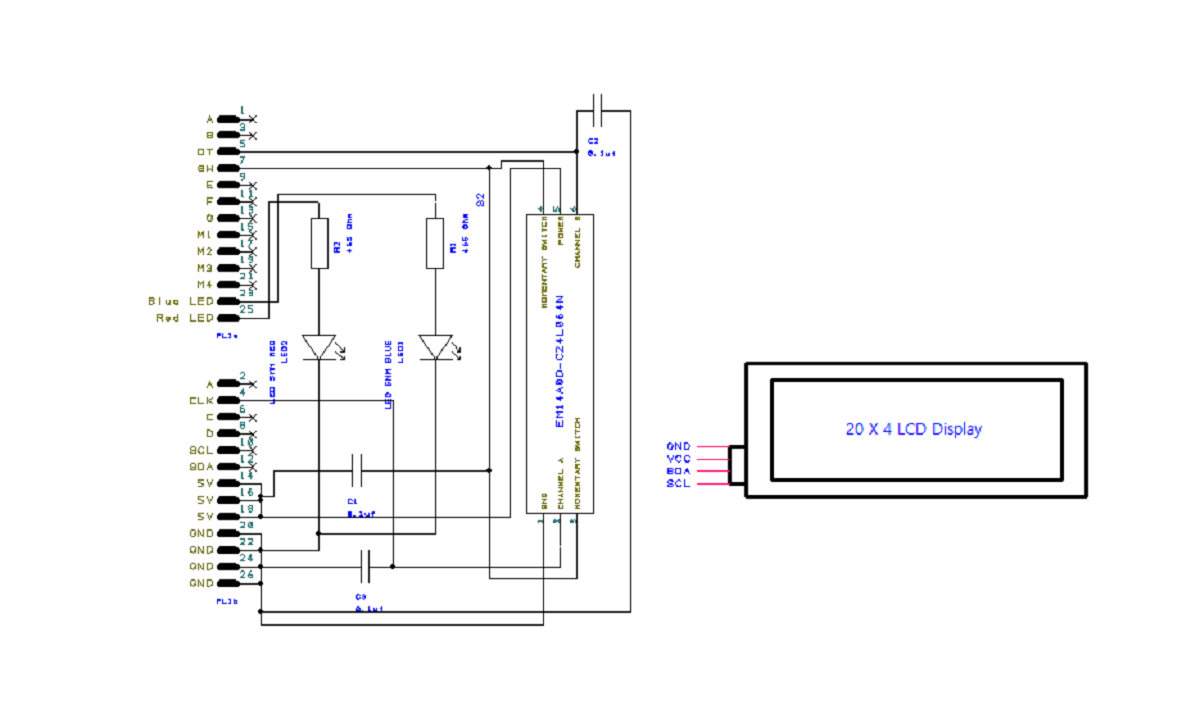
Motor Control Interface
![]()
-
Motor Control Targeting Interface Mega 2560 V3.02
11/06/2017 at 14:57 • 0 comments*UPDATED Turret Control Program:
/*When you turn the rotary encoder clockwise, the angular displacement is increased;
when you turn it counterclockwise, the displacement is decreased. If you press the switch on the rotary encoder, the readings will return to zero Original code can be found here://Email: support@sunfounder.com //Website: www.sunfounder.com //2015.5.7/
**Although this is in the Public Domain, I have created a "Creative Commons License" for this work, the reason is, I made enough mod's and put in many hours of work to make this program accurate and efficient as part of a much larger project @ Hackaday.com, the DAV5 3D Printable Raman Spectrometer.
There are individuals there that have engaged in "intellectual theft" and not bothered to give credit where credit was certainly due, so I believe I have no choice but to go this route since I have put in 2 years of very hard work on this.**
The creative commons license can be viewed here: http://thequantumhub.blog/
I have modified this code to accomodate my diffraction grating turret for the DAV5 Raman 3D printable Spectrometer (http://hackaday.io/project/18126-dav5-v301-raman-spectrometer)
Written and modified by David H Haffner SR 10/18/2017
Full project details can be found here @ https://hackaday.io/project/18126-dav5-v301-raman-spectrometer
This program is also in the public domain @ https://playground.arduino.cc/Main/KY-040EncodeUsedToControlAHolographicDiffractionGratingForARamanSpectrometer
It utilizes a KY-040 encoder to control the holographic diffraction grating at steps of 1 & -1, each pin (SW,DT and CLK) has a 0.1uf ceramic cap for decoupling, this is more effective for rise time spike removal. There are 2 LED indicators, a red for encoder step movements and a yellow for home position indication that will light when the shaft docks back to a pre-determined home position,(I'm still working on it,)This is accomplished by adjusting both "StepsToTake and RotoryPosition," they are in direct relation to steps per revolution of the internal shaft according to the type of stepper motor you are using (mine is a 28-YBJ-48).Fine tuning can be done by playing between STEPS (per revolution of shaft) and Speed, this will ensure smoother transitions when turning the encoder for fewer misses. If you press the switch on the rotary encoder, the readings will return to approx zero 0.21 percent error. a 0.1uf ceramic Cap is placed @ PinSW (4) to + (the reason for the pin pullup).
The formula in this sketch is derived from the specifications of the 28-YBJ-48 stepper MTR which has a step angle of 5.62deg, to convert degrees into nanometers you 1st have to convert degrees into radians {RAD}, we do this for the 1st specification which is 5.625deg = 0.09817474 {RAD} this # is then divided by the equitorial radius of the Earth which is 3,963.2 miles.Our new value would then be, 0.000024772 miles (NM), convert this into centimeters, (3.986667)
Now with this #, we multiply it by the constant of 1 (NM) = 1609344e+012 miles *(Variable)/ 7 gives us our converting factor from encoder position count to nanometer counts.
Sketch uses 9202 bytes (3%) of program storage space. Maximum is 253952 bytes. Global variables use 519 bytes (6%) of dynamic memory, leaving 7673 bytes for local variables. Maximum is 8192 bytes.
- /
- include <digitalWriteFast.h>
- include <math.h>
- include <Wire.h>
- include <LiquidCrystal_I2C.h>
- include "Stepper.h"
- define STEPS 64 // Number of steps for one revolution of Internal shaft
// 2048 steps for one revolution of External shaft LiquidCrystal_I2C lcd(0x3F, 2, 1, 0, 4, 5, 6, 7, 3, POSITIVE); // Set the LCD I2C address
double double_x = 3.986667 * 1.609344e+012 * 0 / 7;
volatile boolean TurnDetected; // need volatile for Interrupts volatile boolean rotationdirection; // CW or CCW rotation
- define PinNum 2 // Generating interrupts using CLK signal
- define PinNum 3 // Reading DT signal
- define PinNum 4 // Reading Push Button switch
int RotaryPosition = 0; // To store Stepper Motor Position
int PrevPosition; // Previous Rotary position Value to check accuracy int StepsToTake; // How much to move Stepper
// Setup of proper sequencing for Motor Driver Pins // In1, In2, In3, In4 in the sequence 1-3-2-4 Stepper small_stepper(STEPS, 8, 10, 9, 11);
// Interrupt routine runs if CLK goes from HIGH to LOW void isr () {
static unsigned long lastInterruptTime = 0;
unsigned long interruptTime = millis();
//If interrupts come faster than 5ms, assume it's a bounce and ignore if (interruptTime - lastInterruptTime > 5) { if (!digitalReadFast(3)) rotationdirection = digitalReadFast(2); else rotationdirection = !digitalReadFast(2); } lastInterruptTime = interruptTime; // ISR digitalWriteFast(12, HIGH); // Tracks the detents of the encoder delay(1); digitalWriteFast(12, LOW); delay(1); TurnDetected = true;}
void setup () {
lcd.begin(20, 4); // initialize the lcd for 20 chars 4 lines, turn on backlight // ------- Quick 3 blinks of backlight ------------- for (int i = 0; i < 3; i++) { lcd.backlight(); delay(250); lcd.noBacklight(); delay(250); } lcd.backlight(); // finish with backlight on // set up the LCD's number of columns and rows: lcd.begin(20, 4); // Print a message to the LCD. lcd.print("SYSTEM RDY"); lcd.setCursor(10, 0); lcd.print(" Mega 2560");// system ready wired to Pin#13 built-in LED (blinks twice to indicate "system ready.") lcd.setCursor(0, 1); lcd.print("POS:");//CCW or CC lcd.setCursor(0, 2); lcd.print("Nanomtrs");// Float Position corrected lcd.setCursor(0, 3); lcd.print("Correctd"); Serial.begin(115200); delay(1000);pinModeFast(12, OUTPUT);// tracks the detent pins of the KY_040 encoder/turns off when button is pressed pinModeFast(2, INPUT); pinModeFast(3, INPUT); pinModeFast(4, INPUT_PULLUP);// pullup resistor needed for switch stability digitalWriteFast(4, HIGH); // Pull-Up resistor for switch attachInterrupt (0, isr, FALLING); // interrupt 0 always connected to pin 2 on Arduino UNO
}
void loop () {
small_stepper.setSpeed(10); //Max seems to be 700 if (!(digitalReadFast(4))) { // check if button is pressed if (RotaryPosition == 0) { // check if button was already pressed } else { small_stepper.step(RotaryPosition * 0); RotaryPosition = 0; // Reset position to ZERO ("home" position) lcd.setCursor(9, 3); lcd.print(fabs ( 3.986667 * 1.609344 * (PrevPosition) / 7) ); // absolute value of a float } bool reading = digitalReadFast(4);if (reading == ERROR_SEQUENCE) { //ERROR_SEQUENCE defined as 0b10101010 // pinNum is not a const and will always return as HIGH } } // Runs if rotation was detected if (TurnDetected) { PrevPosition = RotaryPosition; // Save previous position in variable if (rotationdirection) { RotaryPosition = RotaryPosition - 1; lcd.setCursor(8, 1); lcd.print(RotaryPosition); } // decrase Position by 1 else { RotaryPosition = RotaryPosition + 1; lcd.setCursor(13, 1); lcd.print(RotaryPosition);} // increase Position by 1TurnDetected = false; // do NOT repeat IF loop until new rotation detected// Which direction to move Stepper motor if ((PrevPosition + 1) == RotaryPosition) { // Move motor CW StepsToTake = 1; small_stepper.step(StepsToTake); lcd.setCursor(15, 2); lcd.print(fabs(+(PrevPosition) * 0.965)); // absolute value of a float, steps in + direction delay(1); }if ((RotaryPosition + 1) == PrevPosition) { // Move motor CCW StepsToTake = -1; small_stepper.step(StepsToTake); lcd.setCursor(9, 2); lcd.print(fabs(-(PrevPosition) * 0.965)); // absolute value of a float, steps in - direction delay(1); } }}
-
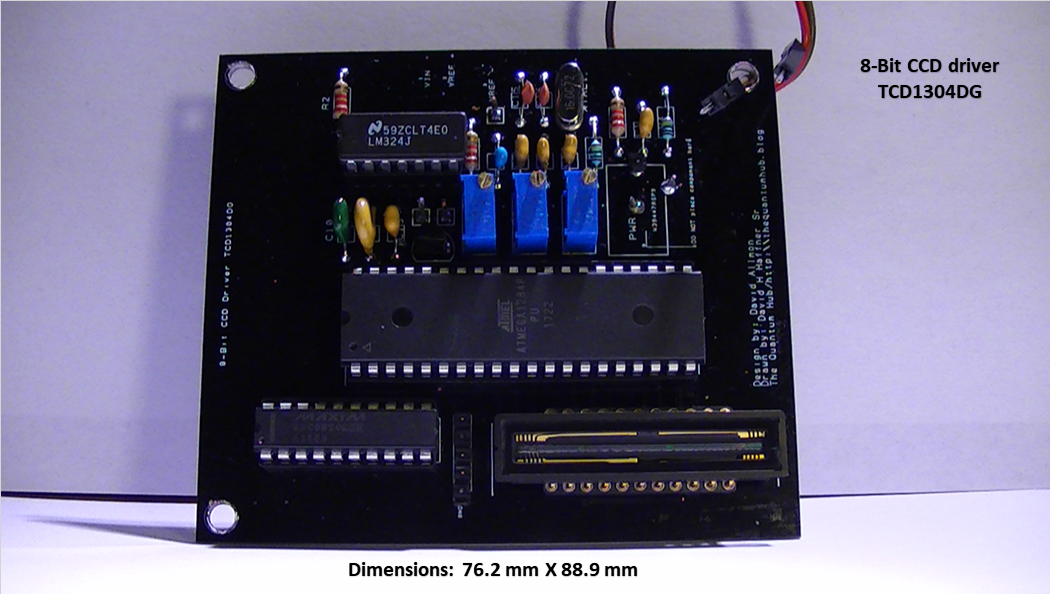
Final CCD Circuit Board TCD1304DG Verified Working...Ready for final steps
10/13/2017 at 14:13 • 0 comments![]()
Final board design (needs 1 minor track change from C9 & C13 on PCB, could have been my fault upon manual component placement.) All in all, this baby works :)
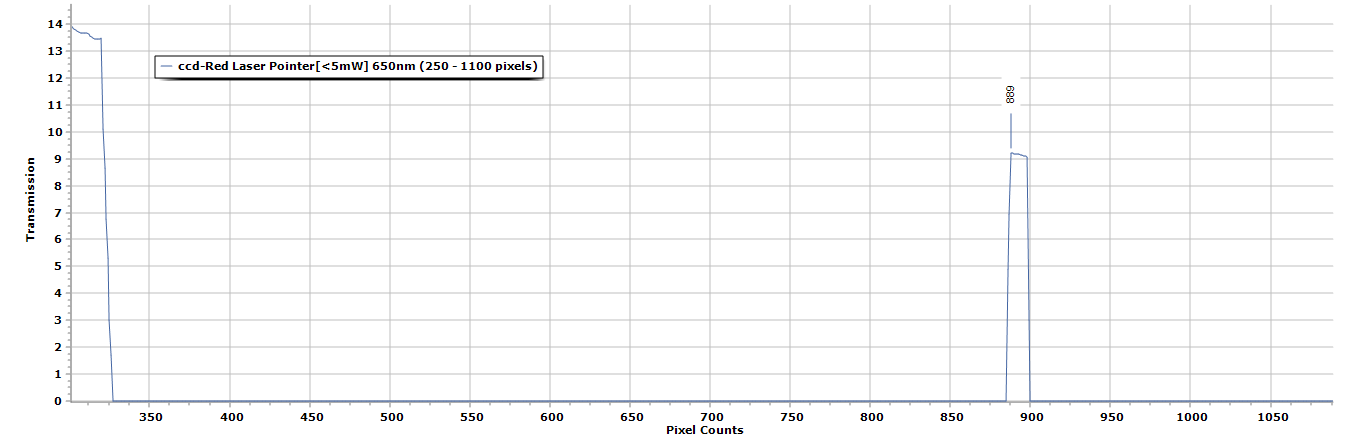
The plots below will show a red laser pointer (<5mW) aimed approx. center on the CCD, NO diffraction grating but I used a 2nd order regression formula table I made on Excel to calibrate the pixels into wavelength (nm).
![]()
This is the un-calibrated plot, it has been corrected for Intensity sensitivity (using an official data set from the Solux corp. technical website/Solux broadband spectrum-4700K ( 260 - 1100nm)
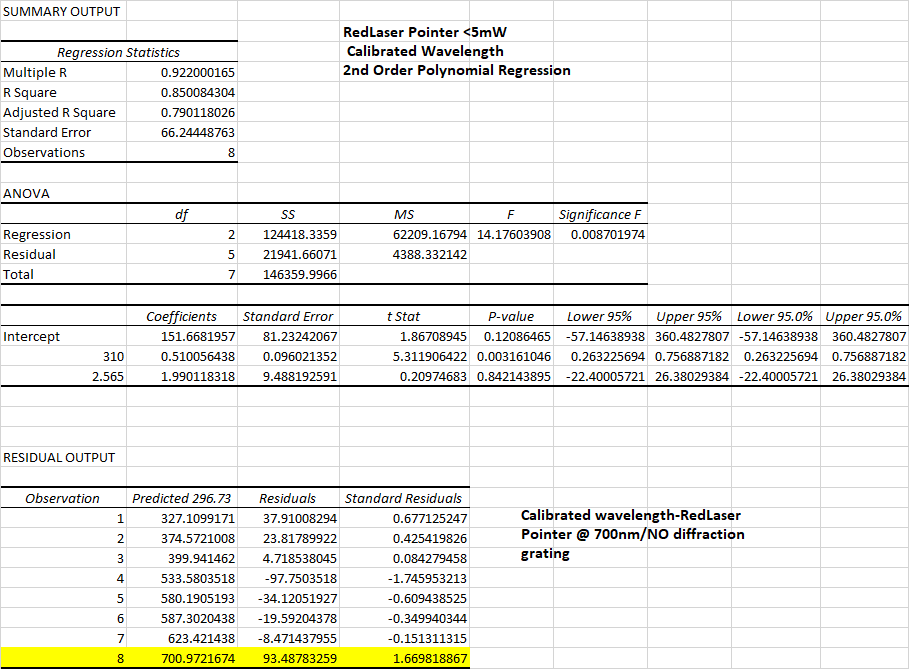
![]()
This is the summary output from Excel using 8 "true" wavelength peaks from an Hg calibrated lamp spectrum. The R squared value is not quite were it should be ( .999) but that's because there was no diffraction grating and I was holding the Laser pointer with my hand.
Still very close, this is just an initial example, making sure the circuit board is functional. The laser pointer states 650nm, but I am getting a calibration of 700nm, probably is about 650nm when I get it in the enclosure with all the optics in place, it should register normally.
![]()
This is the FWHM value data
![]()
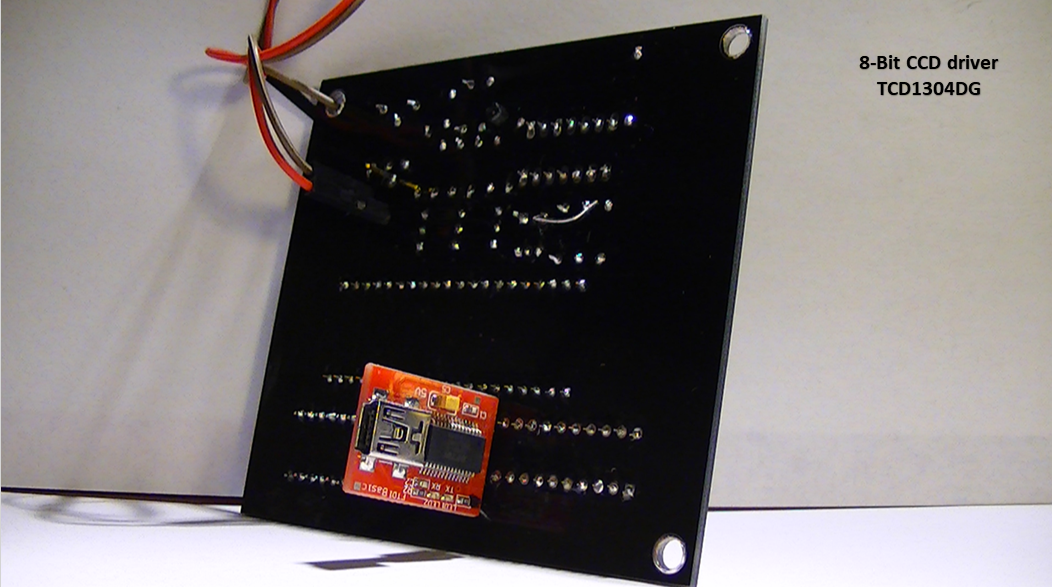
This is how I have the board designed so the USB cable enters the FTDI from the rear and power also enters from the rear and connects to the Arduino Mega 2560 mounted on the side of the enclosure.
![]()
Finally, a front view of the PCB, everything is tightly placed together, I found out something very interesting since this is the 5th re-design, the ADC does NOT like to be too close the LM324 (opamp) I'm sure I could have solved this problem if I would have taken a little more time and perhaps followed the recommended PCB design on the data sheet for the LM324 but it also required a low pass buffer and I just was not in the mood for so much work, sorry.
Anyway I am excited that it finally works well and can't wait to get it in the enclosure with all the fancy optics!
-
Consistency is the key to success
09/29/2017 at 13:48 • 0 commentsAs my project reaches its final phases, I am reminded of the basic tenets of the scientific method:
![]()
The scientific method requires making observations, recording data, and analyzing data in a form that can be duplicated by other scientists. In addition, the scientific method uses inductive reasoning and deductive reasoning to try to produce useful and reliable models of nature and natural phenomena.
One may not really pay that much attention to this when building projects as we do but the same applies as well, especially for a project such as this.
![]()
This flow chart depicts the four basic steps in this process, sometimes I think we forget how to properly utilize this chart when rushing to complete a project to gain a little popularity and monetary gain in the market place and what happens is, the final product becomes somewhat sub-standard at best and perhaps a bit in question as to quality standards of results.
A shinny object with many bells and whistles but no substance under the hood, a good project does not make! A project with a trail of evidence acquired through the scientific method is best.
Case in point;
The two resolution tests done today 09/28/2017, were carried out with two laser pointers, a 532nm green laser <5mW and a 405nm violet laser <5mW. The point of the experiment was to test my CCD driver (TCD1304DG,) detector’s resolution as it stands at this moment, and check for consistency. Even though I am not using any diffraction grating in my test platform I have a dichroitic mirror with a cutoff at 650nm that works like a beam splitter, quite adequate for testing purposes.
The setup is simple, the entrance slit is 2 Gillette razor blades placed at 0.25mm width, distance to 1st mirror (silver coated @ 99% reflectivity,) is 70mm, the beam then travels @ 45 degrees to the dichroitic mirror and is reflected to the CCD @ 39 degrees (blaze angle).
In this way I can capture 85 percent of the beams wavelength and tame the Ariel disk effect without having to use any additional filters or optics. A rather unconventional approach I know, but it works.
This test platform allows me to utilize this circuit as my Beta board, meaning it’s not the final product. This lets me test its functionality in real time and lets me make real time adjustments and design changes as needed. The final board is already to go as soon as I do a few more test runs on this one and I’ll send off the files to get the PCB’s made.
The new dimensions will allow for an excellent fit in the main spectrometer’s enclosure, I was able to reduce the circuit board to 3.5” X 3” (88.9 X 76.2 mm).
![]()
Step number two in the scientific process here as it relates to spectroscopy is, spectral calibration. What I mean by this is, I can’t just drop a sample in the cuvette holder and shoot an image and call it a day, post a spectrum and claim its what I said it is, it doesn’t work that way.
There are standards of practice when it comes to qualitive chemical analysis.
- Use Traceable Standard Reference Materials
Reference material uses include validating methods that help ensure accurate data from individual test runs, calibrating instruments and assessing analyst proficiency. In the United States, a NIST standard reference material is considered the “gold standard” for that material.
2. Run in Duplicate
The purpose of duplicate (sometimes triplicate) testing is to add to the confidence that the test run has produced good data for the test object. Replicate data that agrees is a good measure of method reproducibility but does not prove data accuracy (validity). If the same test run includes a reference material, then the confidence in the validity of the data for the test object is significantly raised. If the object’s replicate test data is not in agreement, one or more of the data points may be invalid; the object should be retested and/or the procedure should be reviewed.
3. Keep Original Data
Whether data is first recorded in electronic/digital form, in a notebook or on the closest piece of scrap paper, keep it. In modern laboratories, handwritten original data is no longer the norm, but if data is first recorded by hand, that document becomes critical to maintain. No matter how often the data is transposed to electronic spreadsheets, databases or any other media, the initial point at which the data is recorded must become part of the documentation.
4. Calibrate Instruments
Instrument calibration, for this discussion, is confirming that an instrument is working correctly before performing a test method, whether a simple balance or a sophisticated analyzer, or a certified reference standard.
5. Use Control Charts
Control charts are excellent tools for several uses, including those already noted. A control chart enables a laboratory to track the results of a reference material and/or control sample at the end of each test run. It gives the laboratory a snapshot of test run quality and a picture of the quality of the laboratory’s results for that test over time.
A Shewhart control chart plots individual test results for a reference material or control sample over time.4 While Shewhart set a 3-sigma deviation from the mean as acceptable control limits, control limits can be set on a case-by-case basis. Customers of the test method should have input into setting control limits.
6. Document Everything and Maintain Good Records
To return to the golden rule of, “If you didn’t document it, you didn’t do it,” organized records benefit a test organization. An ordered records system can be a prima facie indication to customers, auditors, government and legal authorities, and others that the organization follows its procedures. Records provide a fount of information for training new staff members to perform the stable of methods of the laboratory. When customers request copies of their test results, they are readily available, which makes for satisfied and repeat customers. More important, when test results must be defended, these documents are critical.
These are the six most important rules in qualitive analytical chemistry and should always be followed.
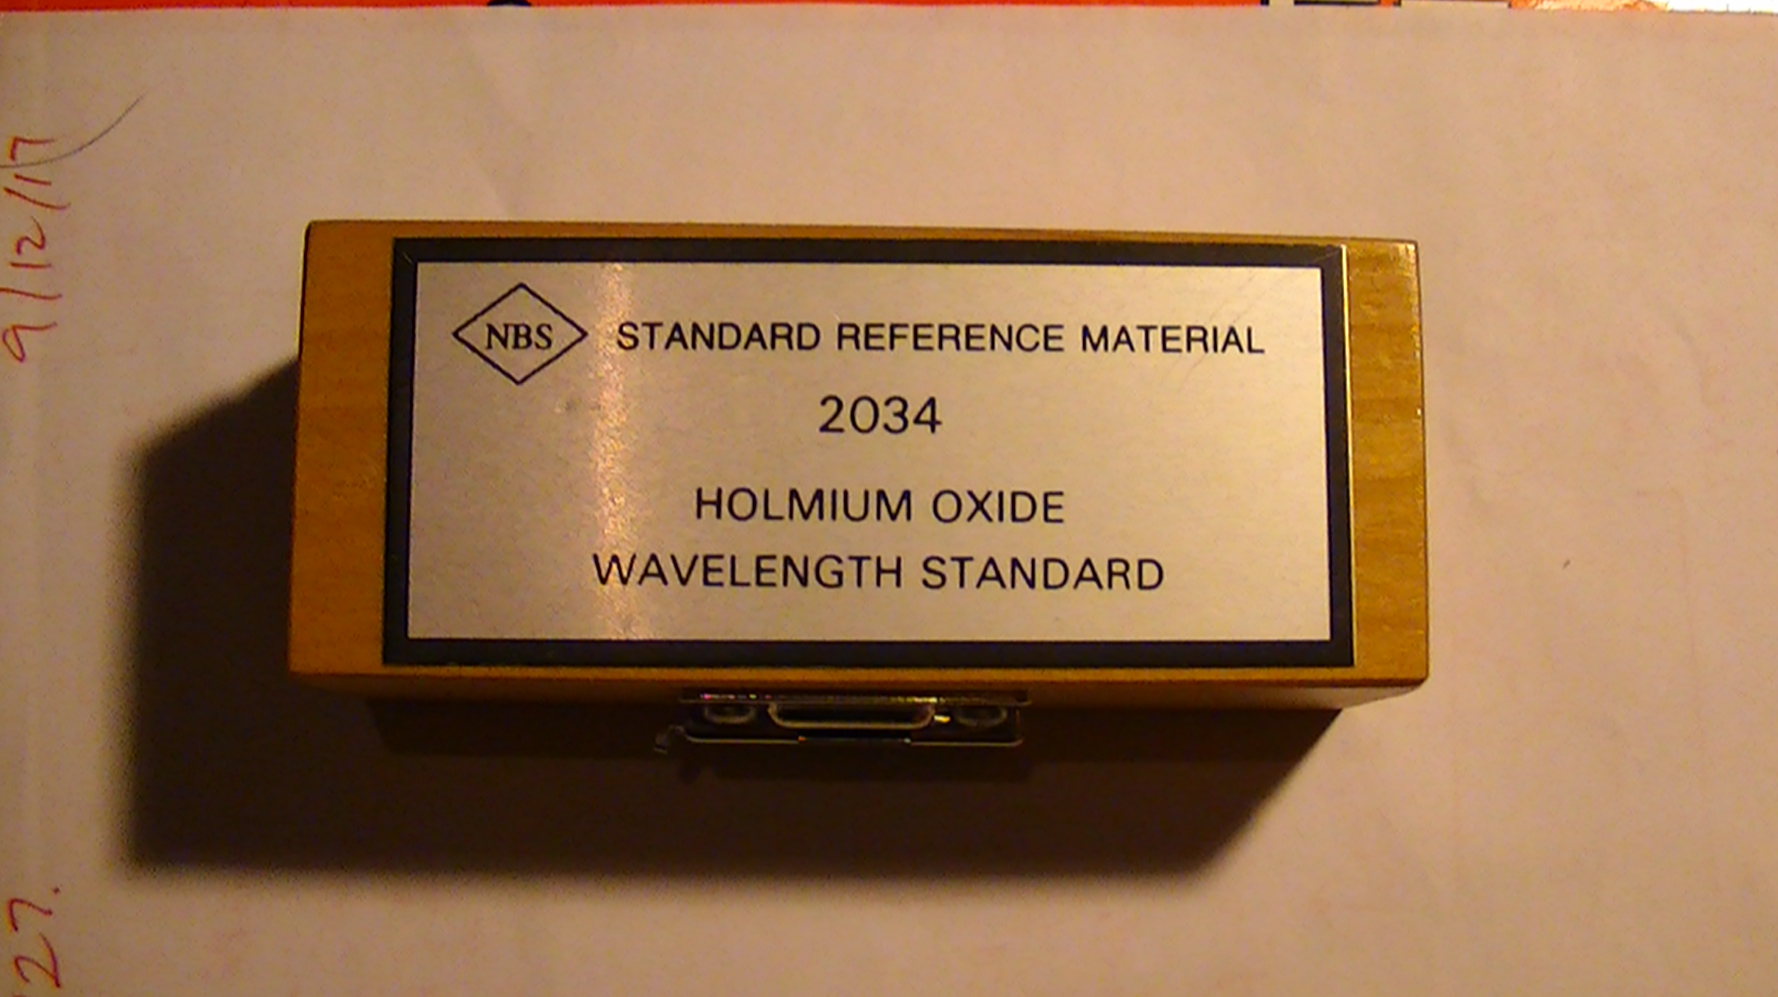
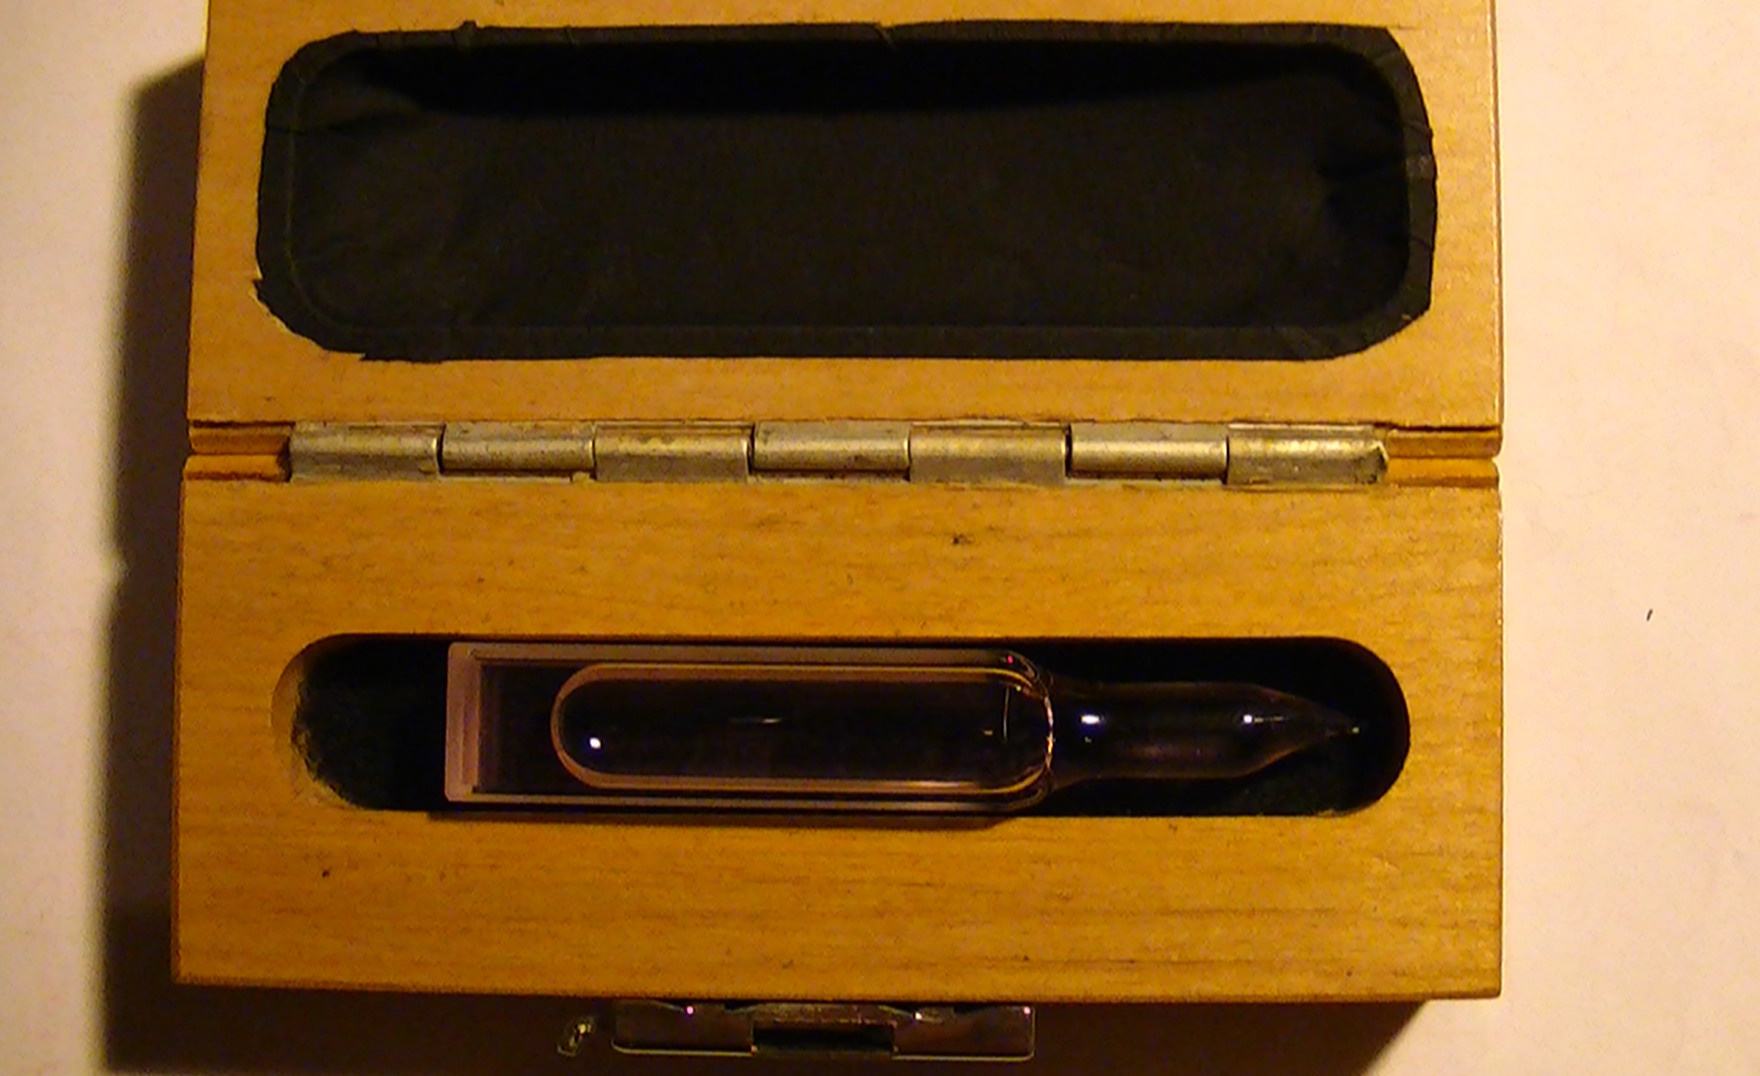
The calibration standard that I will be using is Holmium Oxide, standard reference material #2034 (wavelength standard). The cost was just over $400.00 US, but well worth the investment to me. Holmium oxide liquid is commonly used as a wavelength standard for the calibration of spectrophotometers. It has many desirable features that have made it a commonly used wavelength standard.
![]()
This is my investment in my project.
![]()
You can see it is completely sealed.
Volume 112, Number 6, November-December 2007 Journal of Research of the National Institute of Standards and Technology
![]()
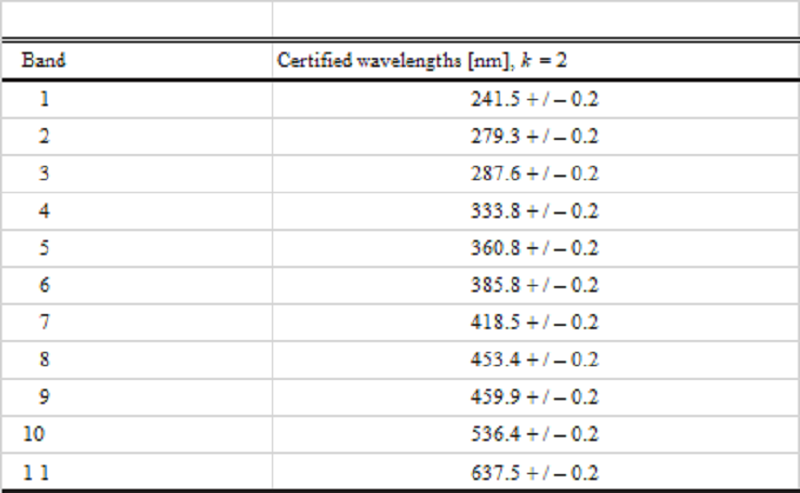
Fig. 1. Spectral transmittance of holmium oxide glass showing 11 NIST certified bands. A line has been inserted for band 8 for clarification. The position of the wavelength minima is the critical parameter, while the level of transmittance can be considered irrelevant.
Table 1. Certified wavelengths of minimum transmittance of the holmium oxide glass filter for a spectral bandwidth of 1 nm. Band 1 may be absent from some glasses due to UV absorbance.
![]()
These 11 bands will ensure that my spectrometer is not only properly calibrated, but ready to process real Raman spectra.
Now for part three;
With my testing platform, I imaged 2 laser pointers, 1 violet 405nm <5mW laser pointer and 1 green 532nm <5mW laser pointer. The objective was to reproduce previous results from a similar experiment using a red 650nm <5mW laser pointer were the results showed a resolution factor of 1nm.
Table 2. FWHM (forward width half maximum,) values for the violet 405nm laser pointer.
![]()
The wavelength values will be skewed because I cannot calibrate the spectrums yet, but that is coming soon, but the results are very clear, @ 0.5 millisecond integration time I have a resolution factor of 0.97368nm.
![]()
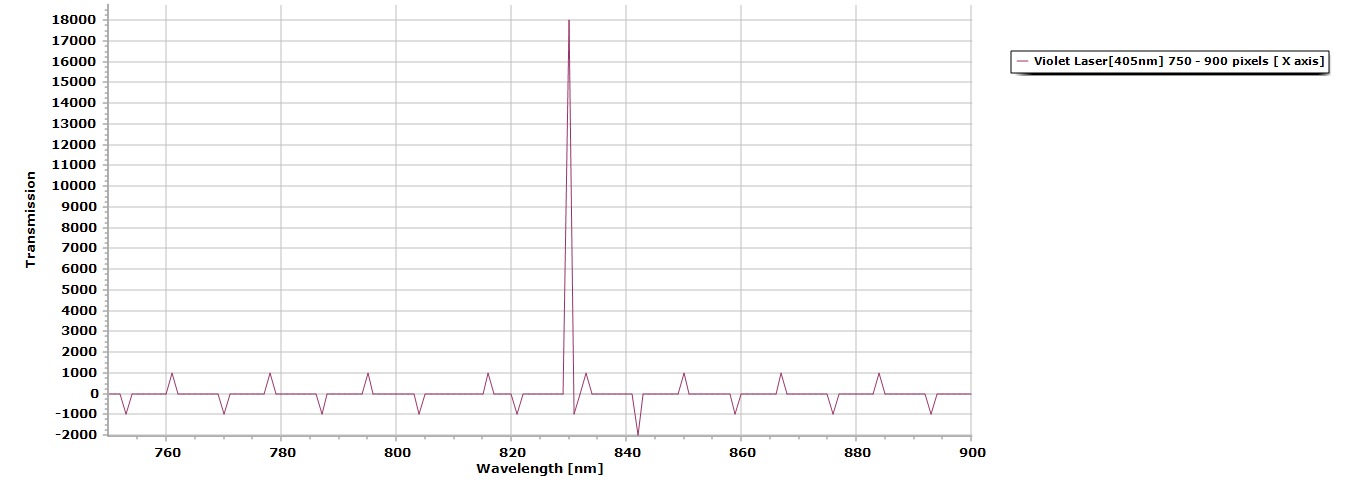
Figure 2. Here is the processed data from its initial absorption spectra to its transmission data using Spectragryph 1.2.5 spectroscopy processing software.
![]()
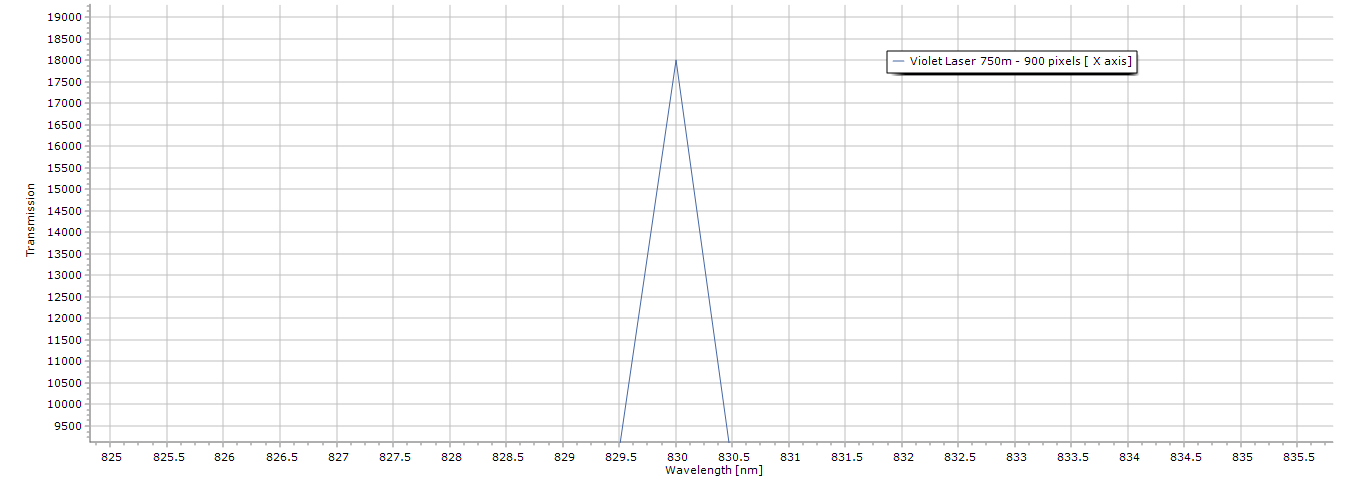
Figure 3. Zoomed in view of the laser peak, notice even without the presence of any diffraction grating there is no spectral distortion due in part because of the dichroitic mirror’s use.
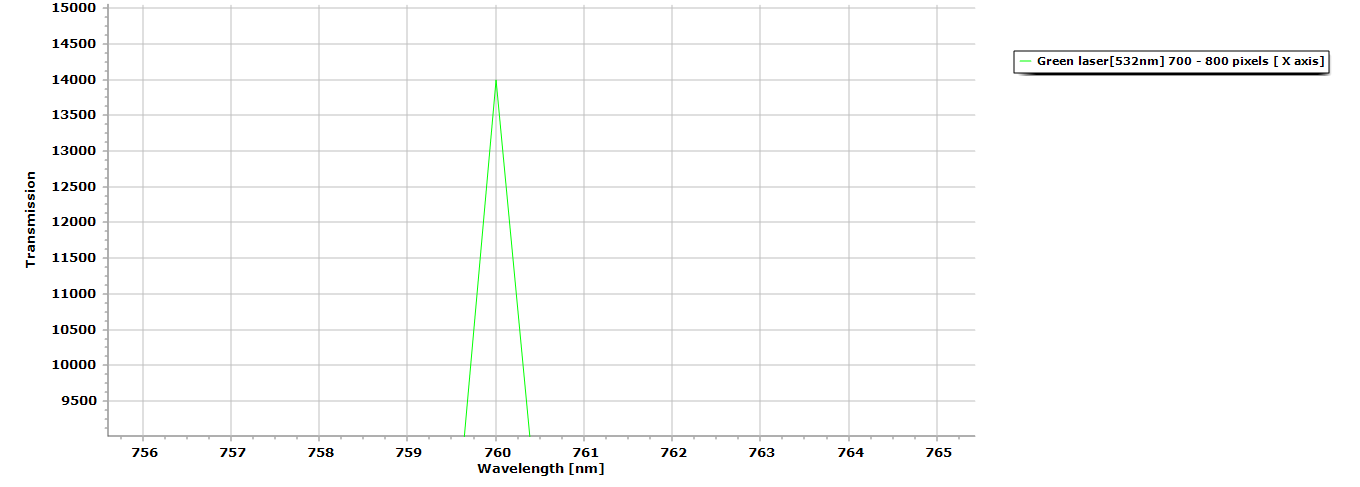
Table 3. FWHM (forward width half maximum,) values for the green <5mW laser pointer.
![]()
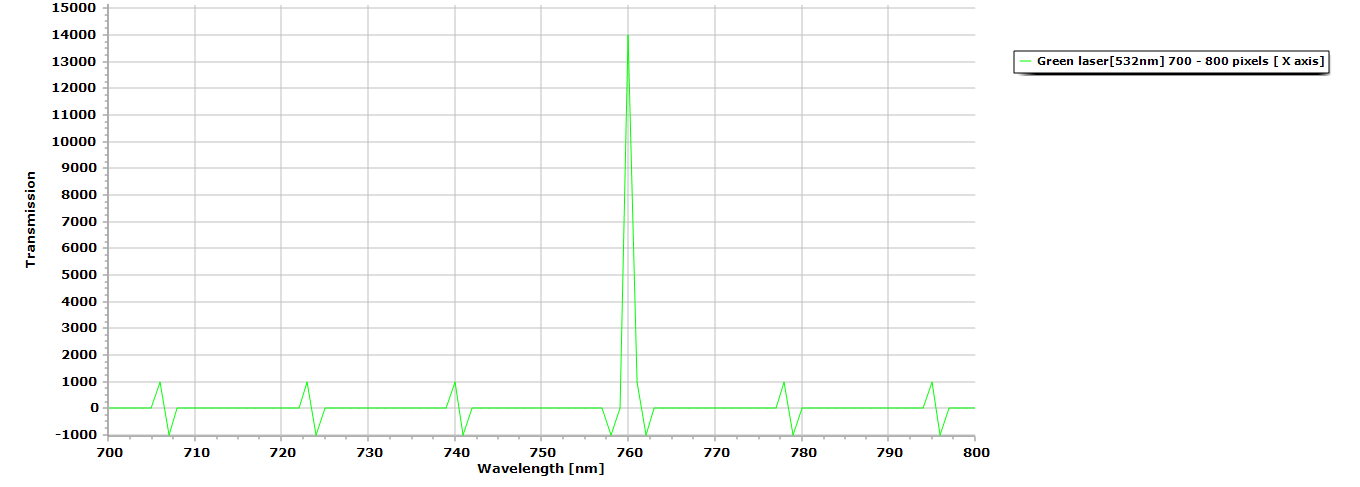
Figure 3. Here is the processed data (green laser pointer,) from its initial absorption spectra to its transmission data using Spectragryph 1.2.5 spectroscopy processing software.
![]()
Figure 4. Zoomed in view of the laser peak, notice even without the presence of any diffraction grating there is no spectral distortion due in part because of the dichroitic mirror’s use.
Table 4. FWHM (forward width half maximum,) values for the red <5mW laser pointer.
![]()
Figure 4. Here is the processed data (red laser pointer,) from its initial absorption spectra to its transmission data using Spectragryph 1.2.5 spectroscopy processing software.
![]()
![]()
Figure 5. Zoomed in view of the laser peak, notice even without the presence of any diffraction grating there is no spectral distortion. I could not use the dichroitic mirror for this as its cutoff is 650nm, so I bounced it off a holographic grating sheet (1000 ln/mm) angled @ 45 degrees.
So, in conclusion, we have three laser pointers with the same resolution results, even though the last test with the red laser pointer used a different method, it does not negate the overall test results because we are testing CCD resolution.
There is still work to be done as far as the noise floor (SNR – signal to noise ratio,) but the final circuit board design should take care of that with precise adjustments.
References
https://www.astm.org/SNEWS/ND_2010/zimmerman_nd10.html
-
1nm Resolution Test Successful 8-Bit CCD Detector TCD1304DG
09/26/2017 at 15:17 • 0 comments![]()
Well, this may be the ugliest test platform I have ever made but it sure worked, I had to modify my circuit board @ R8 going to pin#3 at the opamp [LM324], by running a bypass from the C9 [200pf cap,] to pin#3 @ the LM324, some strange ground problem I can't quite figure out yet from manually placing the components on the PCB design circuit in DesignSpark.
Anyway the bypass works like a champ, I have a very low noise floor [SNR] and a very good signal :) I used a RED 650nm laser pointer as my test spectrum to determine resolution, used NO diffraction grating, only a 0.25mm razor blade slit and my silver coated mirror.
Straight to the point, the data is UN-calibrated, for now, but initial results are beautiful.
Data first...
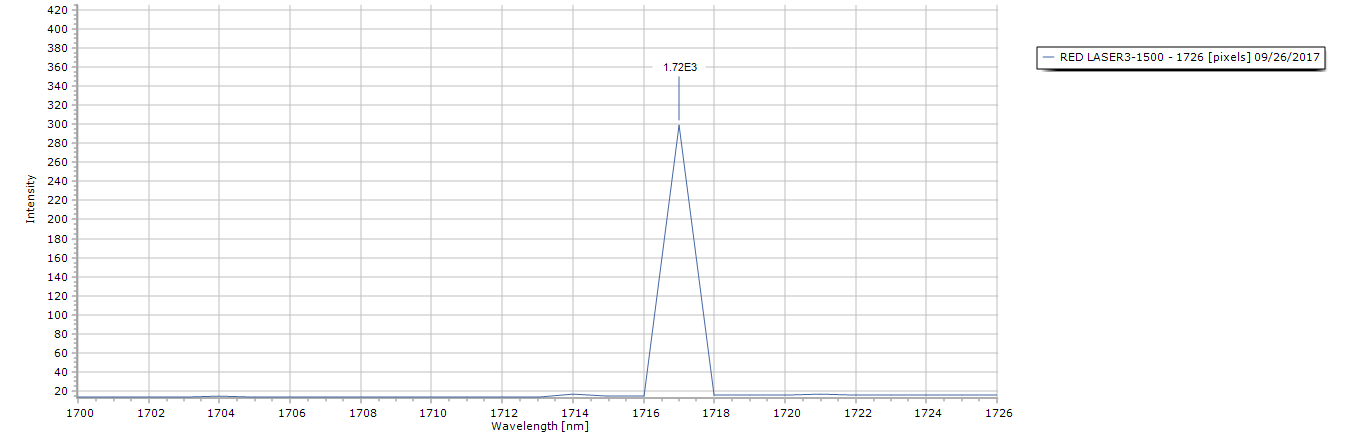
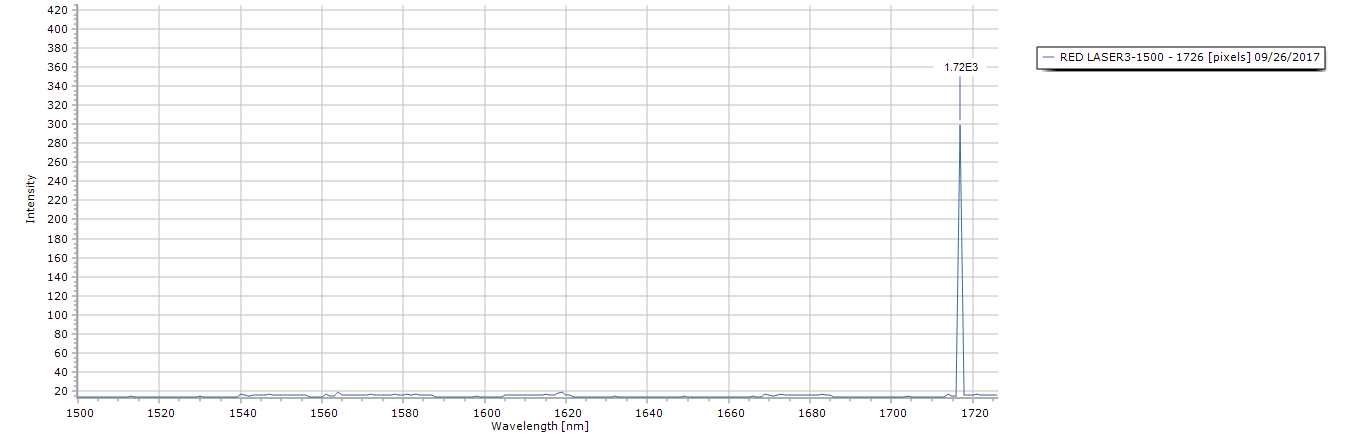
Figure 1 is the 1st spectral image starting from 1500 - 1726 pixels (X axis,)
![]()
Figure 2 shows the spectrum cutoff @ 1700 - 1726 pixels (X axis,)
![]() -
-Next figure (3) is the FWHM data set,
![]()
Here we can see peak position @ 1717 pixels (nm) with A Full Width Half Maximum (FWHM) of 1.0547nm, most excellent, especially since I was only using a makeshift entrance slit made from two gillette razor blades @ a width of 0.25mm.
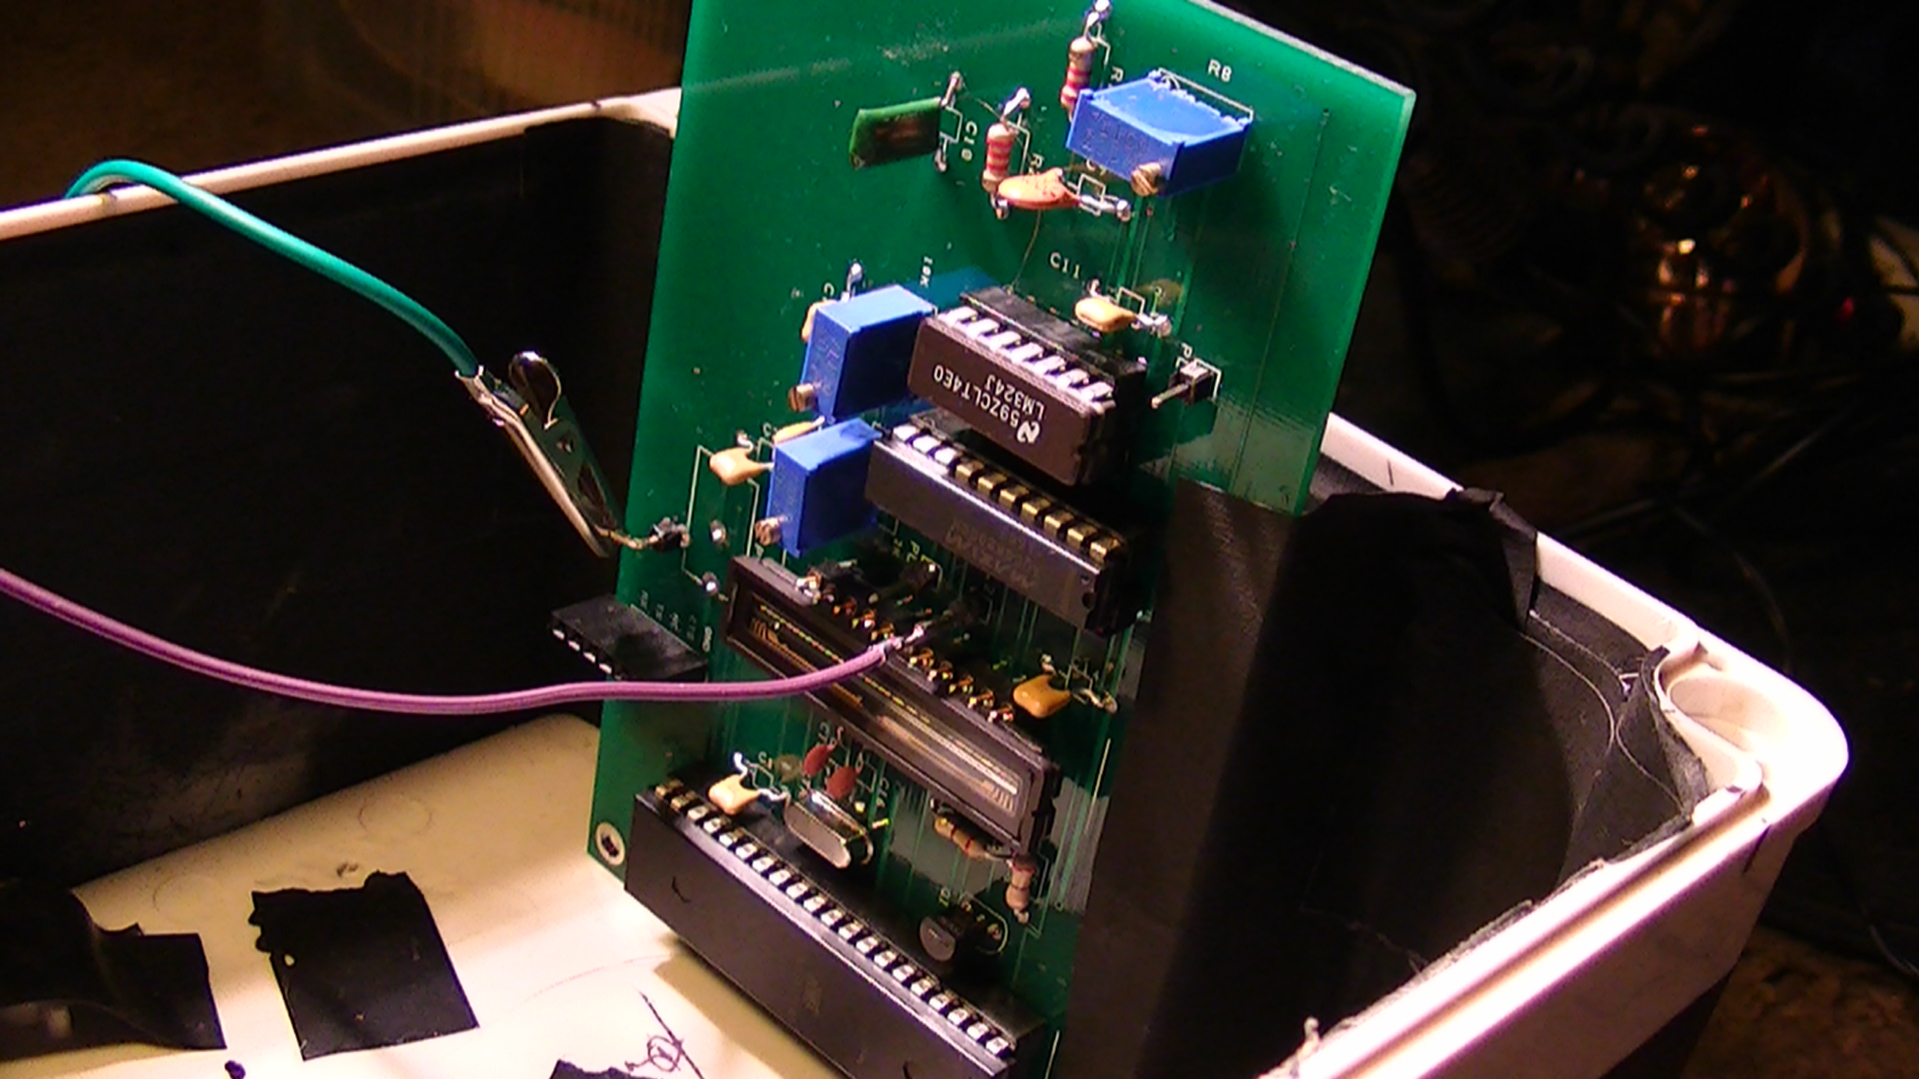
Below is my test platform I made just for this purpose:
![]()
Next image is a closer look at the circuit board:
![]()
And finally a better look at the angle of the mirror in relation to the detector:
![]()
-
PLX-DAQ v2.11 Dual Trace Transfer to Excel
09/20/2017 at 15:28 • 0 commentsThis is my second installment on using PLX-DAQ as an easy method of sending data from an Arduino or any AVR related MCU to Excel. Here I will be showing you how to process the data into a graphical chart for plotting it’s values…the easy way 🙂
Download PLX-DAQ v2.11 here: http://forum.arduino.cc/index.php?top...
Code can be found here: http://playground.arduino.cc/PLXDAQ64...
-
Updated PCB for 8-BIT CCD Detector (TCD1304DG)
08/25/2017 at 09:28 • 0 commentsUpdated 08/25/2017
![]()
![]()
![]()
![]()
![]()
-
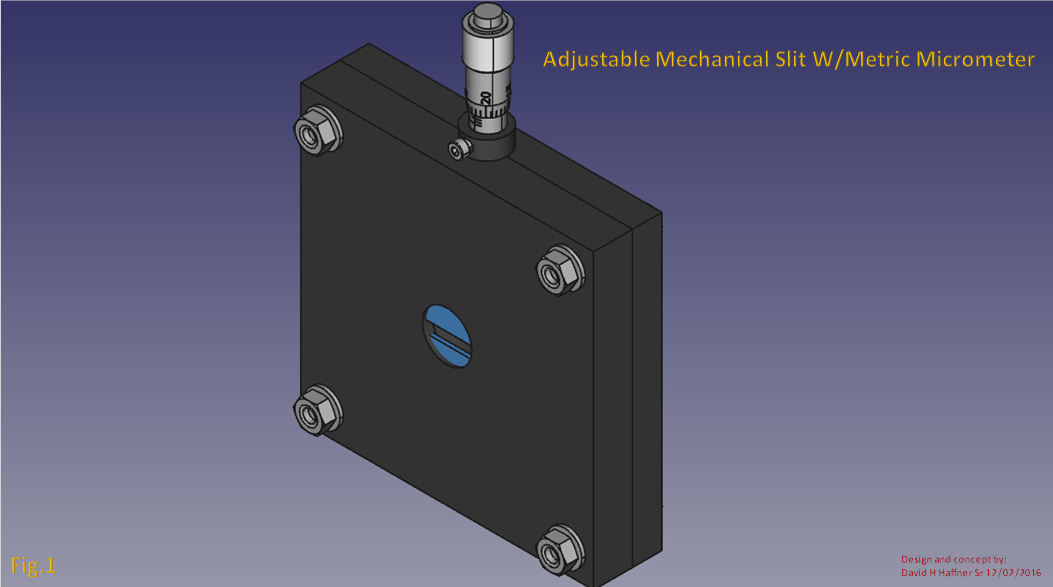
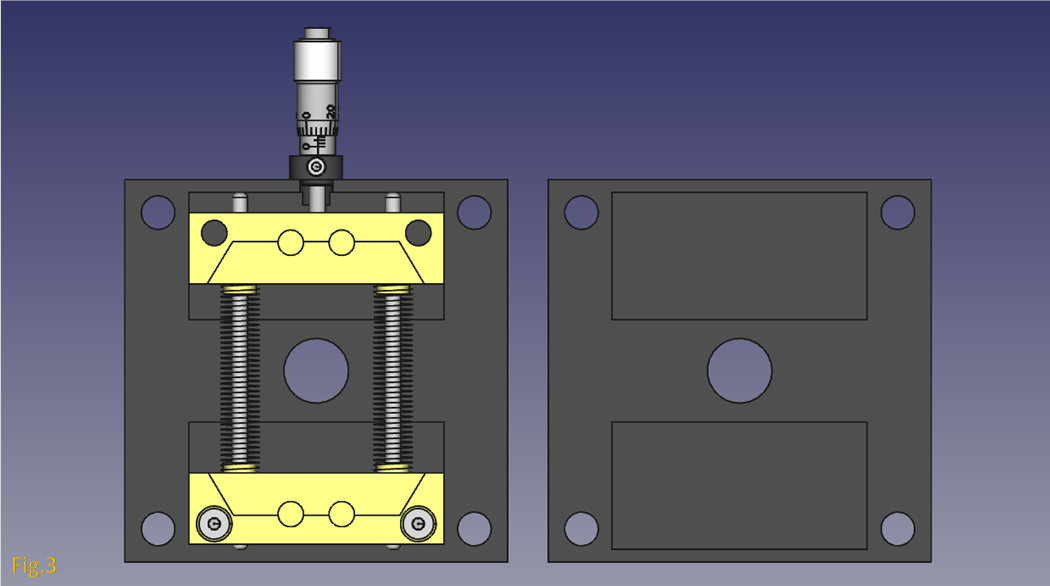
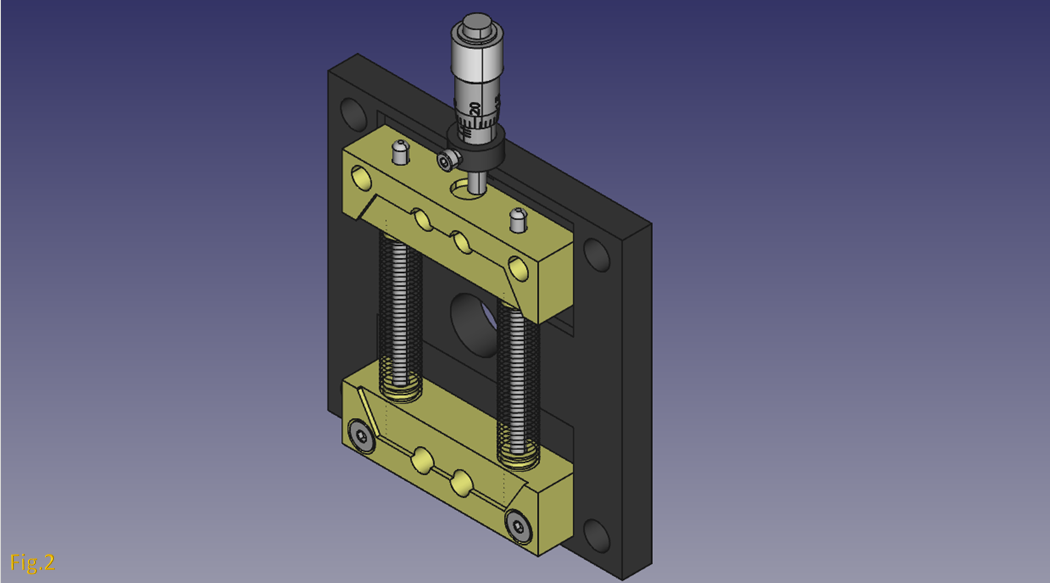
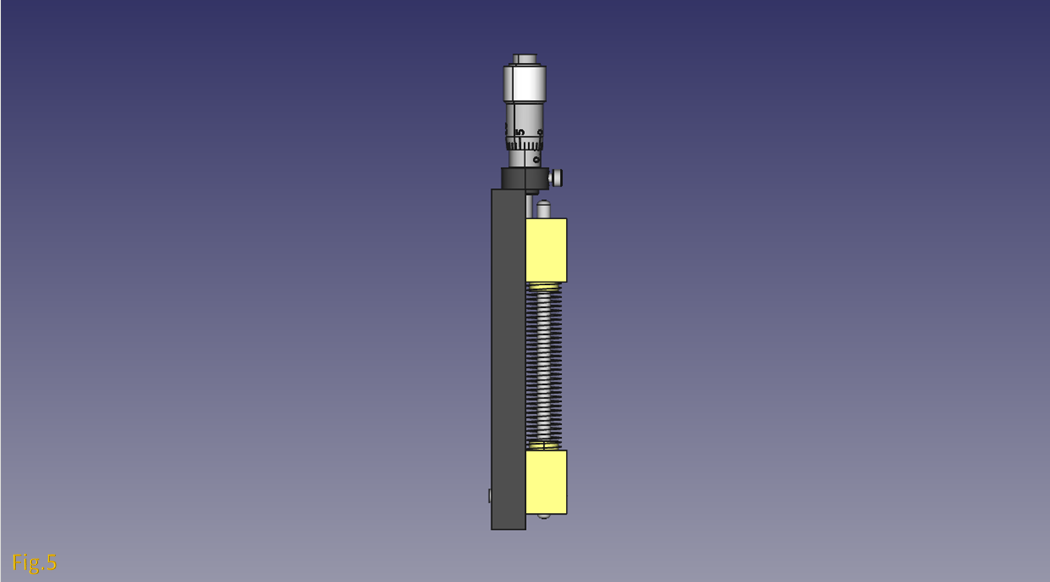
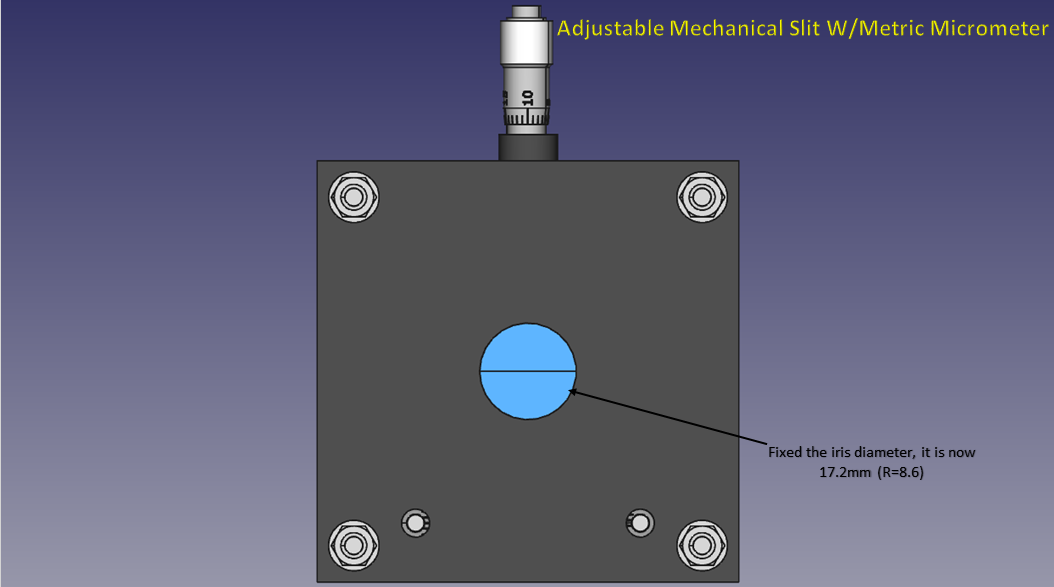
Adjustable Mechanical Slit 3D-Printed for Raman Spectrometer
08/14/2017 at 16:05 • 1 commentThis was a design I worked on back in December of 2016, I took the inspiration from a ThorLabs design, which gave me the idea to make one using a mechanical micrometer a means to manually adjust the entrance slit in increments of my choosing.
Namely, in the range of 0.005/mm, it works on FreeCad v0.16 using the animation simulation, but I am still trying to work out some tolerance issues that are plaguing this design, mainly because of the 3d printing material and techniques.
I'm going to upload the mesh/.stl files anyway in case someone can tweak it and make it better, don't worry there is no license or anything, as all my work here is provided freely, just relying on an honor system of giving credit where credit is due.
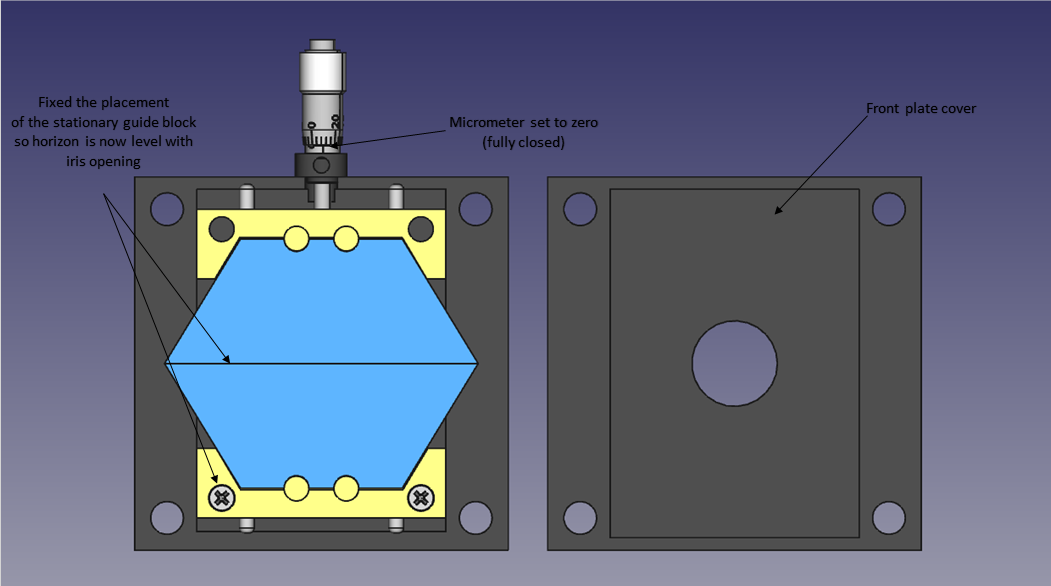
![]()
![]()
The blue hexagon, are 2 Gillette utility knife razor blades, which I examined the edges with my microscope (100x) and the edges are surprisingly even, with fewer jagged edges than normal blades, so both edges come together with a very tight fit.
![]()
![]()
![]()
![]()
![]()
I have the mechanical drawings available if anyone is interested, just let me know and I will email them to you.
-
*Data Update* 8-Bit CCD Driver Circuit (TCD1304DG)
08/03/2017 at 19:50 • 0 commentsWell I've worked out some noise issues concerning the 8 bit ccd design, I'm glad I got to play around with it on the breadboard before ordering the PCB. I was able to make some needed tweaks in DesignSpark and update the gerber files and now they are getting made @ PCBWay.com :)
I am confident in it's performance, even @ 8 bits, I did learn a few things though about working with CCD's, one is, thermal noise, yeah, even with NO power its still there, and on the breadboard it has little room for any air circulation underneath, so I had to compensate for this "dark current" by taking at least 5 dark frames and comparing the frame with the least amount pixel depth and then averaging the other frames together at their higher RMS #'s and subtracting that from the low pixel numbered frame and that gave me a pretty good representation of the most stable dark current values.
I did the same procedure with the sample frame, I used my Solux 50 Watt Halogen lamp (4700K), which uses a 12vdc regulated power supply @ a distance of 52 cm and a slit width of 0.5 mm and slit length of 16 mm. The biggest reason for following the same procedure with the sample frames is because of what is called "shot noise,"
Which is caused by the random arrival of photons. This is a fundamental trait of light. Since each photon is an independent event, the arrival of any given photon cannot be precisely predicted; instead the probability of its arrival in a given time period is governed by a Poisson distribution. With a large enough sample, a graph plotting the arrival of photons will plot the familiar bell curve.
Shot noise is most apparent when collecting a relatively small number of photons. It can be reduced by collecting more photons, either with a longer exposure or by combining multiple frames.
I chose the multiple frames option because I am not capturing any live spectra, as one would if you were imaging a galaxy for example, so I used an integration time of 0.50 ms long enough to get the shot but short enough to not introduce unnecessary noise caused by longer exposure times.
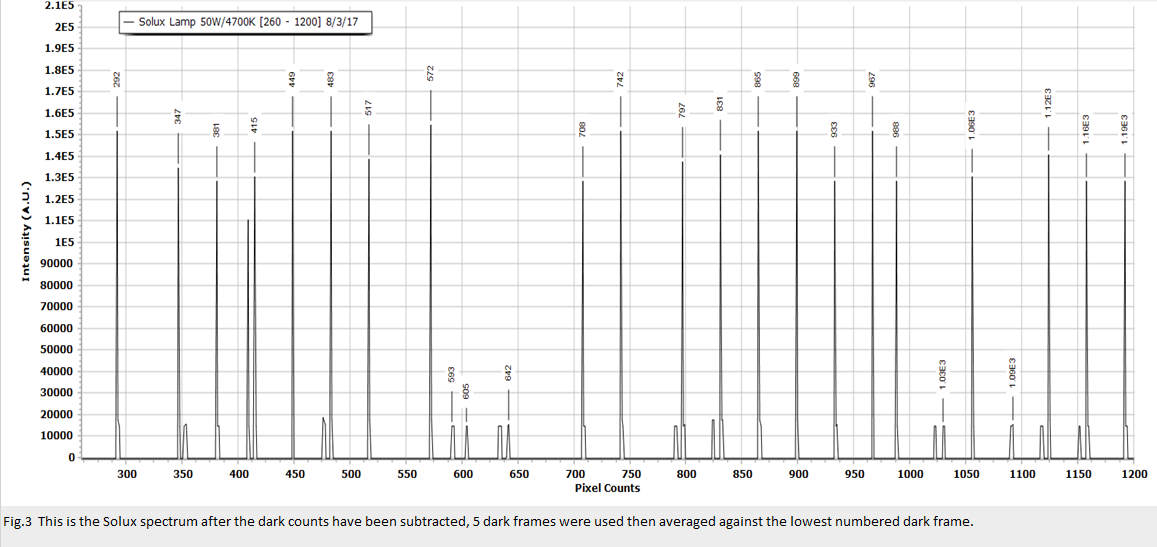
The first plot we will look at is figure 3, because its the raw spectrum from 260 pixels to about 1200 pixels in length. I processed the CCD data using Spectragryph 1.2.0 designed and written by Dr. Freidrich Menges PhD. and is now certified by the NIST. I already subtracted it from the dark frame and flipped it right side up using this LOG formula in excel; =(10*(-B2))*100. This will convert the Y values to -LOG so the spectrum will revert to a transmission spectrum, because negative numbers do not make sense in this case.
![]()
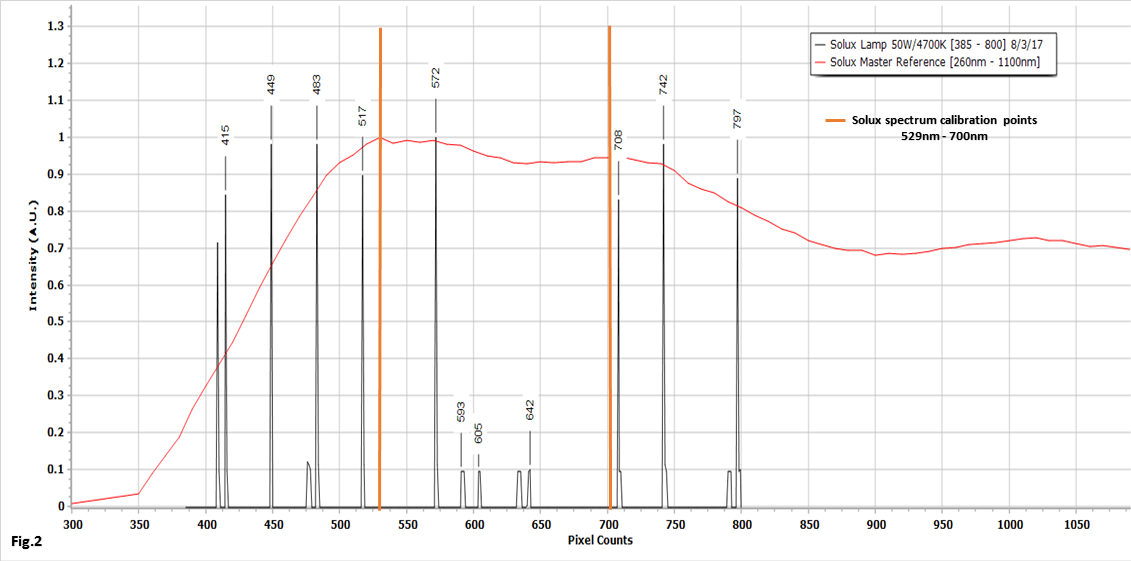
The next plot figure 2, is the spectrum cutoff at 385 - 800 pixel counts. This was the reason for the 16 mm slit length, the only way to manually control the wavelength range was to simulate an actual spectral image on the CCD substrate without a diffraction grating.
In figure 2 you also notice, how I calibrated my Solux spectral image to correspond to a master reference spectrum, a Solux spectral plot I downloaded from Solux Technical Data and Graphs
![]()
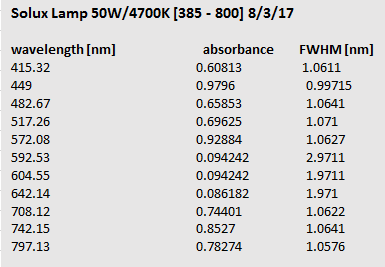
Here is the spectral resolution data for this spectral plot below
![]()
Keep in mind that, @ 1 and 2 nm it's not the best but we are working from a breadboard after all, with no diffraction grating or optics!
Finally I put it all together in figure 1, best for last, and introduced a feature in Spectragryph 1.2.0 called "Spectropic view," where I can align the plot to fit a particular wavelength range and image the spectral lines.
![]()
The next steps are clear when the PCB boards come in and then the final phase of testing can begin :)
DAV5 V3.01 Raman Spectrometer
The only thing worth doing, is the thing worth doing right!


 -
-