Sam Griffen
-
Integration & Testing
04/30/2022 at 22:50 • 0 commentsThis project log summarises the work in the Integration Report and the Testing Report. For more detail on any of the stuff in this log, check those reports out.
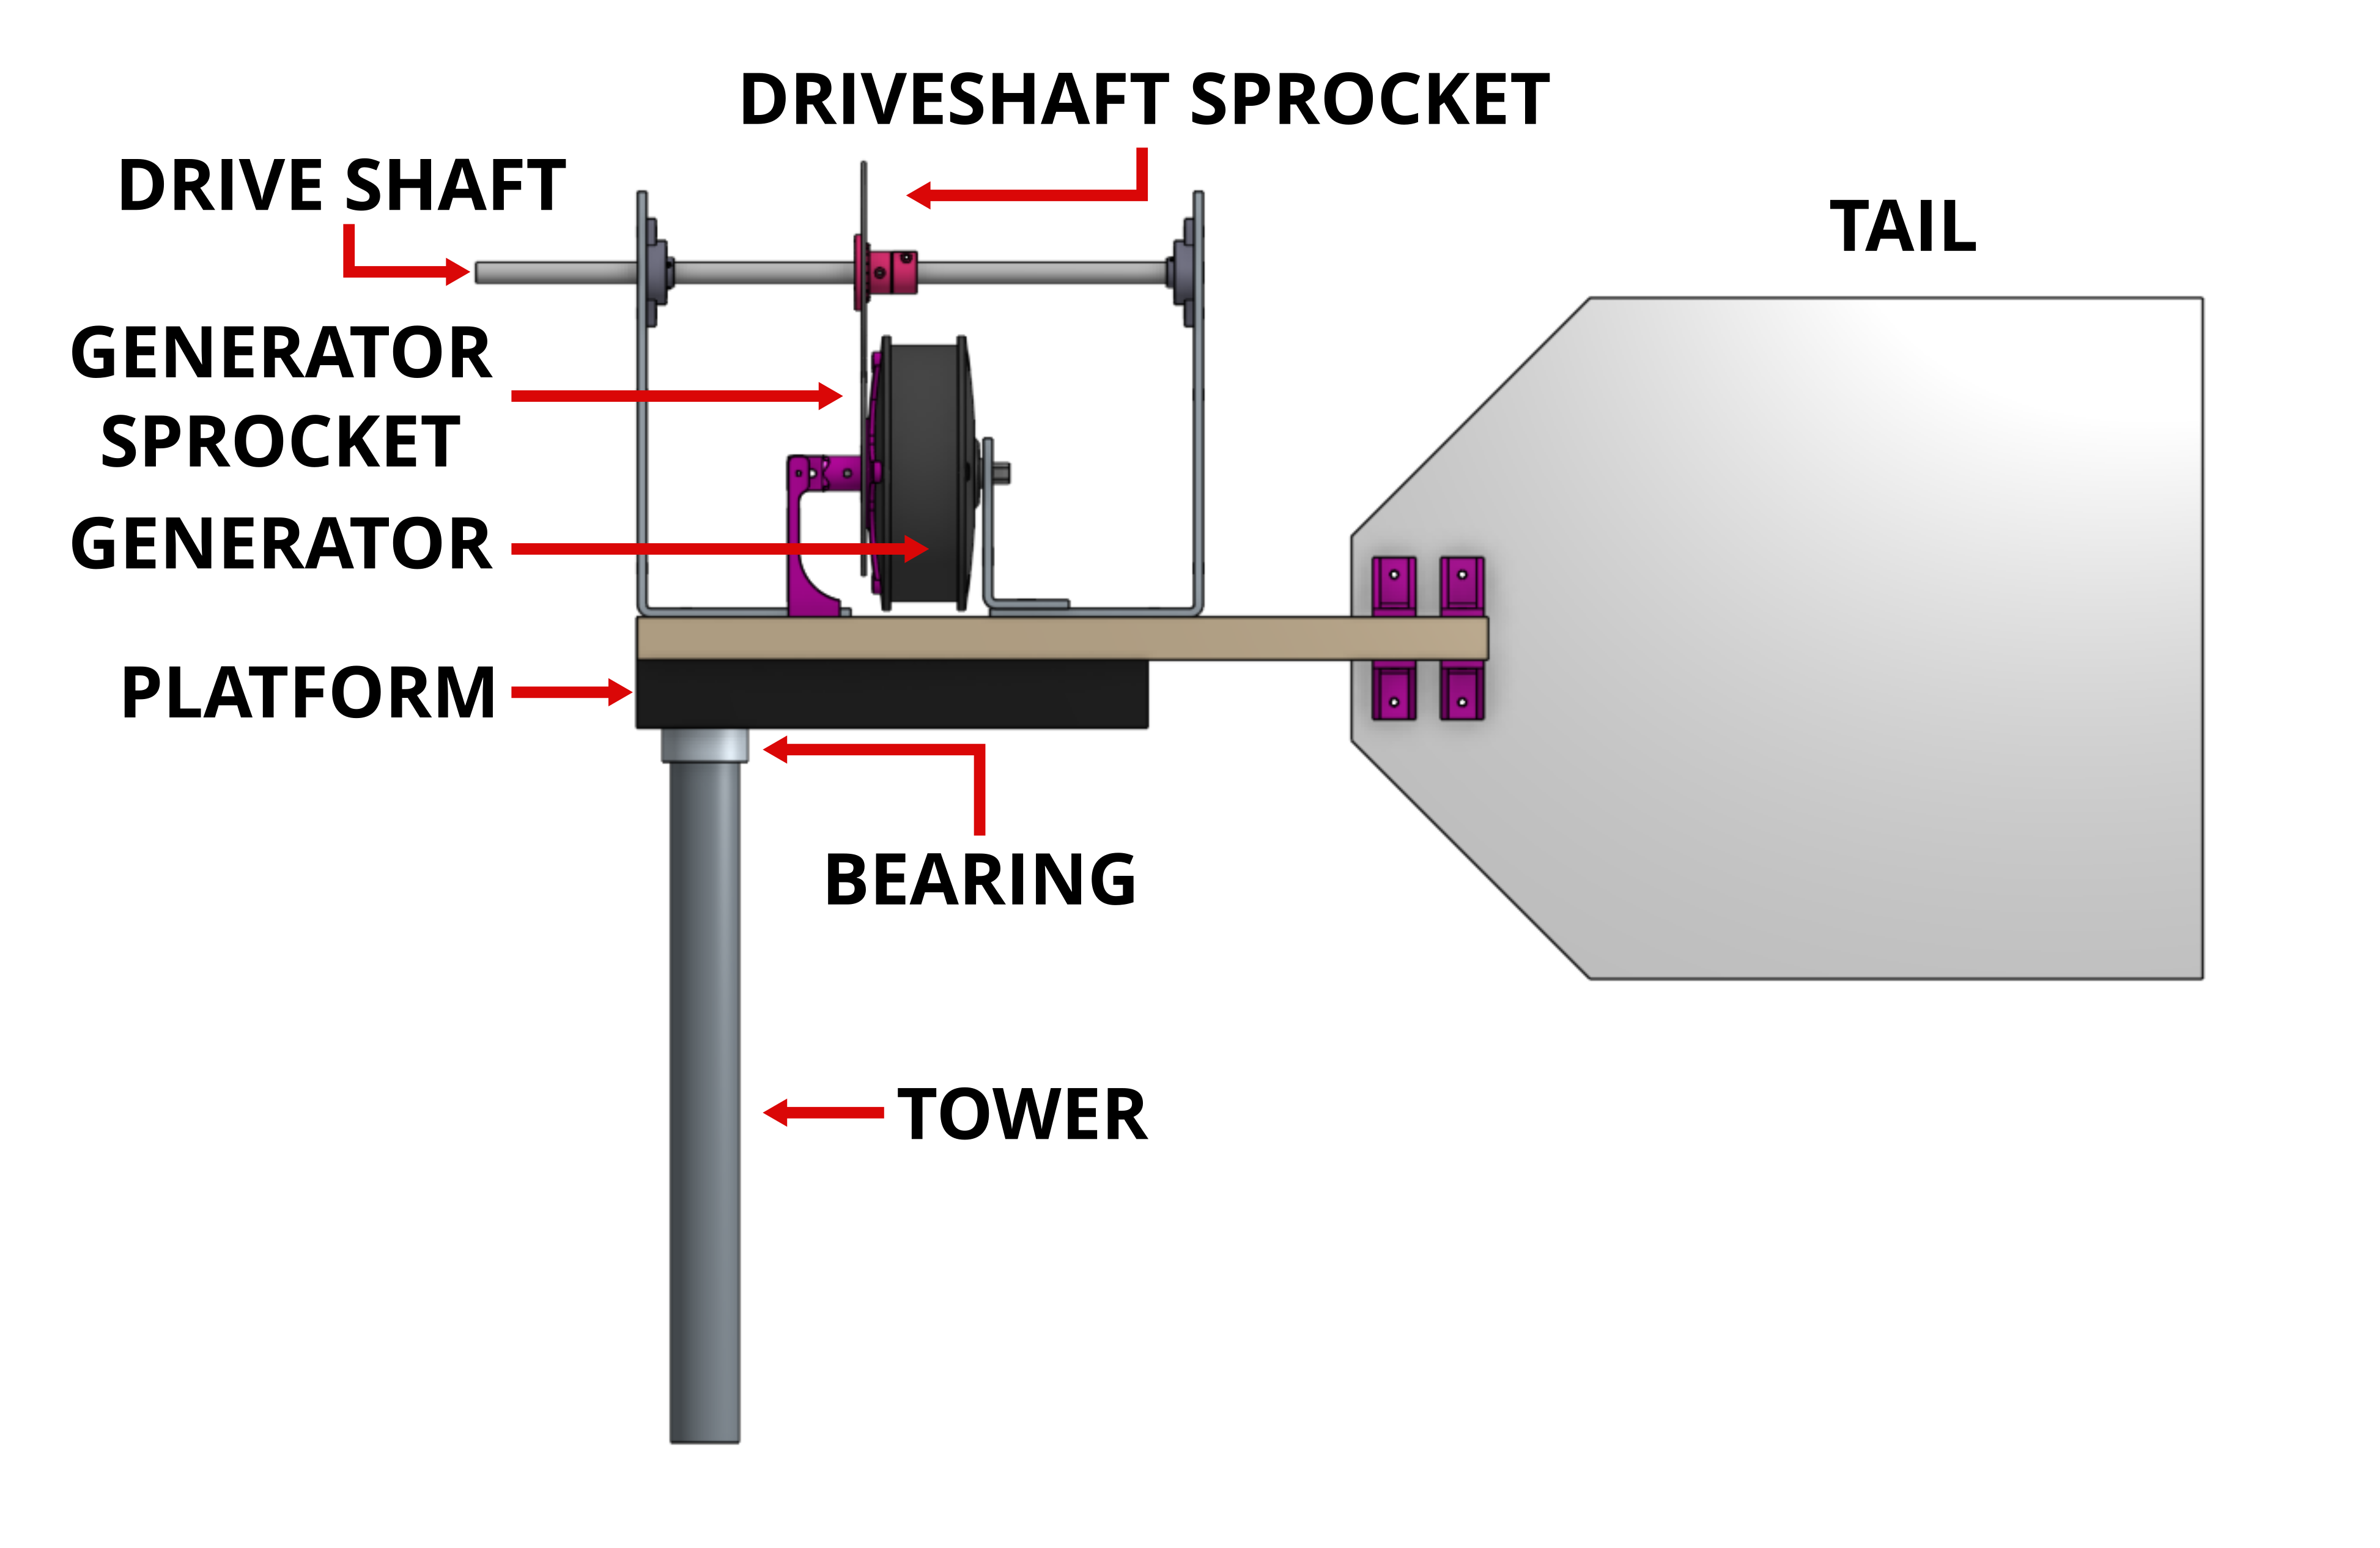
With a rotor design complete, it was time to work out how that rotor was going to be mounted to the fenceline, and how the drive shaft was to be linked to the generator. Figure 1 shows the CAD model of the nacelle and tower. This OnShape model is linked to on the main project page.
![]()
Figure 1: Nacelle model The rotor discussed in the previous log clamps onto the drive shaft. There are then two steel braces holding the driveshaft in place with two bearing blocks. These braces are bolted to a baseboard, which is connected to the main nacelle platform. This platform is a recycled scooter, with the main shaft of the scooter sliding into a steel tower pole that is firmly mounted to the fenceline. With this bearing sitting at the top of the pole, the turbine can be designed to have any desired range of motion, to allow for wind tracking.
In the video above, this setup can be seen. The rotor is connected to the driveshaft, and the nacelle is mounted in the tower post. As this was an initial test of the rotor there is no link between the driveshaft and the generator.
Rotor Velocity Testing
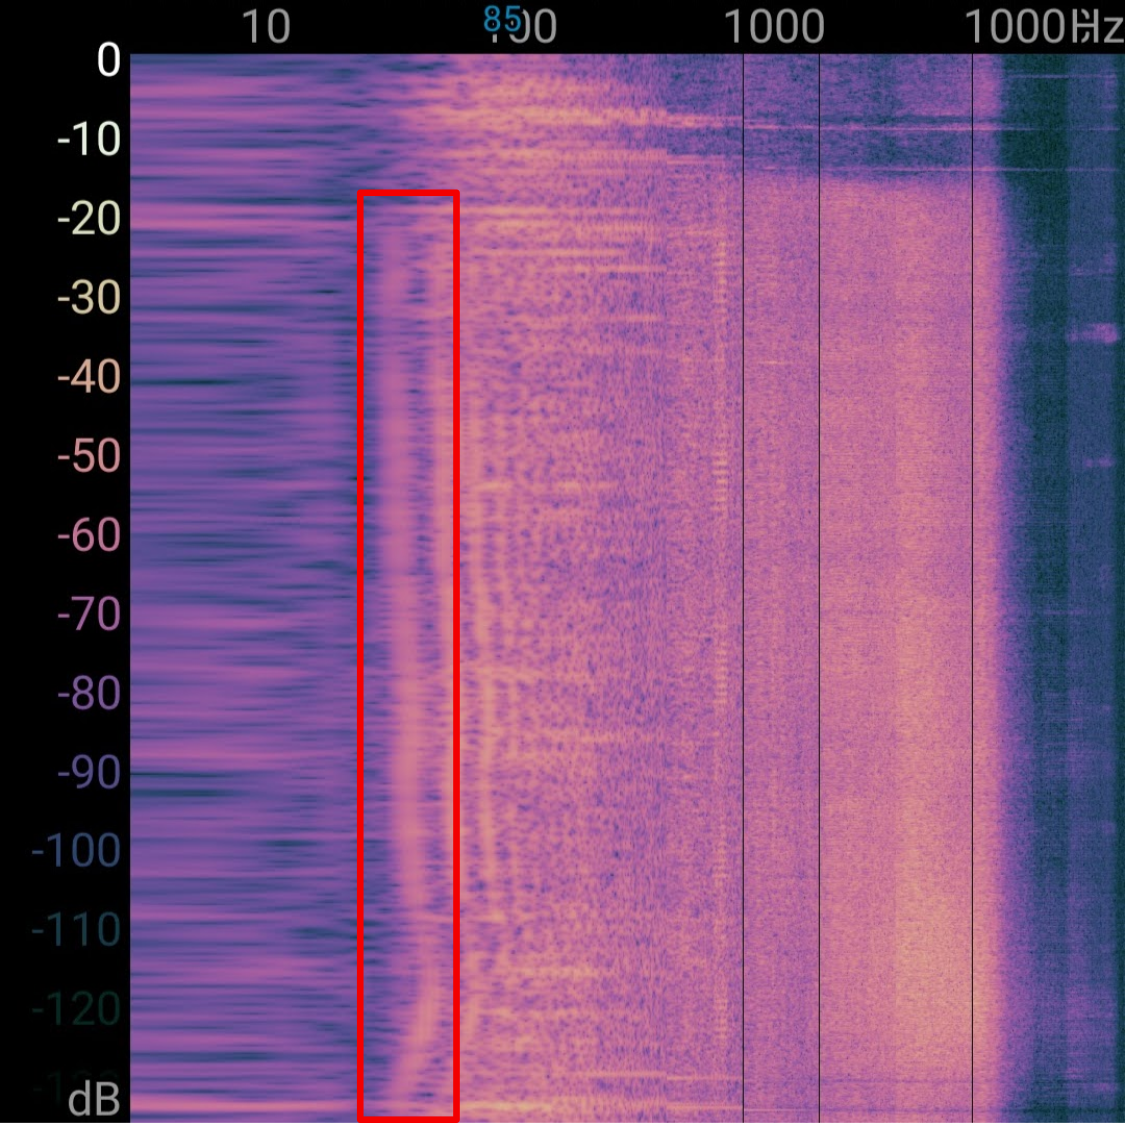
Calculations in the Blade Design Report indicated that for a tip speed ratio (TSR) of 7, in an average windspeed the rotor would operate at around 700RPM. Figure 2 shows an analysis of the audio spectrum of a rotor test. Highlighted in red is a major frequency band that was only present while the rotor was operational, and died off when the rotor was stopped.
![]()
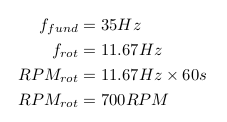
Figure 2: Spectrum analysis of operational turbine Figure 3: Rotor speed calculation Given three blades on the rotor, it is reasonable to imagine that this frequency will be three times the operational frequency of the rotor. With the band at approximately 35Hz, calculations shown in Figure 3 found the rotor RPM to be approximately 700RPM. Having this number align with the theoretical model was pretty exciting, it indicates that the blade development methodology has some weight behind it.
Generator Integration
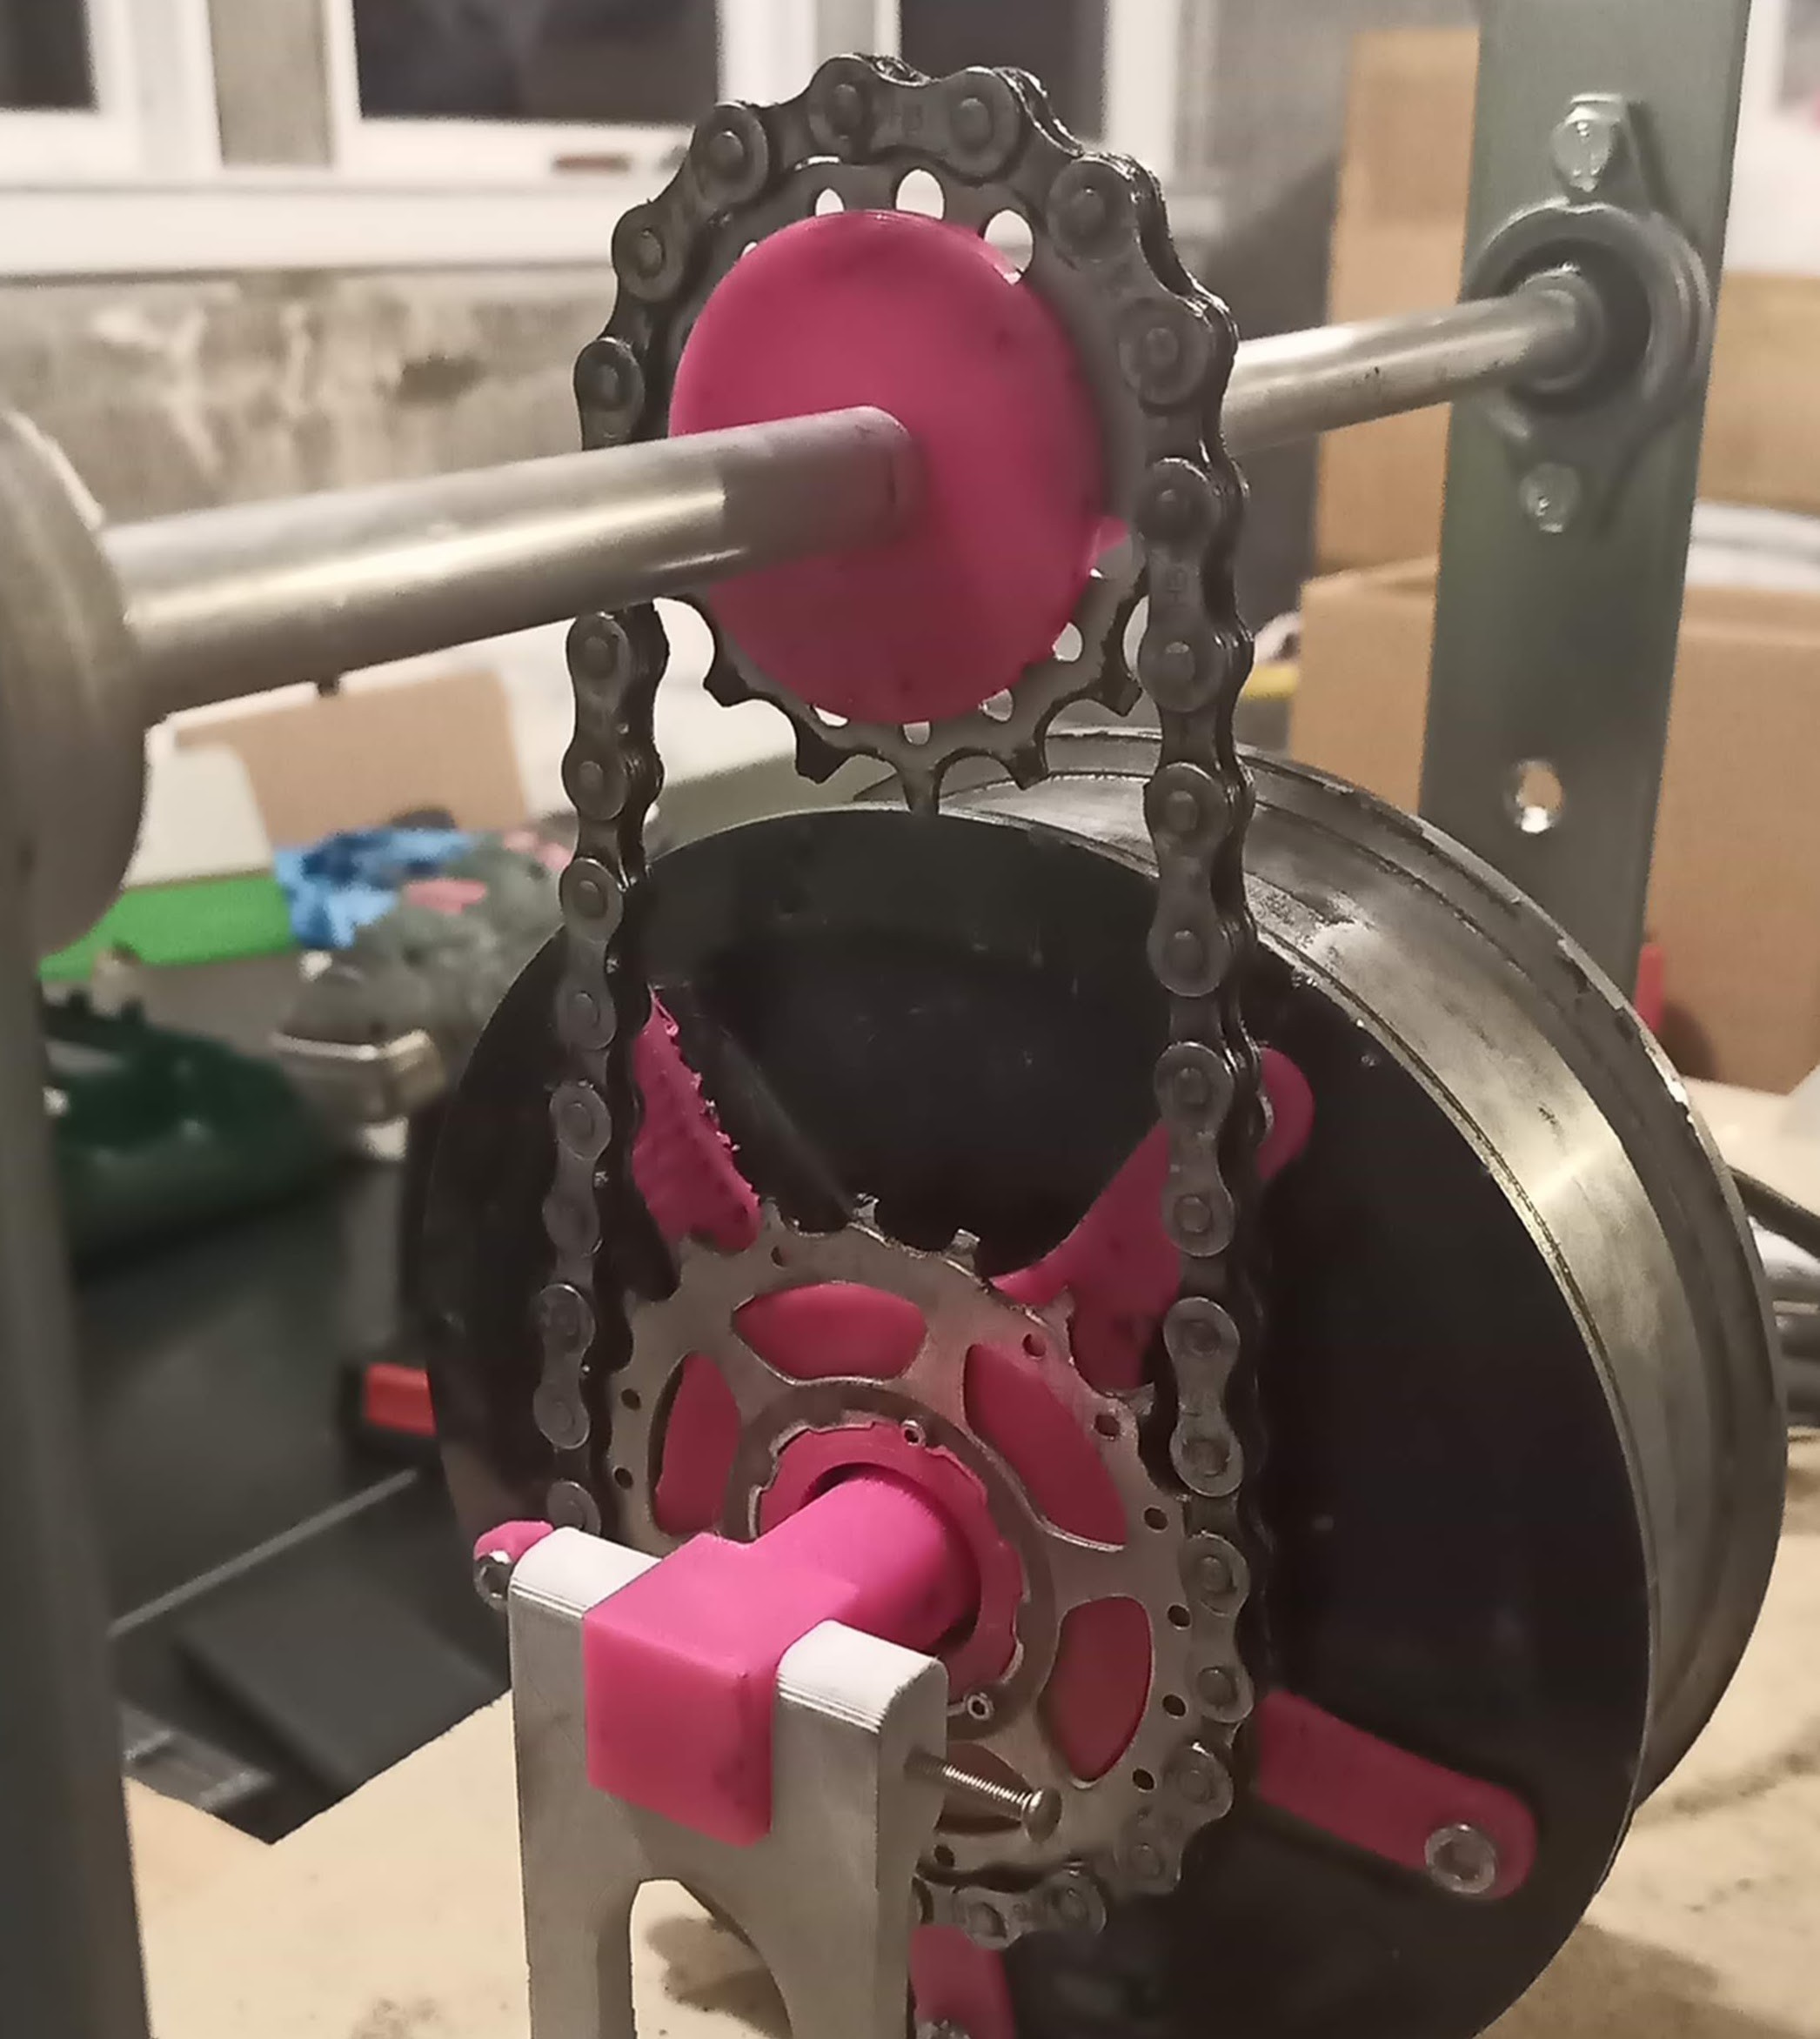
Once the rotor was shown to effectively self start, and spin up to expected speeds, it was time to integrate the actual generator and look at whether power could be effectively extracted. A set of sprockets and used chains were obtained from a bike shop, and my plan was to use these to modify the startup torque required from the rotor, and the operational speed of the generator.
Figure 1 roughly shows how these were to be set up in relation to the rest of the setup.
![]()
Figure 4: Drive shaft to generator drivetrain Figure 4 gives a close up image of the developed gear train. A number of chains were developed to allow for testing of a range of sprocket configurations.
Testing & Results
Initial testing indicated that for a TSR of 7, the startup torque required was too high and could not be generated by any of the fabricated rotor configurations. There is detailed discussion in my Testing Report on this topic, but the result was a shift to a TSR of 5, and a wider root section. A lower TSR results in a lower operational speed (Approximately 500RPM) allowing for a lower gear ratio, and a wider root section will increase the generated starting torque.
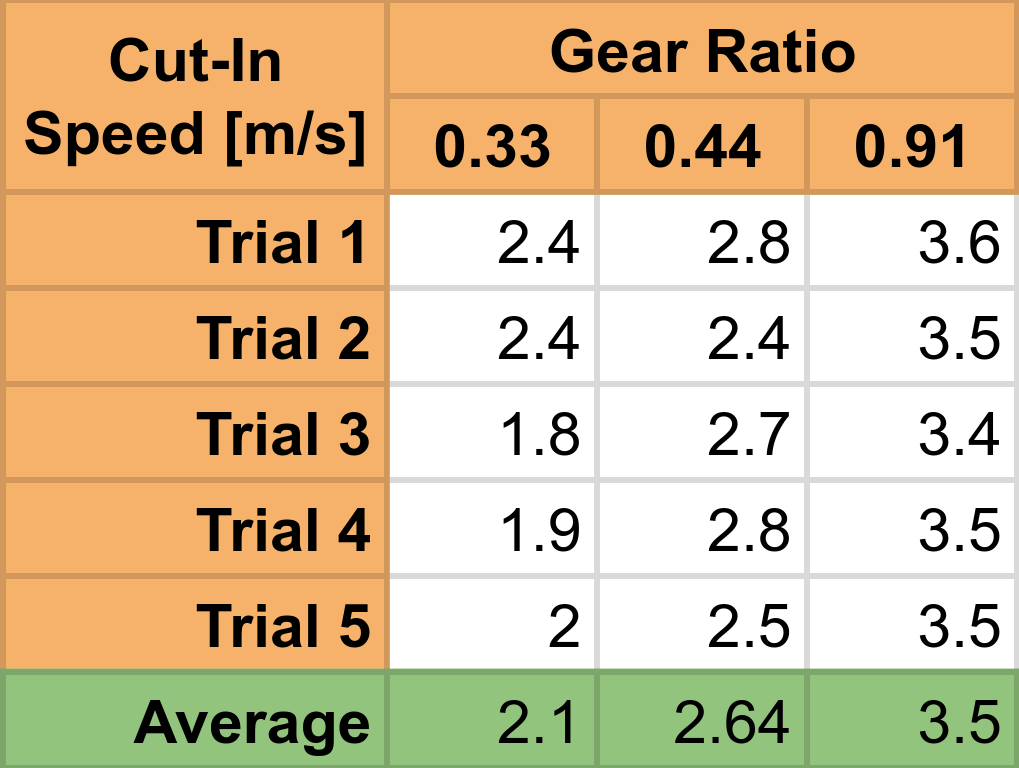
Testing then pivoted to analysing the impact of gear ratio on the cut in speed for this TSR 5 rotor configuration. Figure 5 shows the results of these tests. With a ratio of 0.44 or below, a cut in speed below 3m/s was achieved. This was important as the NIWA data obtained indicated that with a cut-in speed between 2 and 3m/s, 85% of the available wind could be effectively harnessed.
![]()
Figure 5: Gear ratio tests In terms of power output, there is detailed discussion on the small amount of power that was produced in the report. In summary, it wasn't much. At most the rectifier output 5.8V, producing between 0.2W and 0.6W. This is obviously far from ideal, given that the maximum power available in the wind is theoretically 145W.
Work From Here
The rotor works, and works pretty well. However, the generator poses some serious problems. Future work coul potentially look into either gearing the generator differently to provide a lower startup torque, and a high operating speed to ensure high output power. Alternatively, this work could look into stripping the copper wire and permanent magnets from the scooter motor, and winding a custom generator. This could allow a custom generator design that operates optimally at 500RPM, or even 700RPM. This could also be a good opportunity to remove the gear train entirely, resulting in a smaller nacelle and less complicated mechanics, which could minimise maintenance reuirements.
Additioanlly, future work needs to look into electronic control systems for electronic braking, and maximum power point trackin systems.
-
Blade Development
04/30/2022 at 03:32 • 0 commentsAs this project was accellerated by working on it as a self directed study during the final year of my degree, I have written reports detailing the process. This log effectively just summarises my Blade Design report, found here.
One of the most important aspects of a wind turbine is the efficiency with which energy can be extracted from the wind. A large part of this efficiency depends on the aerodynamic properties and configuration of the blades. It is therefore critical that any turbine design considers the impact of all relevant blade parameters, and implements some process to optimise aerodynamic efficiency.
For the design of this turbine design there was one location suitable for installation. The goal of this setup is to provide power for a small greenhouse, and the fenceline adjacent to the greenhouse is exposed to a large amount of wind. There is no other really suitable location for a turbine on the property, and therefore there wasn't much opportunity to analyse various positions.
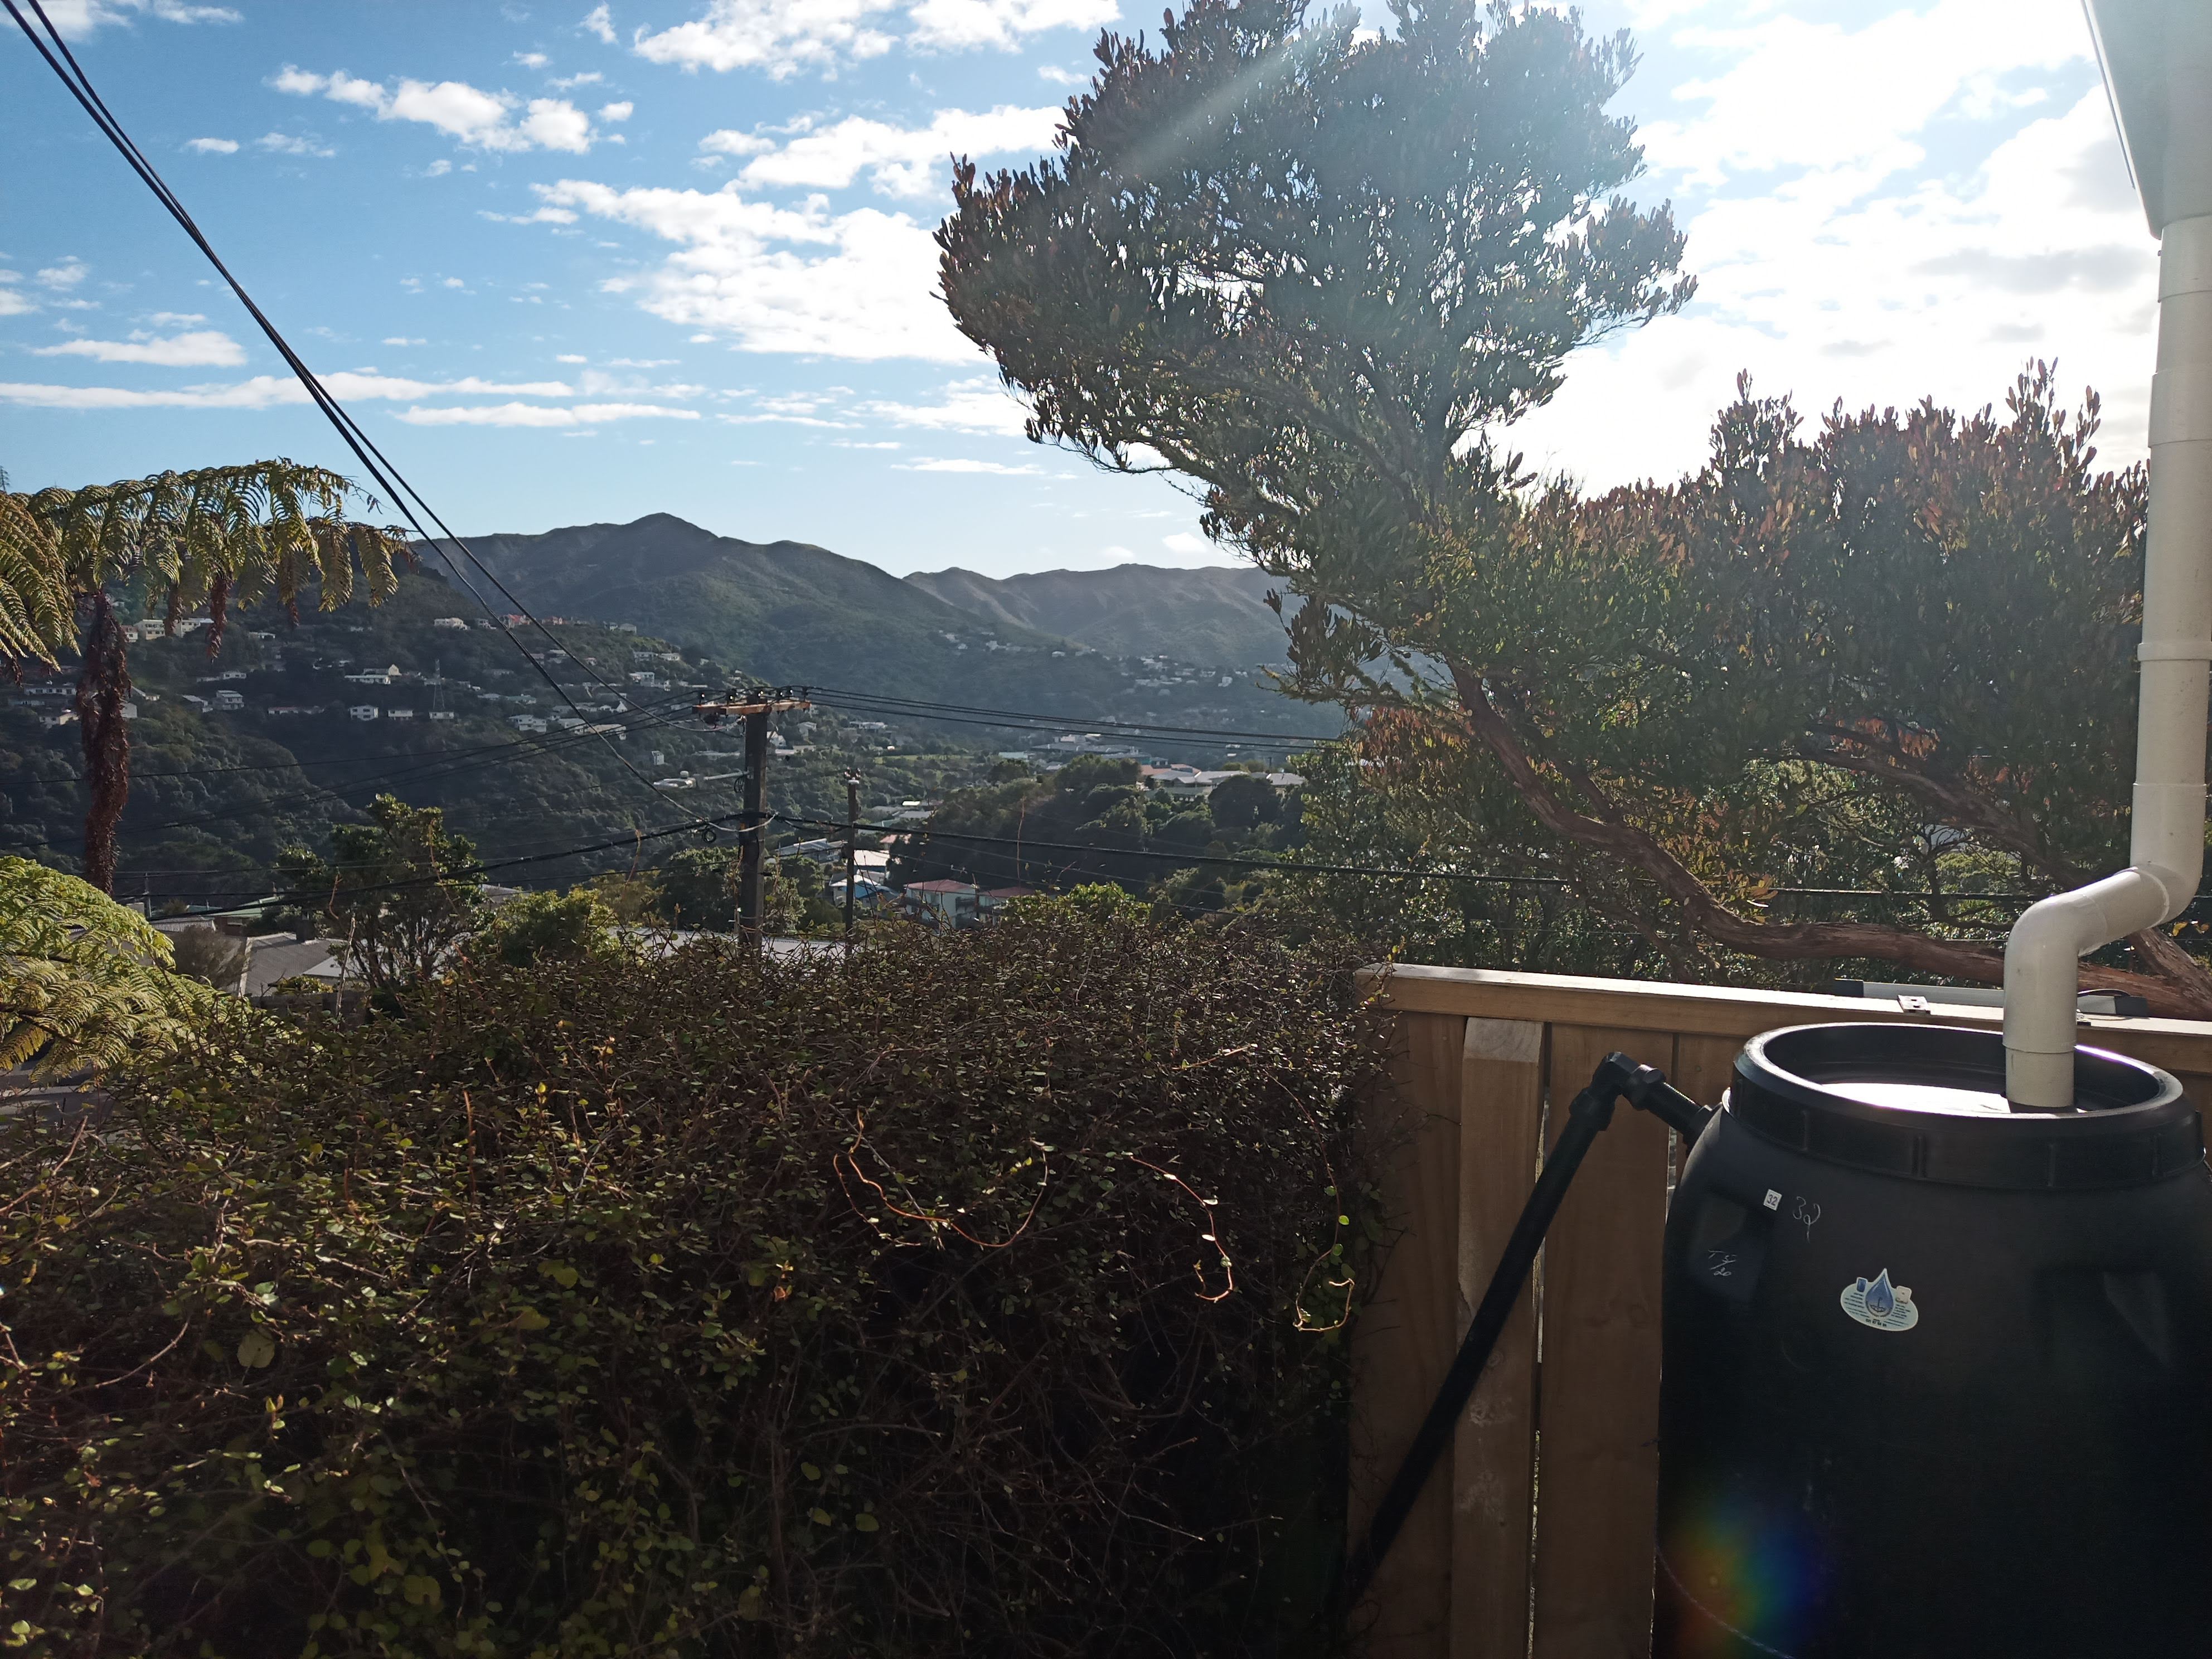
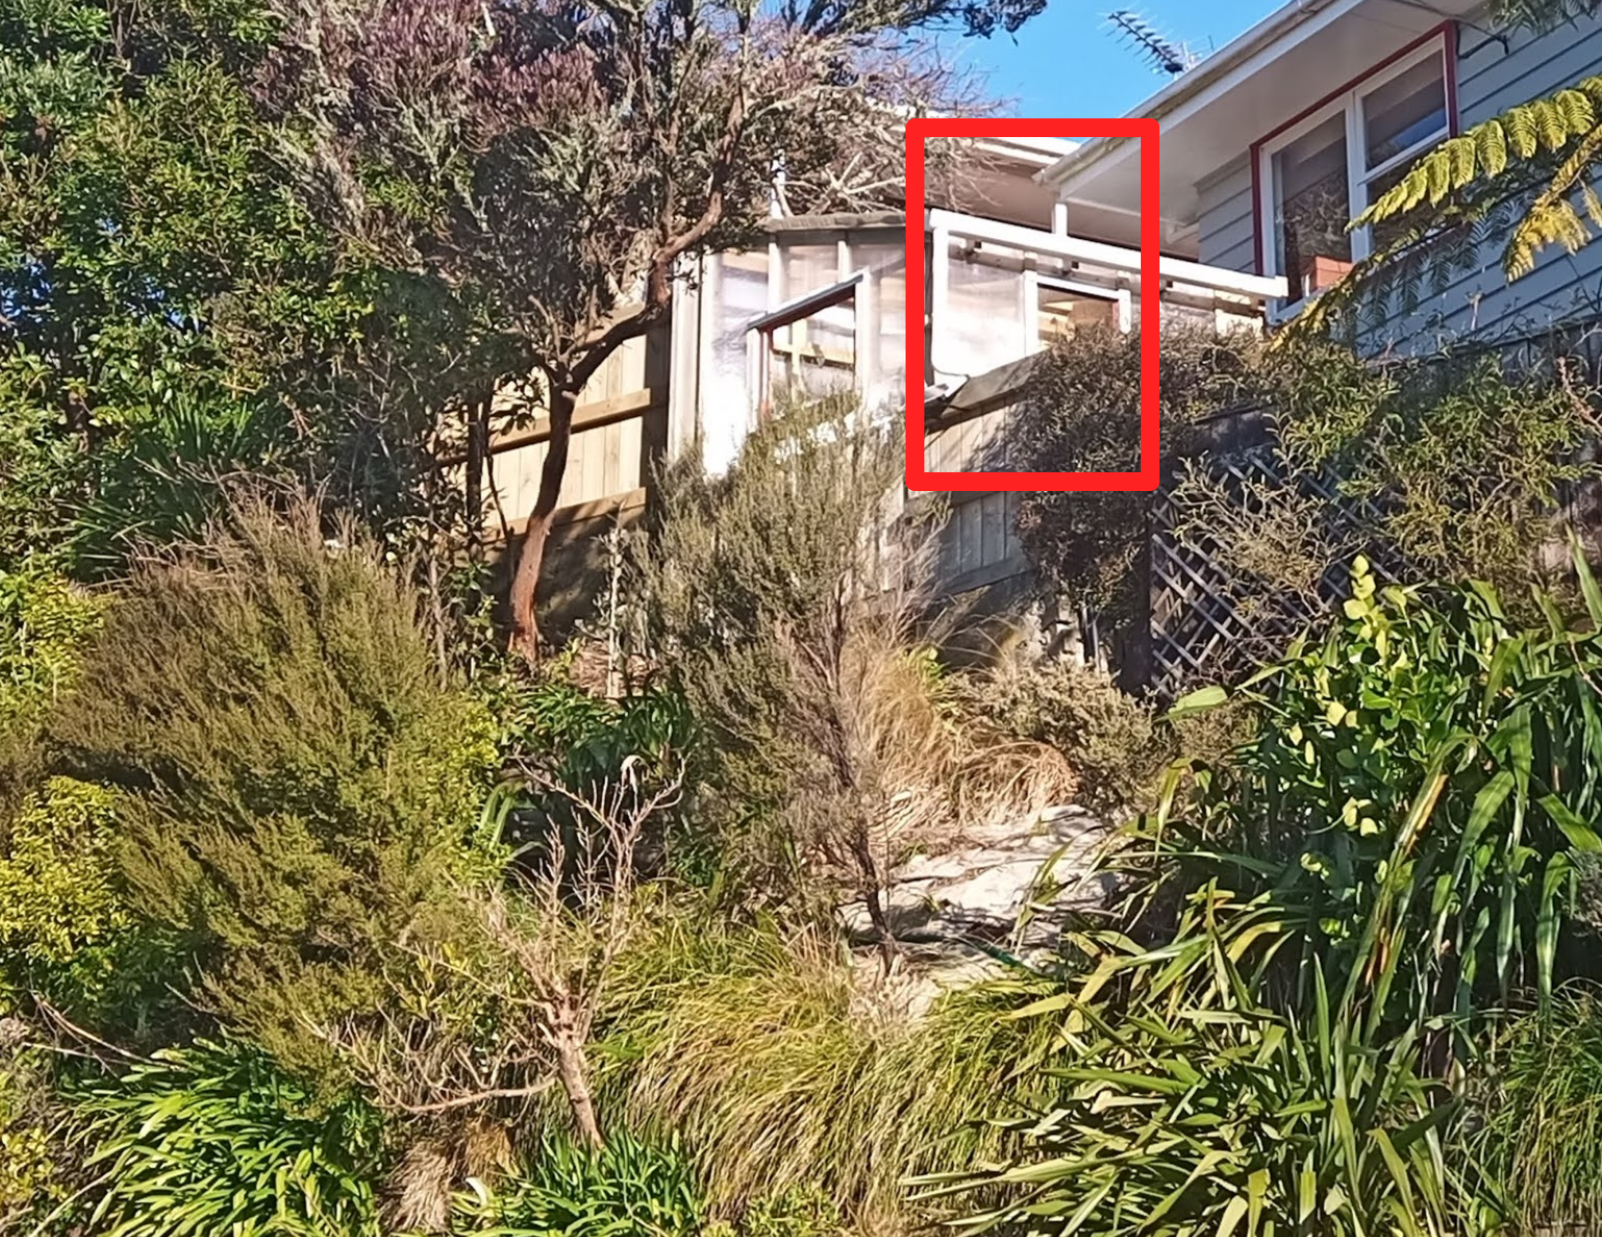
The images below show the location for installation:
![]()
Figure 1: Turbine install location, looking out over the valley ![]()
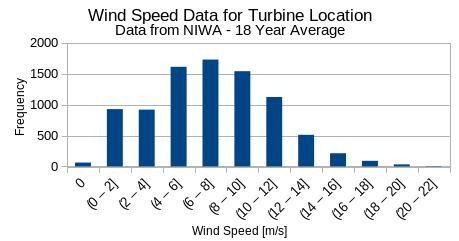
Figure 2: Turbine install location Analysis of the wind resource in this location couldn't be completed in detail, so NIWA data has been used for the local area to estimate an average windspeed. This analysis showed that the average windspeed is approximately 7m/s,
![]()
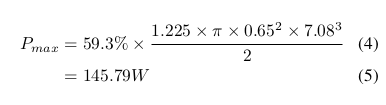
Figure 3: Local windspeed distribution (From NIWA) Figure 4: Calculation of maximum power available (Based on the Betz limi With this average windspeed analysis completed, the theoretical absolute maximum power output was calculated as 145W (Figure 4). This is significantly more than the greenhouse would need to operate, which is good as the turbine is unlikely to achieve a higher output than 50%-60% of this figure due to losses in the system.
Once I had a model for rough local wind behaviour, I selected a range of airfoils designed for small wind turbines, and airfoils that have been recommended for small wind turbines. For further detail on airfoil selection, refer to the full report, pages 5-6.
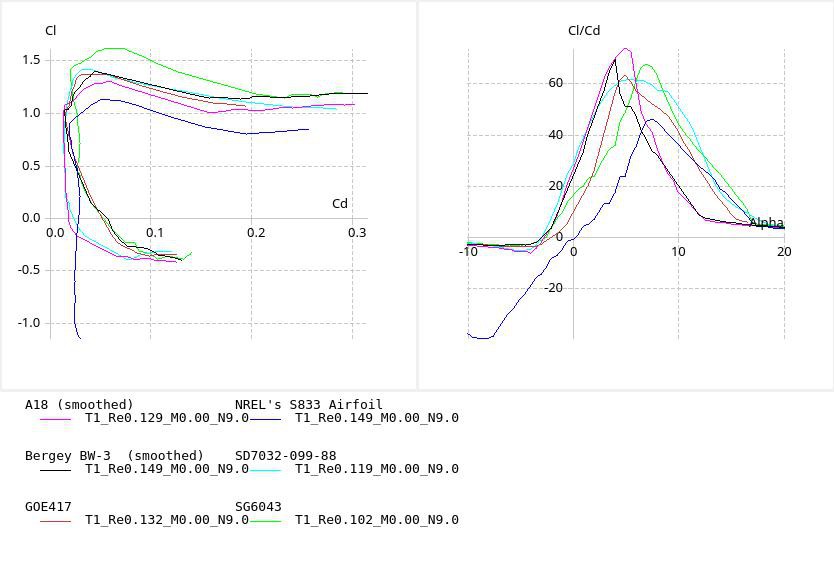
Figure 5: Catalog of airfoils to be analysed. Screencap from my "Blade Design Report" Each of these airfoils has been recommended as a turbine airfoil, however it was not feasible to fabricate a blade with each to test. Therefore a simulation package called QBlade was utilised to produce drag polars and glide coefficient vs angle of attack plots for each airfoil. These results are shown in Figure 6.
![]()
Figure 6: Drag polars for each selected airfoil The first plot is referred to as a drag polar. This plot shows a relationship between coefficient of lift (Cl) and coefficient of drag (Cd). In the literature there is discussion of a wide "drag bucket" being a desirable trait for turbine blades, which leads to an minimal drag coefficient over a wide range of conditions. For more on this see page 6-7 of my report.
Figure 7: Relevant blade terminology In the second plot, there is a more useful representation of airfoil behaviour. This plot shows how the glide ratio (Cl/Cd) changes with angle of attack (Alpha). Figure 7 shows how angle of attack is defined (for more detail see page 1 of my report). With these values in mind, the second plot shows for what range of relative wind vectors the blade will have maximum lift, and therefore produce maximum torque.
Airfoils with a high peak are good as they represent a larger lift output for the given windspeed. However, it is important to acknowledge the fact that a wide peak is almost as important. A wide peak means that the airfoil will have an optimal glide ratio (and therefore optimal lift) for a wider range of relative wind vectors. This is desirable, as the relative wind vector will change based on rotor velocity, which means that for varying windspeeds the turbine will have good energy output.
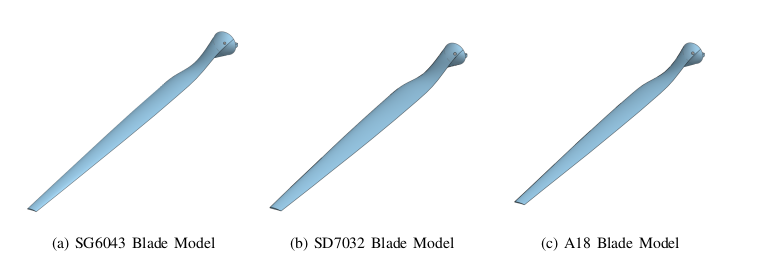
Figure 7: Airfoil models developed for testing Of the airfoils analysed, three were selected to be modelled into blades and fabricated. These are shown in Figure 7. Chord length and twist angles vary along the blade, as relative wind velocity and angle vary for varying rotation radius. A set of equations was found in the book Wind Energy Explained (Referenced in my report). These equations give relative wind angle and chord length for a given distance from the center of the rotor. An excel spreadhseet was developed to calculate these parameters for 10 sections evenly spaced along the blade.
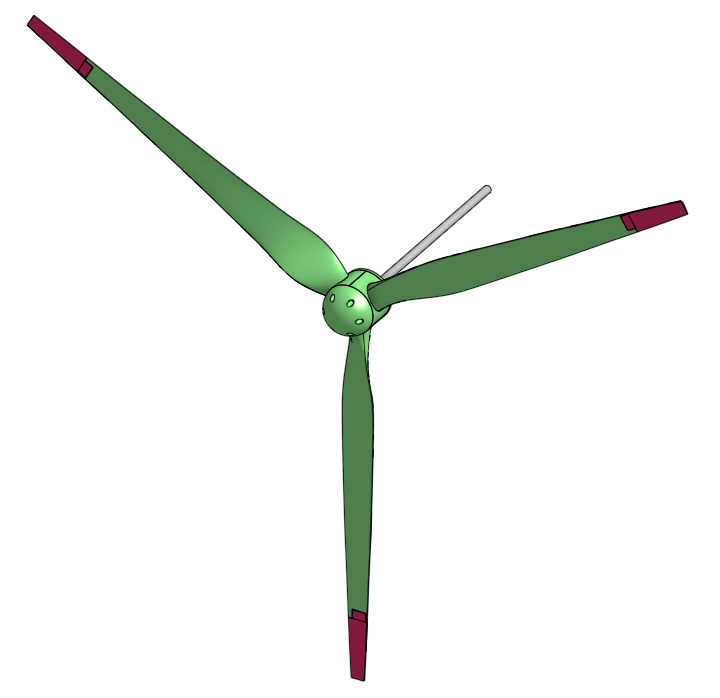
Blades were designed to be screwed into a rotor hub, which was designed to be reused in each blade test. This involved a system of securely bolting blades to the hub in a way that allowed them to be safely removed at a later date. Figure 8 shows blades connected to this rotor hub in the OnShape model (linked on the main project page). Details on this rotor hub can be found in the Integration Report.
Figure 8: Blades attached to rotor hub With that, the blades were ready for testing. Check out my next log for details on testing the turbine, and the problems I have had.
Cheers!
Scooterbine: The Next Chapter
Renewable energy from unwanted, unloved motors, and a mean scooter.