mihai.cuciuc
-
Pomelo on Crowd Supply
01/30/2025 at 05:33 • 0 commentsPomelo will be launching on Crowd Supply where you can subscribe to be notified when it's ready: https://www.crowdsupply.com/pomelo-instrumentation/pomelo
The business side of things is a very new topic to me, and it's full of challenges. But what I did not expect was that, since I'm super passionate about building this detector and sharing it with the community, I seem to enjoy most of these challenges.
-
Theremino MCA
08/02/2024 at 21:16 • 0 commentsPomelo is all about interfacing with as many things as possible. Theremino MCA is a popular open-source gamma spectroscopy software designed to work with DIY detectors. It relies on the PC’s sound card for digitizing pulses in order to build a spectrum.
Pomelo Core makes internal analog signals available on a pin header, mostly for debugging. Among these there is a low-pass filtered version of the SiPM output. Unfortunately, it’s still a bit too fast to be properly digitized by a PC sound card and while it does work, the results are a bit wonky. But if we slow it down a bit more using an RC low-pass filter, it becomes just right. I used 10 kOhm and 10 nF.
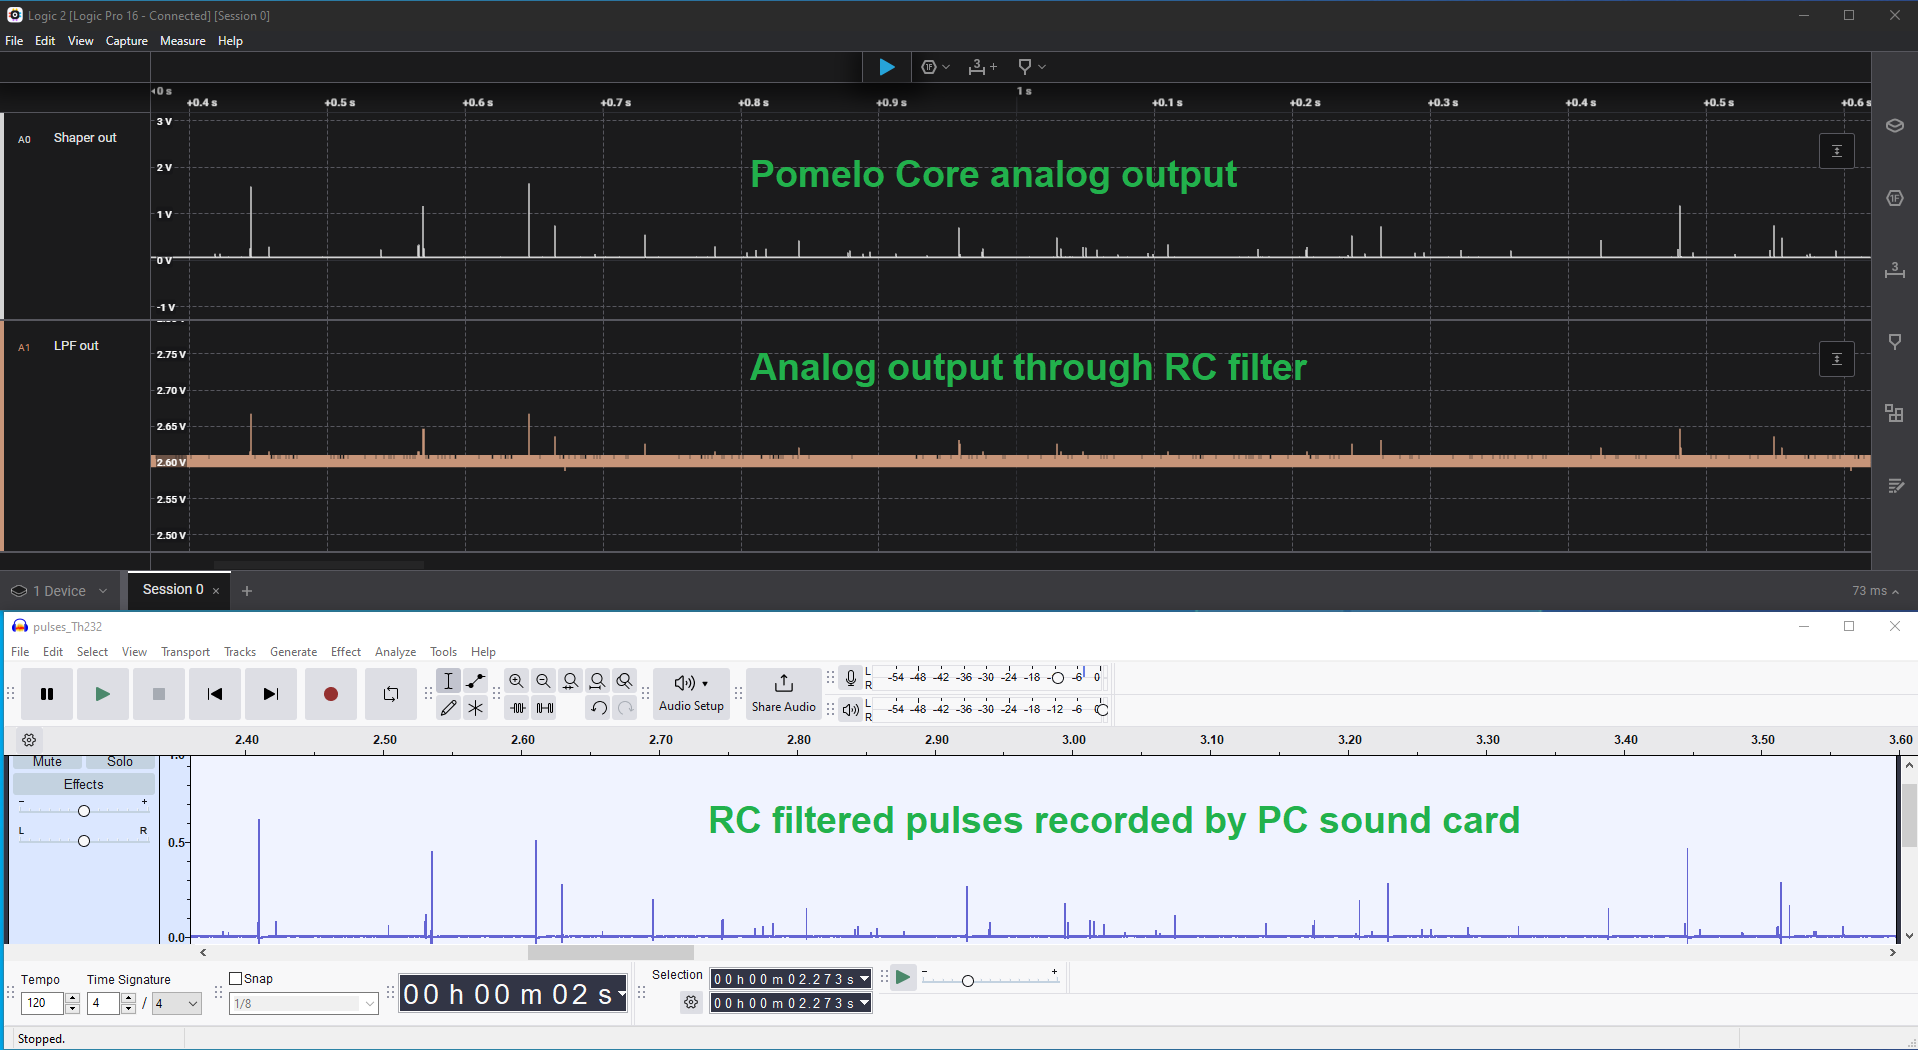
To get a feel for how well the pulse amplitudes match between the Pomelo Core output and the signal that is read by the sound card I grabbed some pulses both with a Saleae logic analyzer and with Audacity and manually aligned the time scales to look at the same pulses.
![]()
Pulses from a Th-232 source at different stages in the analog chain. The time scale is manually aligned to look at the same pulses in both Saleae Logic and Audacity.
![]()
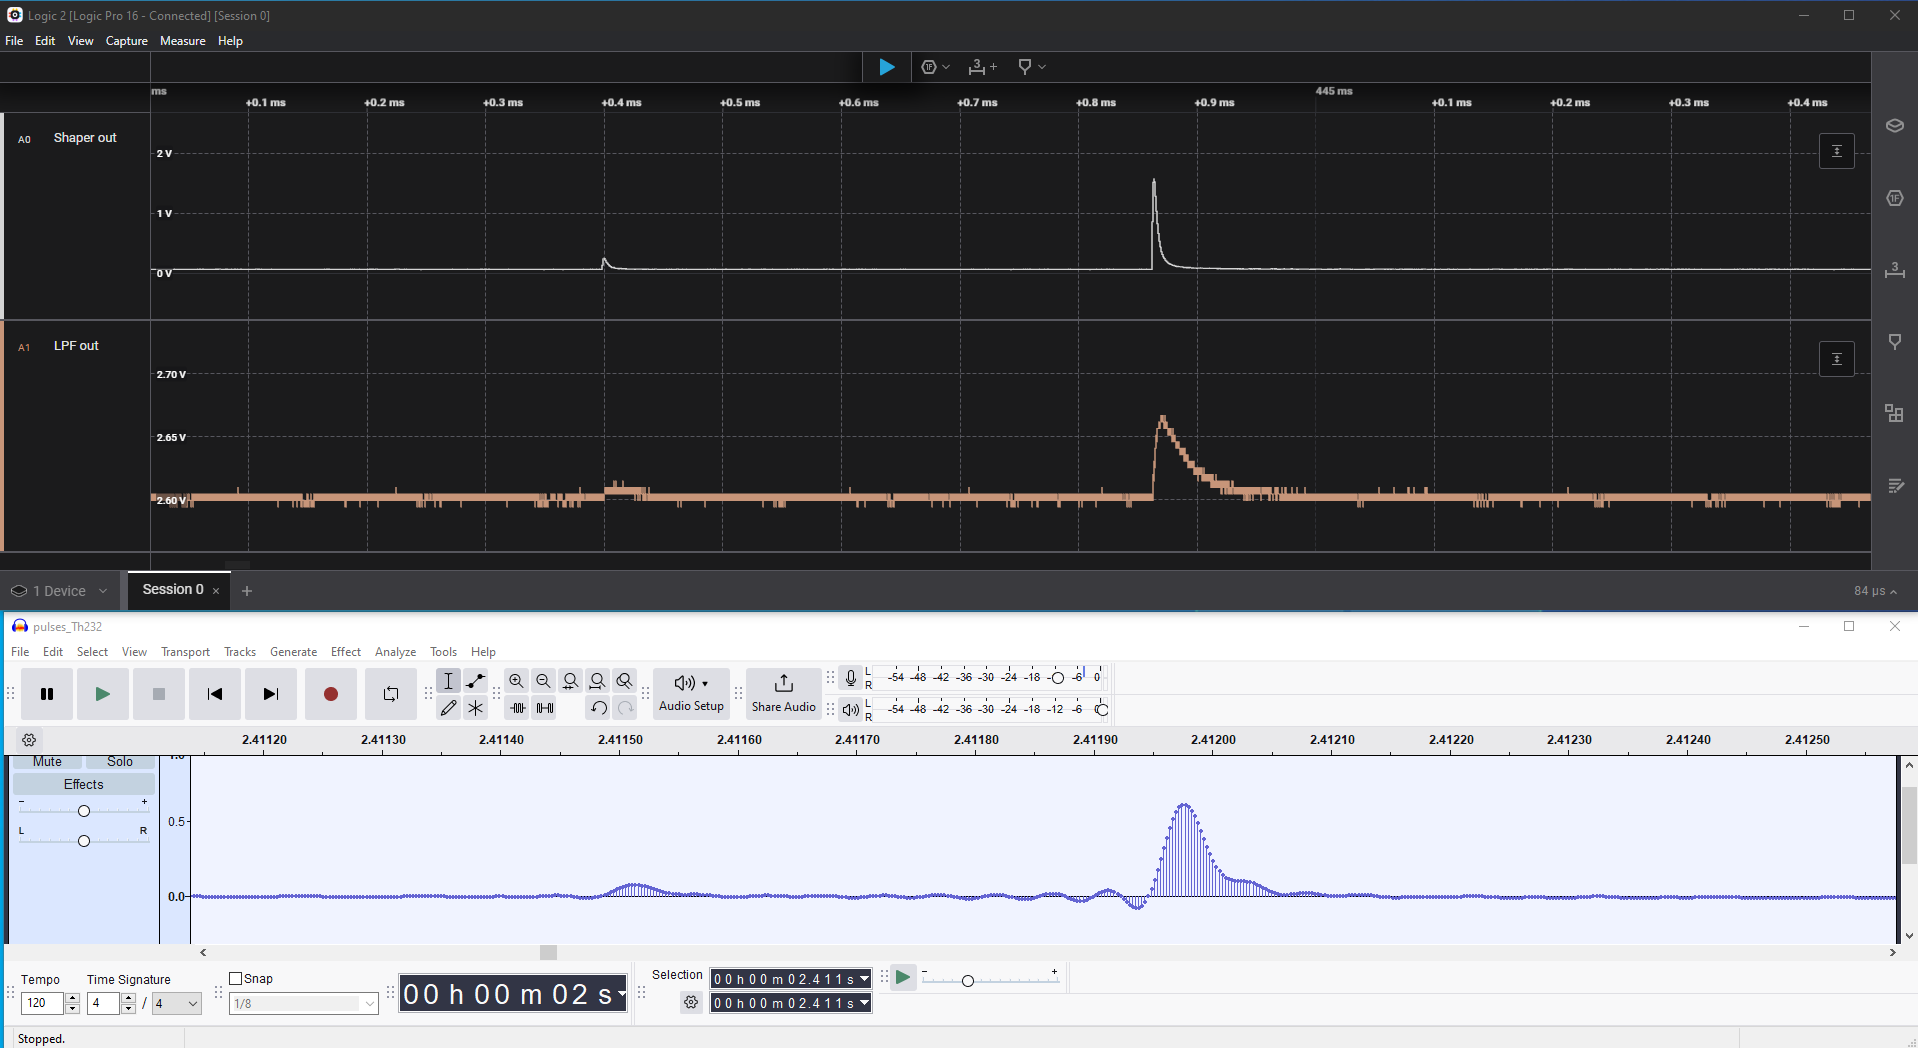
Same plot as above but zoomed in to see the shapes of individual pulses
The sound card is detecting pulses as being negative, despite the Pomelo output being positive. I inverted the waveform in Audacity to make things easier to see.
One thing to notice is that the RC filtered signal rides on a DC baseline of ~2.5V. This is due to the PC’s sound card providing bias for the microphone -- it’s not a huge problem for Pomelo, as its output is fed directly from a stiff source, an op-amp’s output. The 10 kOhm resistor nicely isolates these two.
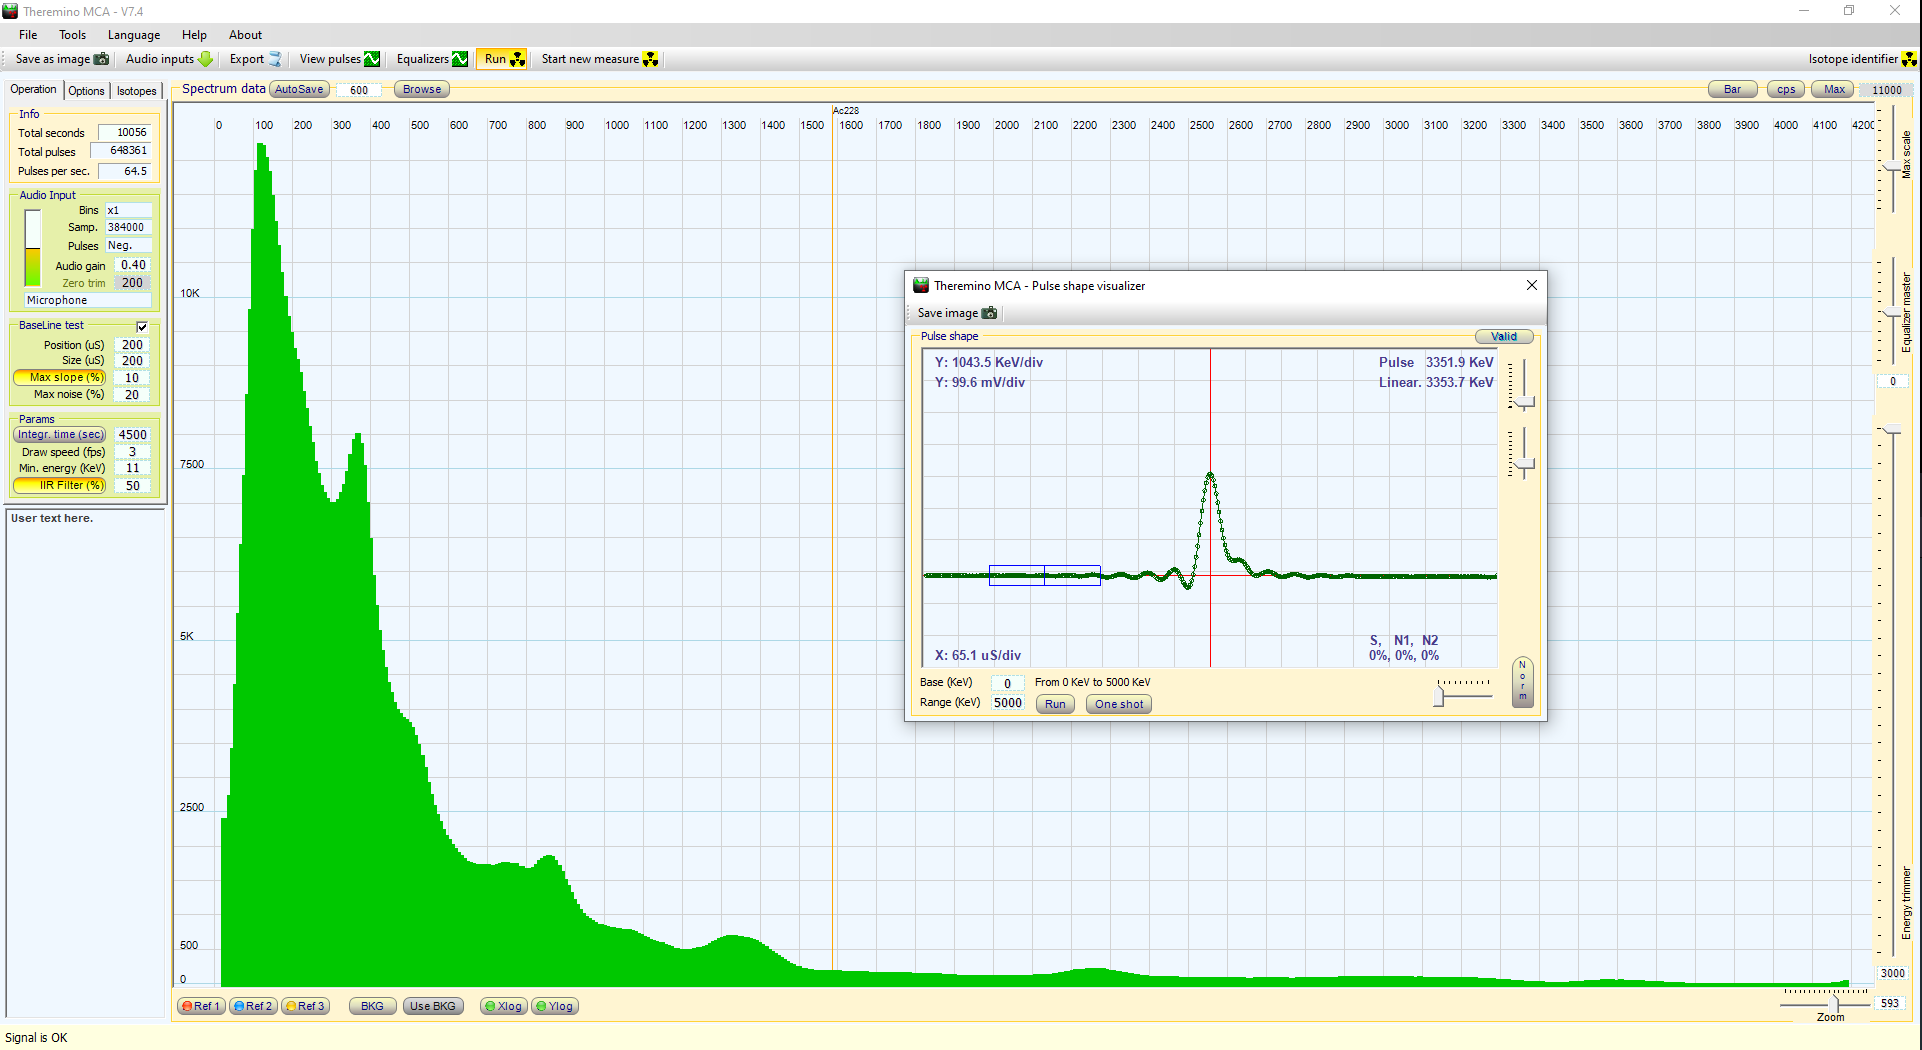
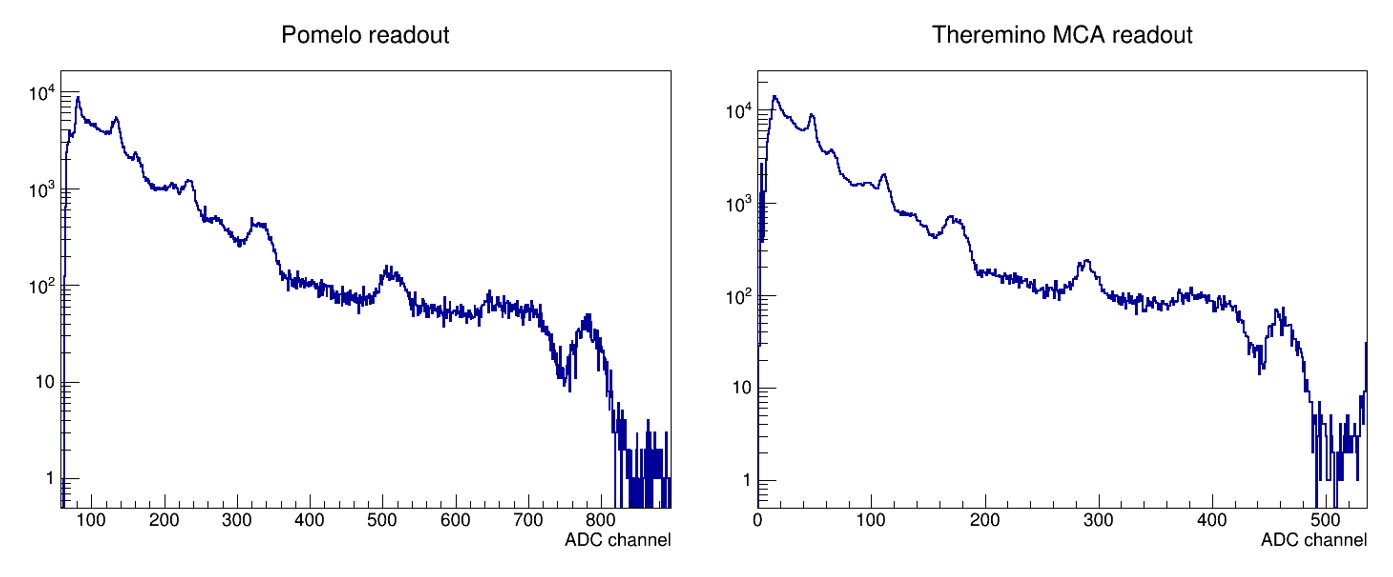
The spectrum of a Th-232 source looks very good both in the Theremino MCA software, as well as exported and displayed alongside the spectrum recorded by Pomelo Core.
![]()
Th-232 spectrum and individual pulse in the Theremino MCA software
![]()
Spectra taken with both Pomelo Core as well as with Theremino MCA, with uncalibrated x axes scaled to cover the same energy range
-
Pomelo core in coincidence mode
07/15/2024 at 04:18 • 0 commentsI used a pair of modules are run in coincidence mode to detect and measure cosmic muons.
-
Pomelo Core new use case
06/21/2024 at 04:28 • 0 commentsI added a new project describing an experiment that uses Pomelo to measure gamma attenuation in aluminum. The result is surprisingly close to the literature value.
-
Updated scintillator and wide range energy linearity
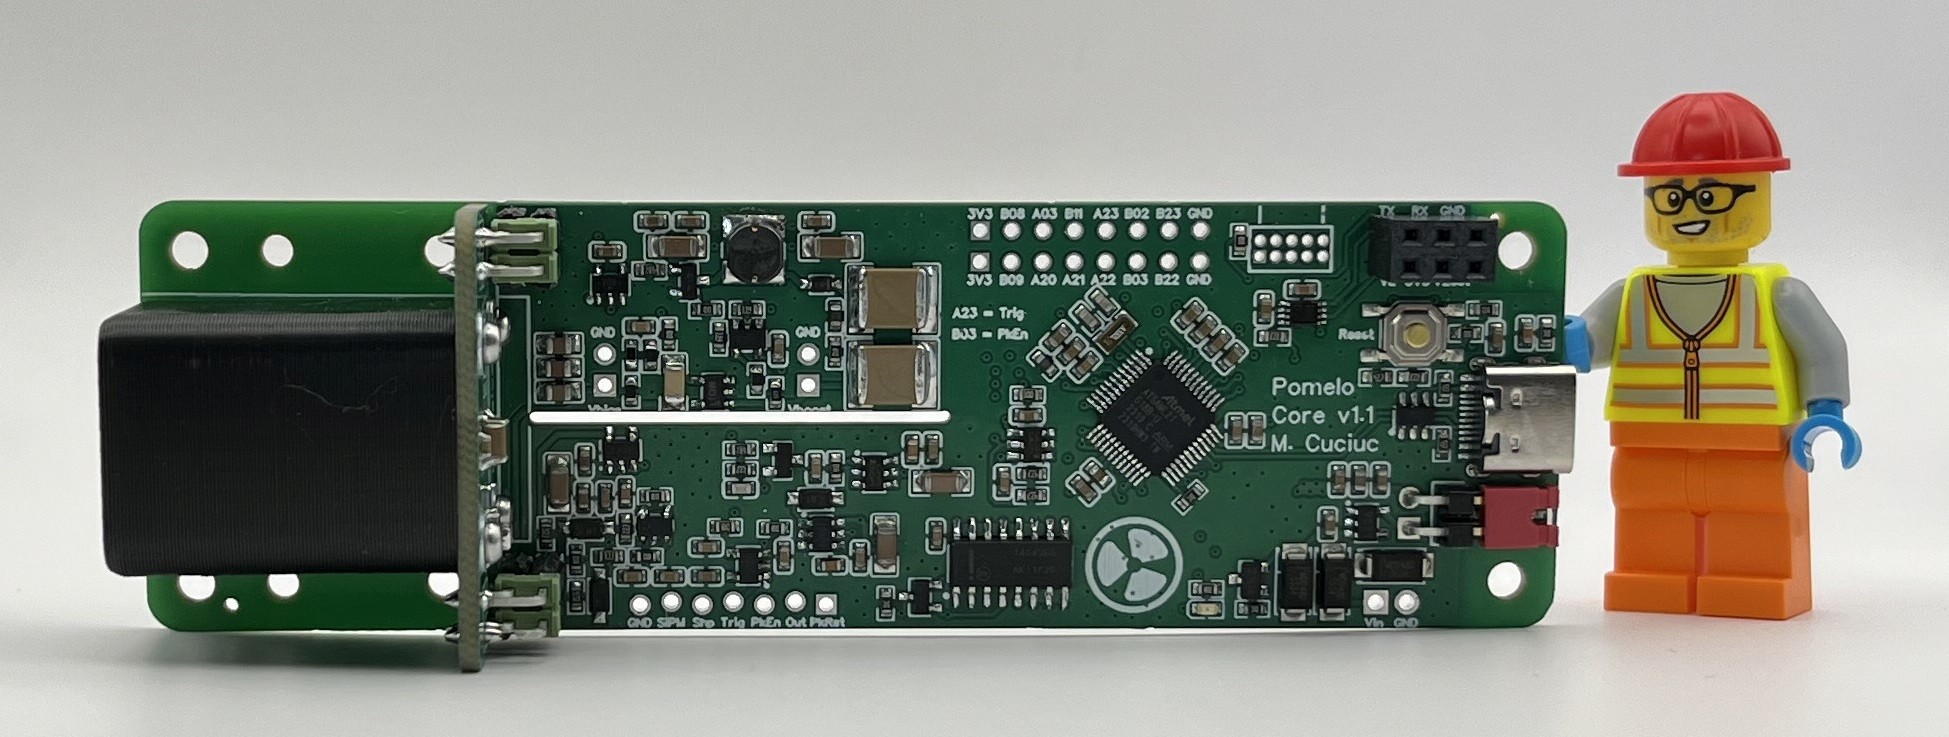
06/17/2024 at 16:15 • 0 comments![]()
Pomelo sales rep showing off the latest prototype sporting a 10mm x 10mm x 20mm CsI(Tl) crystal
I designed the device dimensions with a 2cc (10mm x 10mm x 20mm) CsI(Tl) scintillator in mind, but only had 3cc ones to test with. It’s why the detector element extended beyond the device’s edge, but now that the 2cc crystals arrived, I can share the final design and some preliminary performance plots.
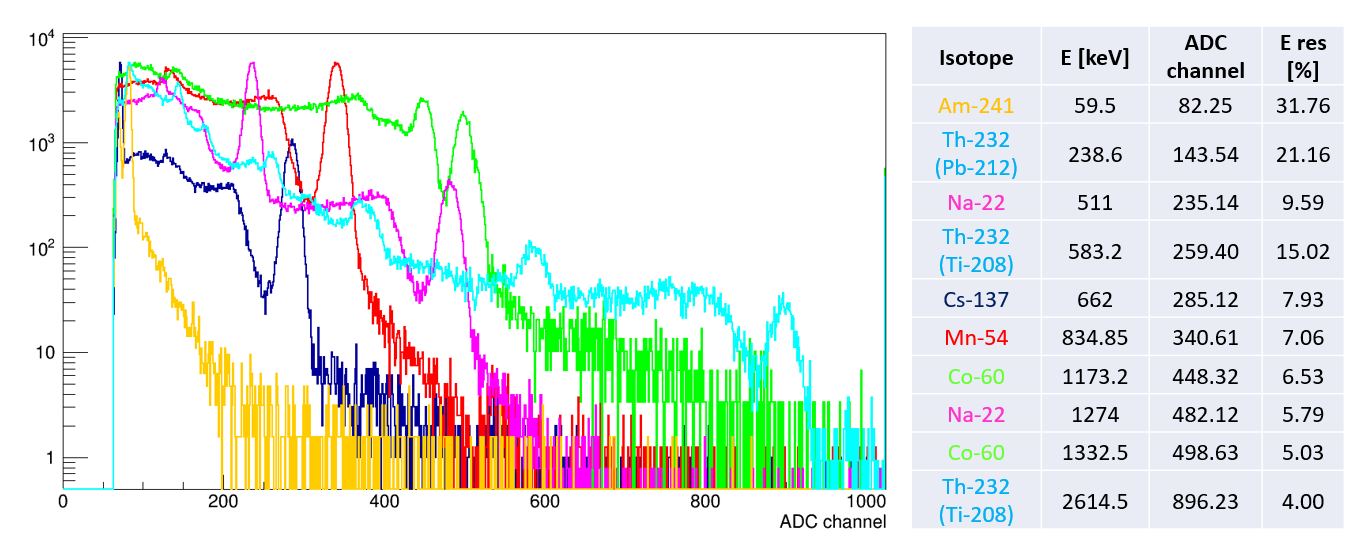
The scintillator is not yet potted in silicone, which does decrease light output a little (and thus worsens resolution). I took spectra with several lab sources and computed the resolutions for every gamma line and checked the detector linearity.
![]()
Spectra for Am-241, Na-22, Cs-137, Mn-54, Co-60, and Th-232 on the same plot in logarithmic scale. Energy resolutions for each energy shown in the last column
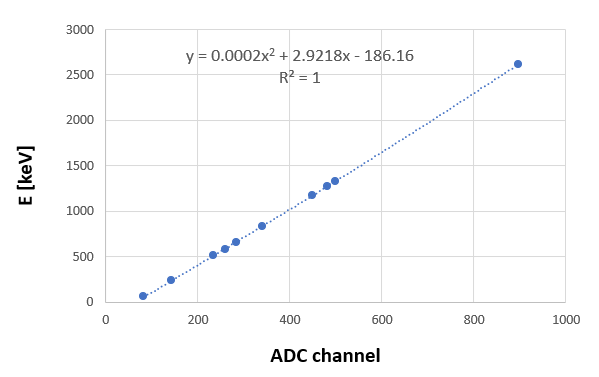
![]()
Detector linearity plot. There is a small quadratic term that is typical of SiPMs
-
Pomelo Core use cases
06/01/2024 at 09:44 • 0 commentsI updated the project description to include use cases for the Pomelo. One is a complete hand-held instrument with battery, user interface, and lots of connectivity, and others are physics experiments that are enabled by the Pomelo:
-
Pomelo Core v1
05/23/2024 at 04:54 • 0 comments![]()
This contains all the functionality to do gamma spectroscopy and nothing more
I'm planning on producing something that looks more similar to other gamma detectors, like the excellent products that are already out there: the Radiacode, the Kromek Sigma25, or the CapeScint CsI-MacroPixel-MCA. To shift towards that I merged the digital and analog electronics into a single PCB, removing the battery and charging circuit, as these are not core to the functionality of the detector. The detector now consists of two parts:
Pomelo Physics:
- CsI(Tl) scintillator, 3cm^3
- Silicon photomultiplier
- 3D printed dark box to house scintillator and keep stray light away from SiPM
- Temperature sensor
Pomelo Core:
- Digitally controlled SiPM bias supply ~32V - ~48V
- Low power analog front-end
- Microchip SAML21 (ARM Cortex-M0+) microcontroller
- USB connectivity
- UART connectivity with integrated level shifter
![]()
Pomelo Physics. Scintillator and SiPM detachable module
![]()
Back of Pomelo Core PCB
-
Scintillator potting
05/13/2024 at 04:48 • 0 commentsCsI(Tl) scintillators are slightly hygroscopic – they absorb some moisture and this affects their crystal structure, worsening their performances. However, the magnitude of this worsening is very small as shown by this paper and this paper.
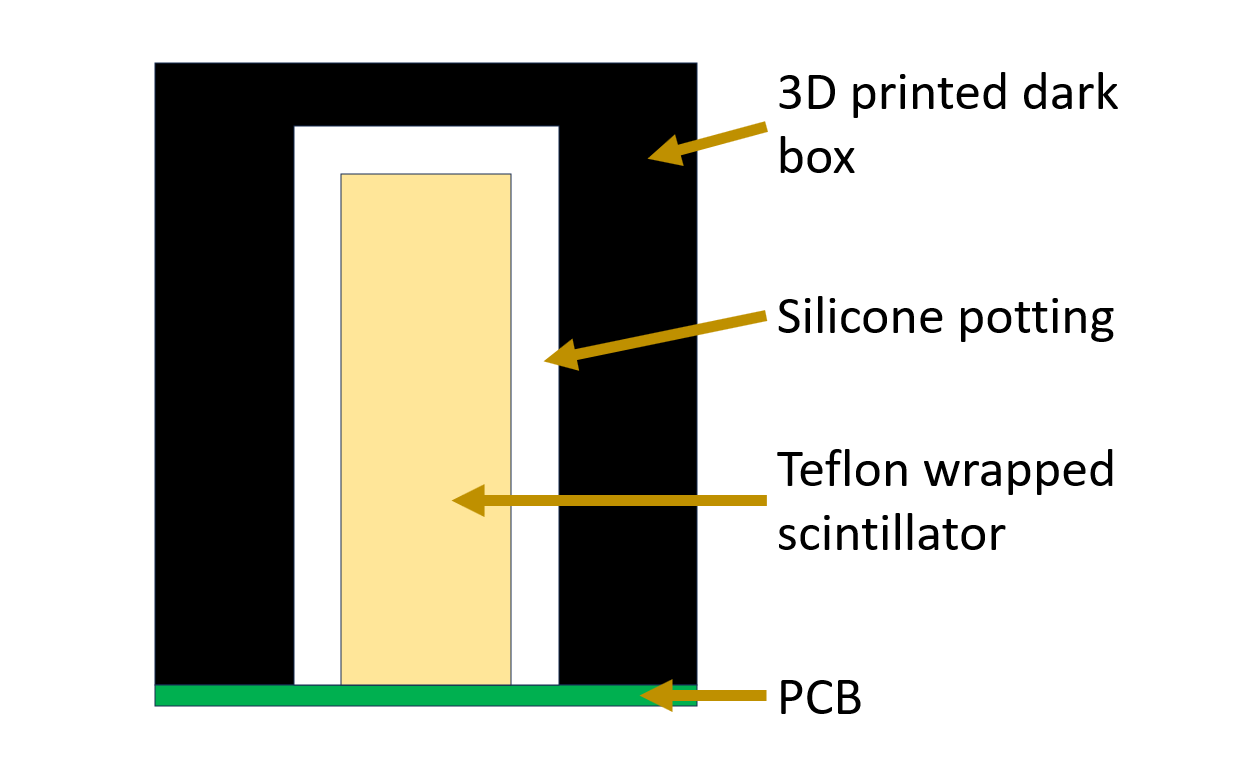
In any case, my plan is to limit the amount of moisture that can reach the scintillator by adding silicone in between the Teflon-wrapped scintillator and the 3D printed detector case that serves as a dark box. Using a somewhat rubbery silicone will also work to provide some cozy mechanical support for the scintillator. The resulting internal structure of the detector assembly should look like the following diagram:
![]()
Detector assembly structure. The scintillator is attached to the SiPM (not shown) that is soldered to the PCB. I plan on filling the gap between scintillator and dark box with silicone
Room-temperature vulcanizing silicone curing test
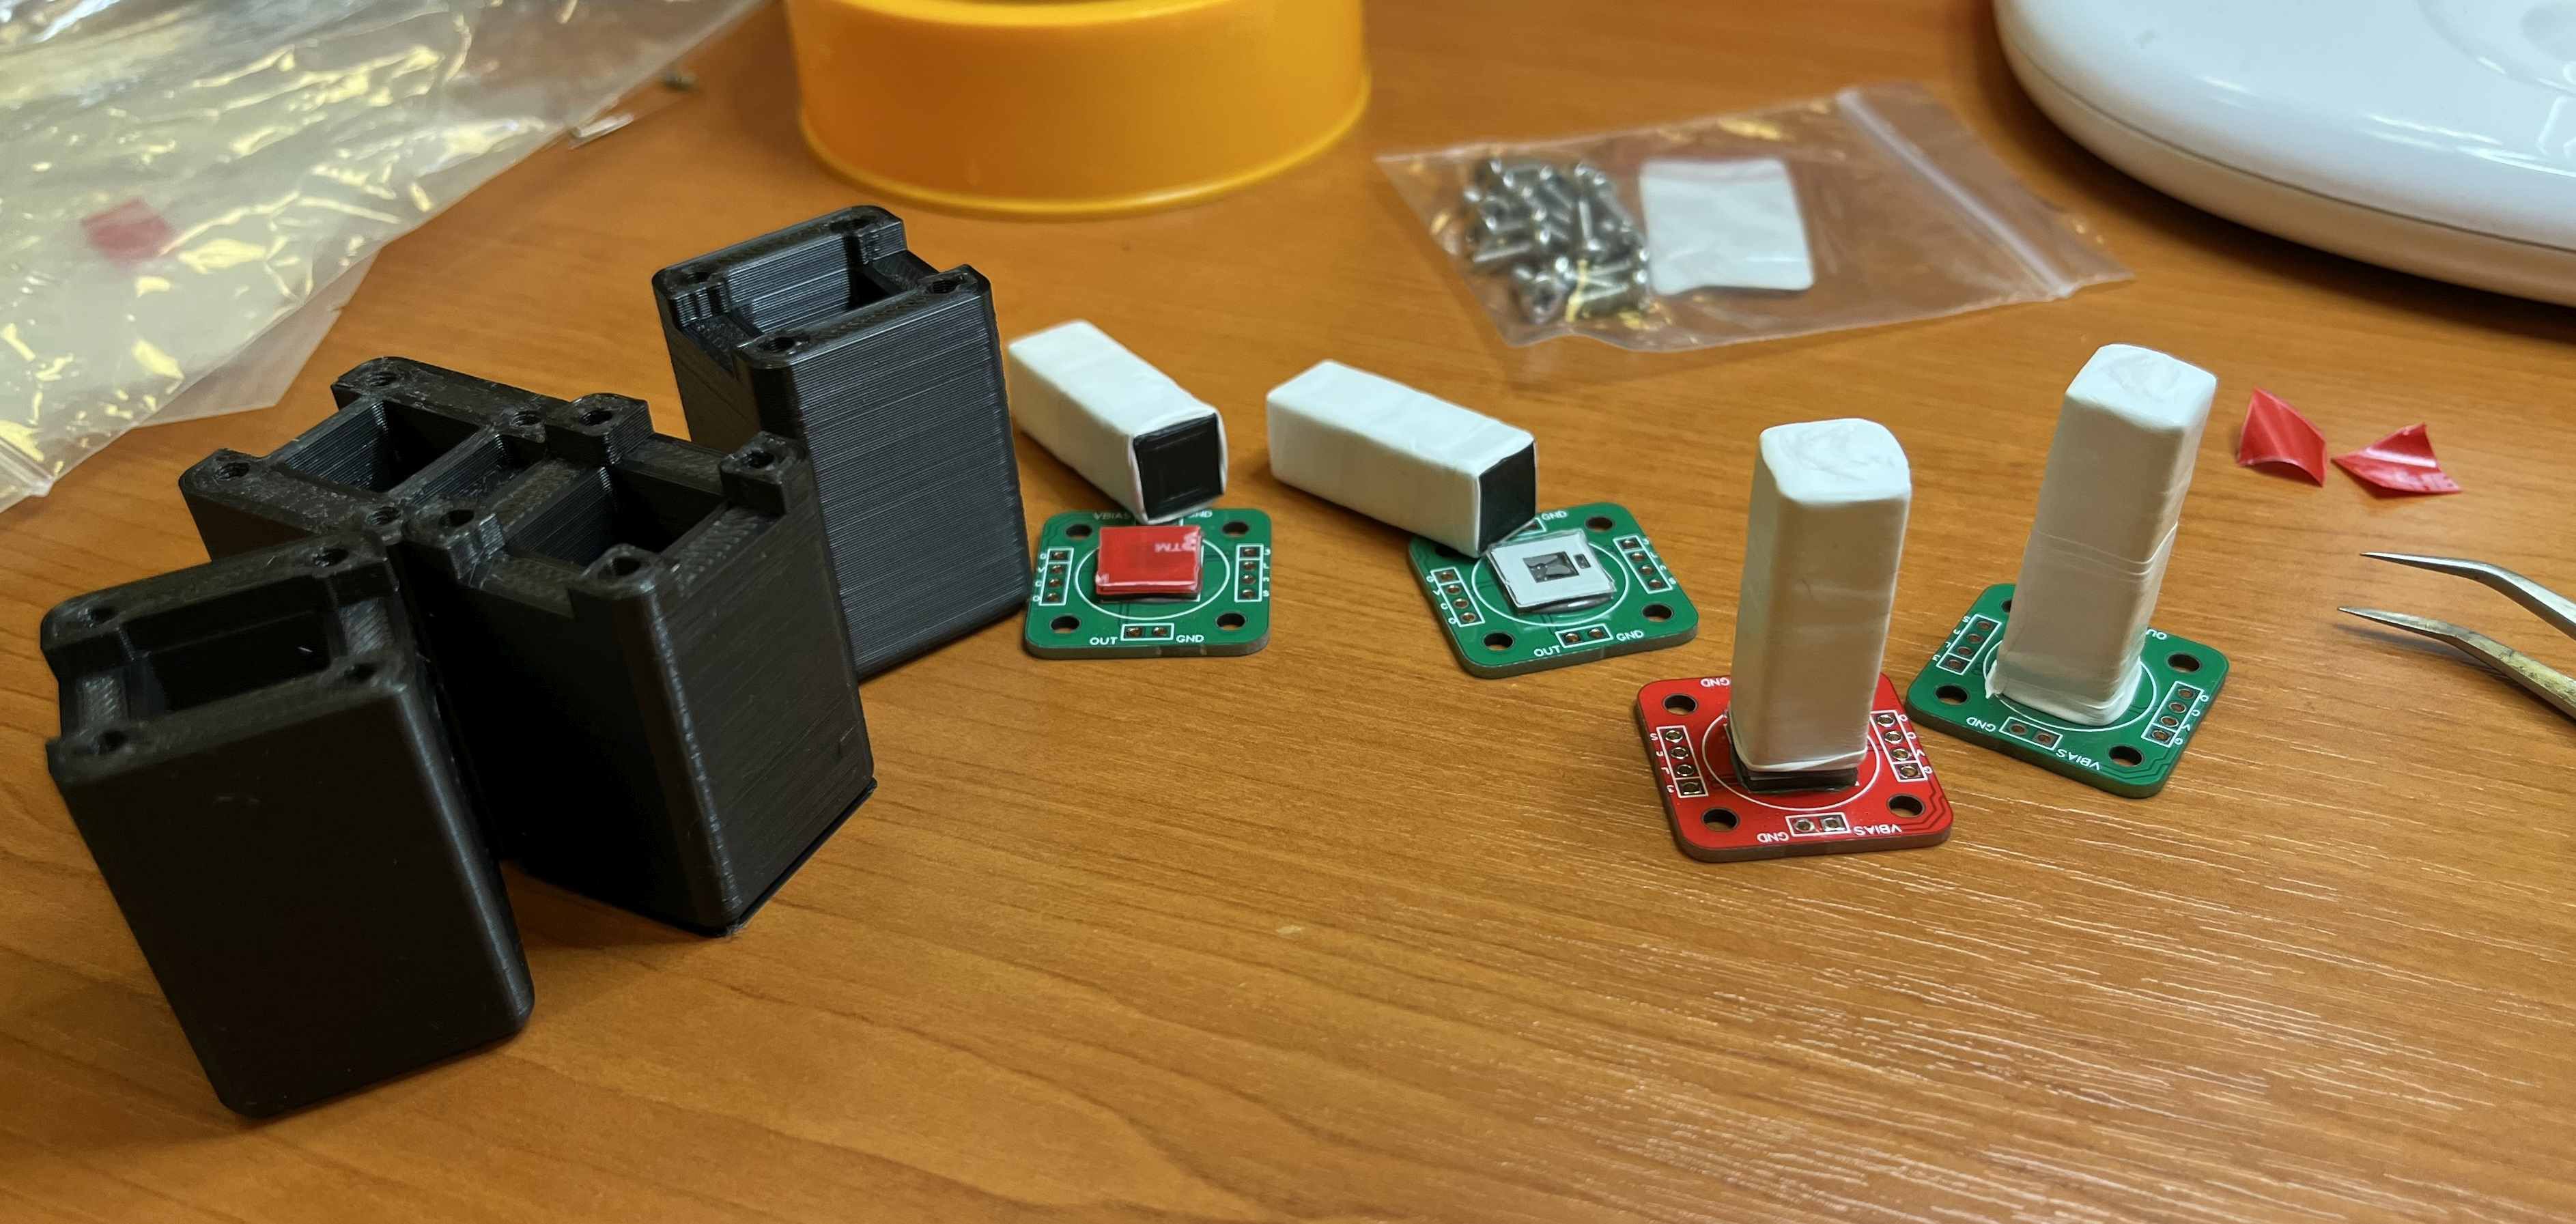
As I’m using a one-component RTV silicone I wanted to make sure that curing still happens inside the 3D printed box, as the exposure to outside air is quite limited in that case. To test this I printed a fake “scintillator” block that I wrapped in Teflon and I made a few test runs that I could then break and look inside for how the curing went.
![]()
Test pieces for testing potting and curing. No expensive components (SiPM or CsI(Tl) crystals) were hurt in these tests
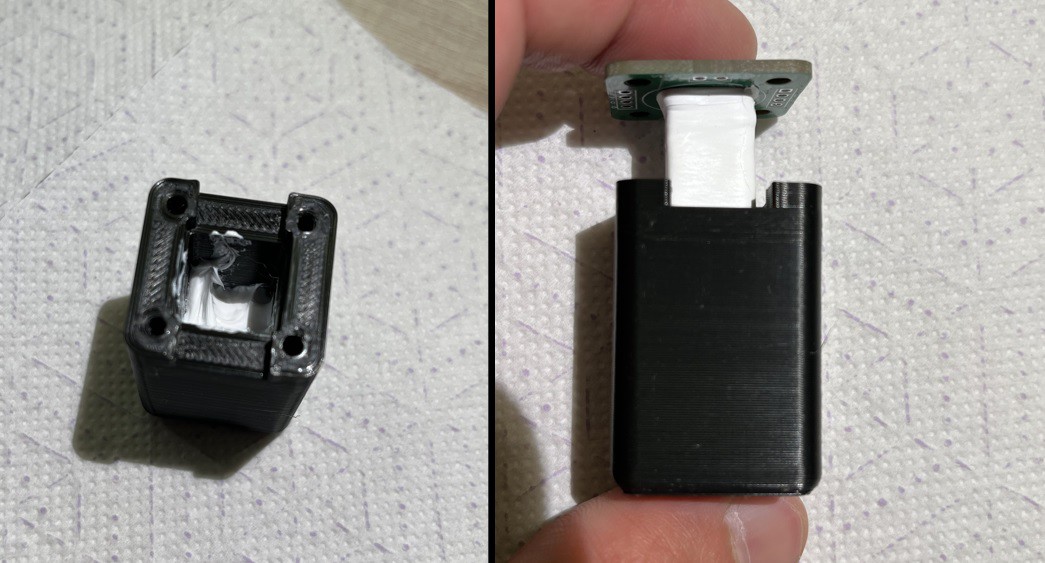
![]()
Loading some silicone into the dark box and then squishing the assembly in
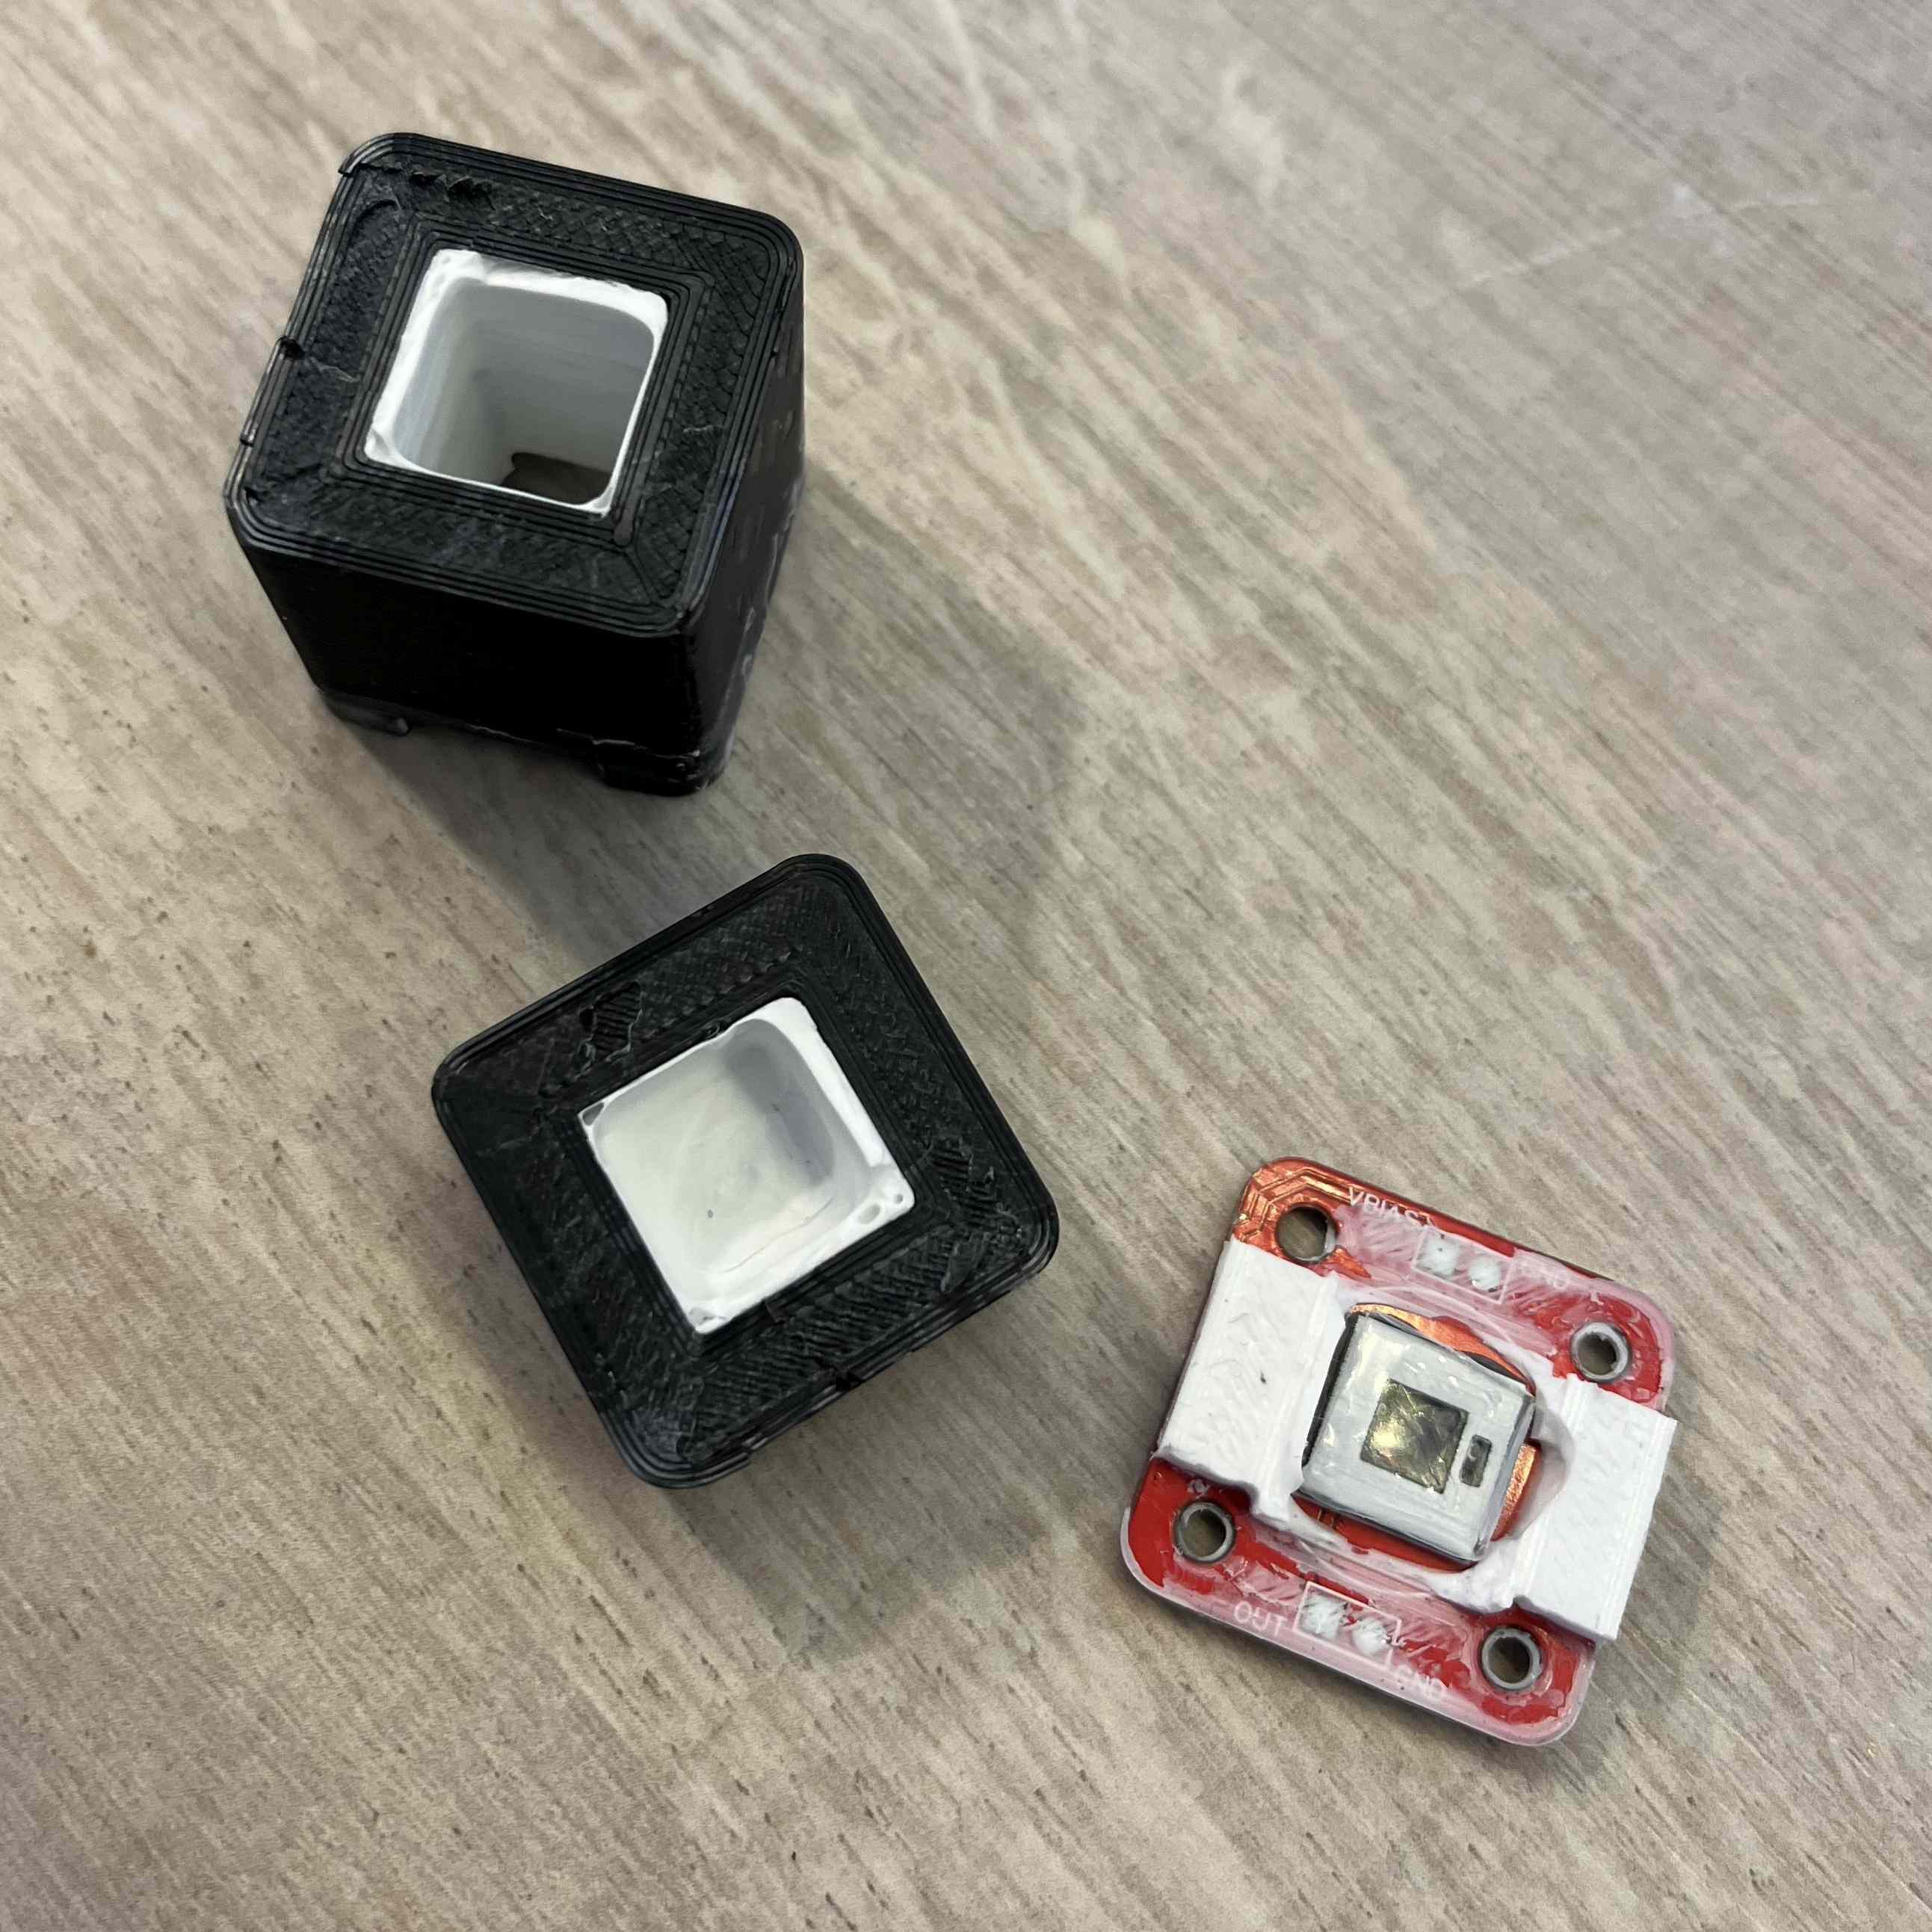
Having assembled these units I let them cure for ~1 week. I then broke a few and extracted the plastic fake “scintillator” and its Teflon wrapping to find this very nicely cured shell around the scintillator block.
![]()
Broken test assembly. The silicone cured nicely everywhere, but I did not manage to get it completely centred
One thing I did not consider is that the fake "scintillator" I 3D printed with ~30% infill was full of air. While it was covered in Teflon, I'm not sure this was an air-tight barrier, so some of the curing might have happened because of that empty space. In any case I assume that it will still cure just through the shell, even if it will take longer.
With this test successful I went on to pot an actual scintillator and see how this affects its performance.
Detector performance after curing
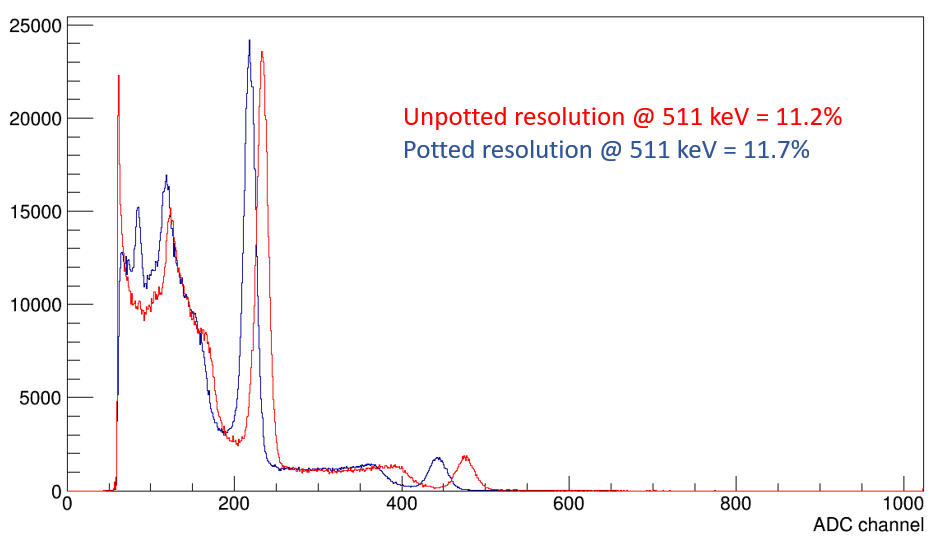
I potted a real detector and took Na-22 spectra before and afterwards to obtain the following spectra.
![]()
Na-22 spectrum and resolution for the 511 keV gamma line before silicone potting (red) and after potting (blue)
The peaks are shifted a little to the left after potting, so the pulse height is somewhat lower, suggesting that light collection is not as good as before potting. This is also indicated by the slight worsening of the energy resolution. While there is some loss in light that gets collected on the SiPM, the added resilience of the detector assembly is worth it.
-
Digital temperature compensation
05/09/2024 at 05:13 • 0 commentsThe gain of silicon photomultipliers (SiPMs) increases with applied voltage and decreases with temperature. Hamamatsu has an informative write-up on this topic.
This presents an opportunity to compensate for temperature changes by tuning the bias voltage, with some circuits doing this directly in hardware, by having a thermistor in the voltage feedback loop of the bias supply. An example of this is in Figure 8 in the MAX1932 datasheet.
I decided to go with a digital temperature sensor and tweak the bias voltage in firmware. The temperature sensor is placed directly underneath the SiPM on the detector PCB to get a reading as close as possible to the sensor.![]()
A TMP126 chip in the middle of the detector PCB provides very accurate temperature readings. The SiPM is directly underneath it, on the other side of the PCB.
I ran a few tests to see how temperature and bias voltage influence the spectra from a Na-22 source, with the following animated results.
![]()
Increasing temperature of the SiPM decreases its gain, so the gamma peaks shift to lower values in the spectrum. This can really mess up the long-term stability of the detector and make gamma peaks disappear into blobs. Temperature is in degrees Celsius.
![]()
Higher bias voltage increases the SiPM gain.
From this data I derived a voltage compensation coefficient and managed to keep the gain fairly stable, with a loop that runs every 5 seconds and updates the bias voltage. While it’s not great, it’s much better than without it.
![]()
Relative gain shift with fixed bias voltage (orange) and with a varying bias voltage calculated from the temperature value.
The difference that this makes is in keeping an overall better energy resolution for the system at varying temperatures.
![]()
Left plot has data taken between 29 and 40 degrees Celsius, without temperature compensation loop running. Plot on the right is taken between 24 and 40 degrees Celsius, but with the temperature compensation enabled and results in a better energy resolution.
-
ADC calibration
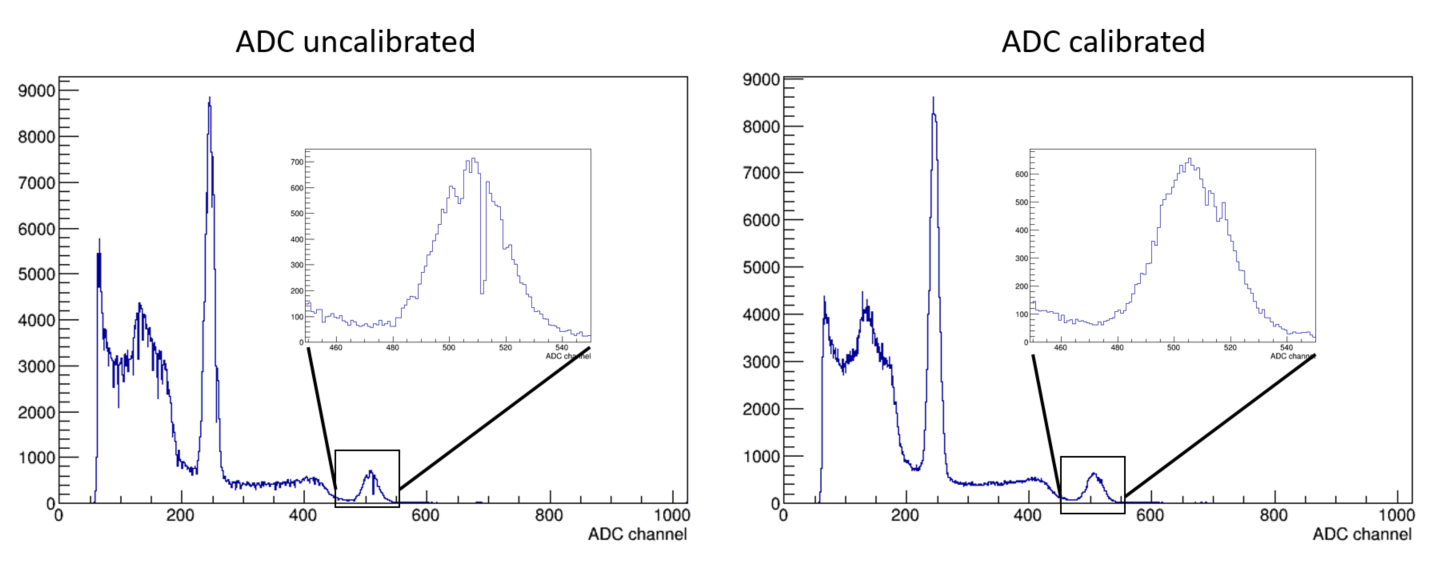
04/30/2024 at 05:15 • 0 comments![]()
Plot on the left shows Na-22 source spectrum without ADC calibration applied, with a zoom on on the 1274 keV peak. Plot on the right has ADC calibration applied.
Missing codes
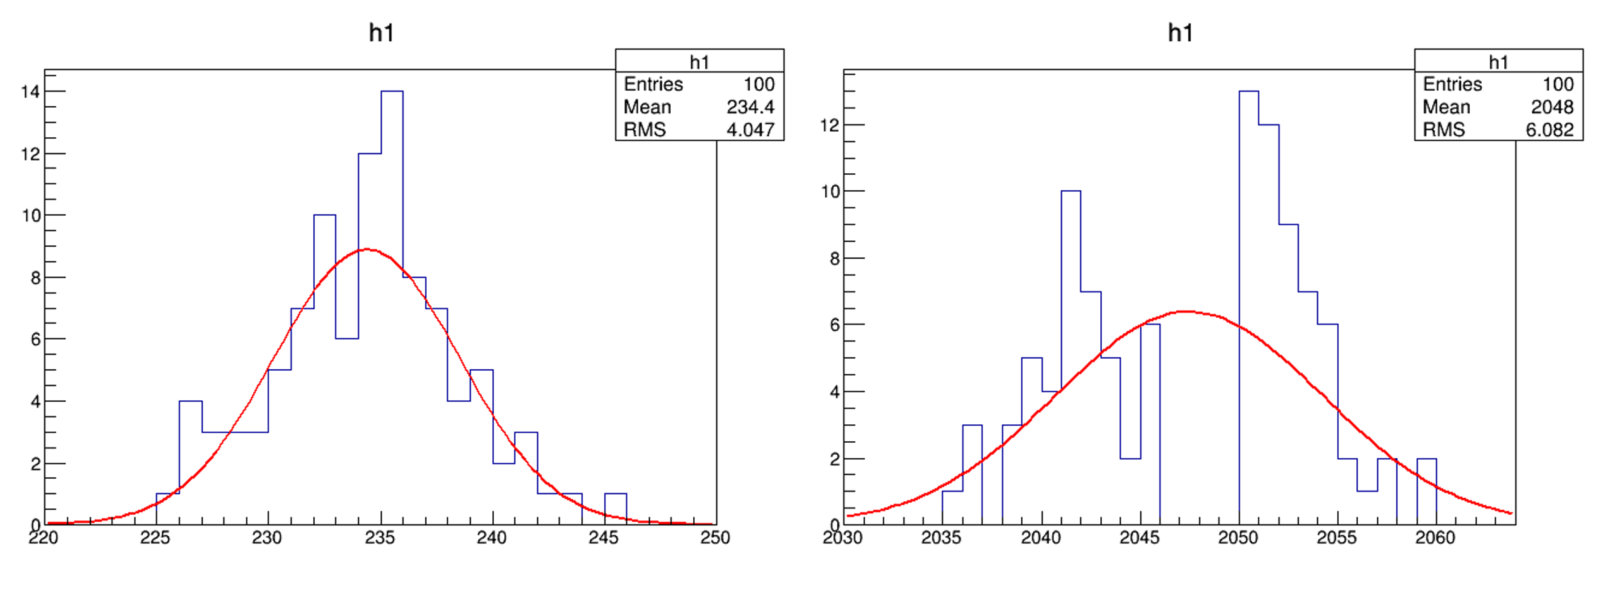
The 12-bit ADC in the SAML21 is great for most jobs. It can read voltages from tons of sources, has on-chip voltage references that it can use, and is reasonably accurate. But the ADC is quite stubborn in skipping some codes quite a lot. To test this, I generated some voltages with the DAC and took 100 measurements of them with the ADC. Most measurements look like the plot on the left in the following figure, with the measurements spread nicely around a center value. But in the middle of the ADC range is the worst culprit, with its plot on the right.
![]()
On the left is a histogram of some fixed voltage measurement with the ADC with a nice reasonable spread. On the right is a histogram of another fixed voltage, this time in the middle of the 12 bit ADC range. Four consecutive ADC codes are missing.
Mapping out the ADC response
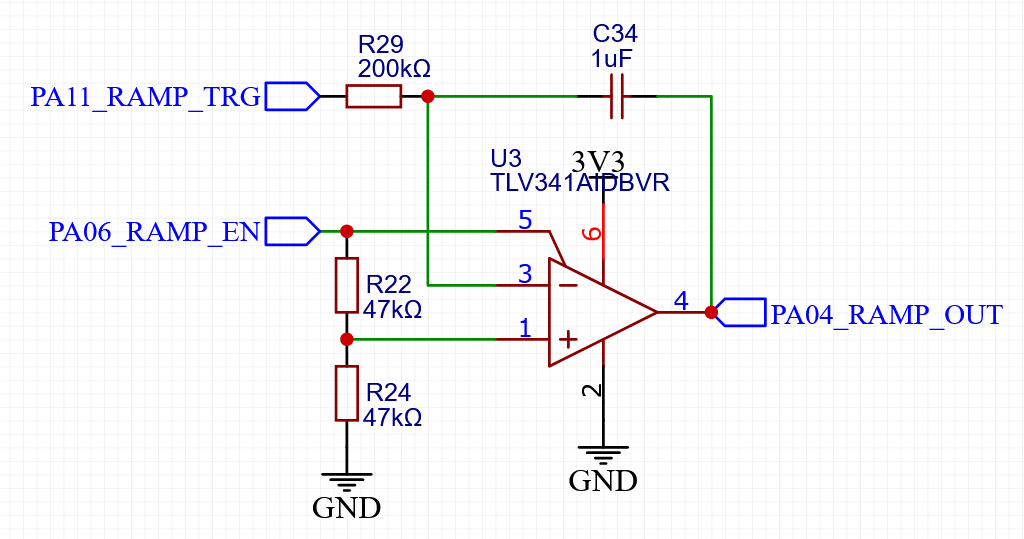
With much higher statistics you do get some counts in those codes eventually. But it’s not just those 4 codes in the middle that are underrepresented. I wanted to get a map of all underrepresented codes, but I did not trust that the DAC is perfect and didn’t want to mix the two imperfections. I decided to use a very slow ramp generator to swing across the ADC range while taking as many readings as possible. That should ideally produce a flat histogram. I also wanted my ramp generator to be simple enough to integrate on the PCB as part of a “self calibration” tool. I ended up with a very simple op-amp integrator.
![]()
Ramp generator for checking the ADC underrepresented codes. It can be completely disabled from the MCU to save power.
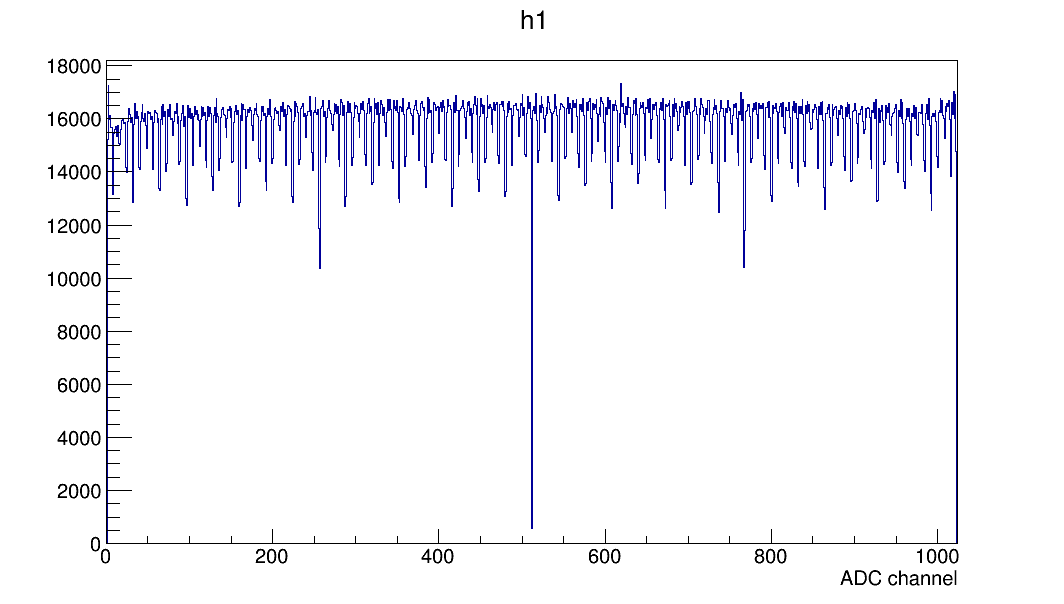
Taking a LOT of ADC data using the ramp generator produces the following histogram which shows the underrepresented bins. As I’m truncating my readings to 10 bits, now the troublesome middle of the ADC range is at bin 512.
![]()
Histogram of the ramp generator readings showing periodic underrepresented codes in the ADC.
Correcting for missing codes
This structure gets imprinted on the gamma spectra I gather and make them look unpretty. Realistically it’s not a huge problem, as the detector resolution is low enough that these structures can safely be ignored. It’s still obvious where the gamma peaks are even if there’s a gap right in the middle of one, as can be seen in the first plot at the beginning of this log. But I still want it fixed.
My first thought was to run some smoothing on the spectrum, with a moving average window. That did not work great as the dips were still visible, and it also started worsening the energy resolution of the measured peaks. Not cool.
Then I tried multiplying the gamma spectrum with the inverse of the calibration histogram. This did make the spectrum look pretty, but I did not like the thought of presenting an altered version of the histogram that the one I store in memory. Plus, since it involved integer division you could present a histogram that has a different integral than the total number of pulses you measured. Also not cool.
I wanted a solution that would work on an event-by-event basis -- whenever I have a measurement, place it in an appropriate bin such that the end result is a pretty histogram.
Calibrating the ADC - donor and acceptor bins
Whenever I get a gamma reading from the ADC I want to be able to quickly decide if I should place it in its corresponding histogram bin, or to give it away to one of the neighbouring bins to smooth out the resulting spectrum. Physics-wise this is not such a big deal -- each bin is ~2.5 keV, whereas the detector resolution is ~60 keV. So “misplacing” a reading a few bins left or right is ok.
For the rest of this section let's assume I just got a gamma ray measurement, and the ADC reading is 509.
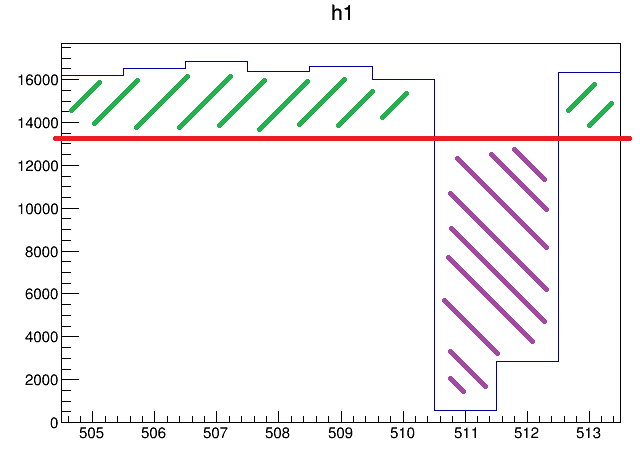
I look in the calibration histogram at 9 bins centered on the one corresponding to the measurement, shown in the following plot.
![]()
A slice of the calibration histogram that is used whenever the ADC takes the reading 509, to evaluate what to do with this measurement. Should I keep it in bin 509, or give it to a neighbouring one?
To decide where the current measurement (509) goes I first check if bin 509 in the calibration histogram is underrepresented, that is if its value is less than the local average of the 9 bins. The local average in the picture above is the red line. If the bin is underrepresented (not the case for bin 509), I always place the measurement in that bin – I don’t want to further deprive the already underrepresented bin of any counts.
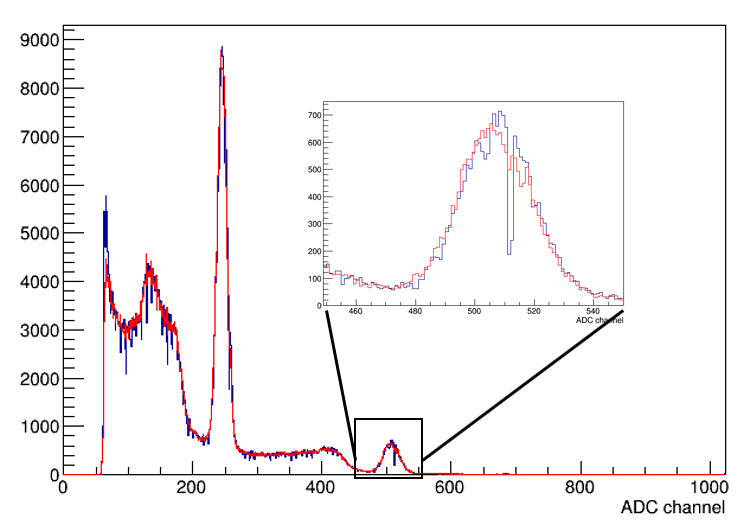
In this case, bin 509 is above the local average, so it is a donor bin – it will give some of its samples away. To compute the probability that it will give a sample away, I take the ratio of the green hashed part of bin 509 to the total height of the bin, so very roughly 20% in this case. Using a random number draw I decide to keep ~80% of the samples in bin 509 (I don’t want to over-deplete it), and I give ~20% of them away. If the random number said I should give it away, I use another random number draw to decide which neighbouring bin I should give it away to. Only the ones which are below the local average are eligible -- the purple hashed ones. Their probability to be acceptors is proportional to how badly they need it, so it’s more likely for the sample to end in bin 511 than in bin 512. Applied on a large enough number of samples, this algorithm should trim the green hashed bit in the plot and use that to fill in the holes in the purple hashed bit. All the probabilities I mentioned above are precomputed, so for each measurement the algorithm only has to draw one or two random numbers and make a few comparisons. But this does result in a HUGE calibration array that takes up 18 kB of program space.The following plot is an overlap of the first two plots in the log, showing that the energy resolution does not get significantly worsened by this form of weighted dithering.
![]()
Two datasets taken with a Na-22 source. Red plot is with ADC calibration applied, blue plot is without. Inset shows details on the 1274 keV peak.
Pomelo: Gamma Spectroscopy Module
A complete low-power gamma ray spectrometer that can be used by itself or integrated into other projects