 kutluhan_aktar
-
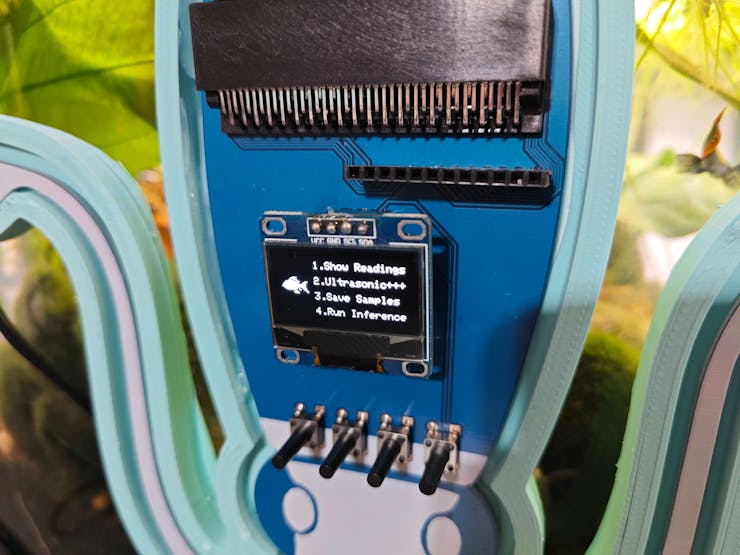
11Step 6.1: Displaying images on the SSD1306 OLED screen
#️⃣ To be able to display images (icons) on the SSD1306 OLED screen, first convert image files (PNG or JPG) to monochromatic bitmaps. Then, convert the generated bitmaps to compatible C data arrays. I decided to utilize LCD Assistant to create C data arrays.
#️⃣ After installing LCD Assistant, upload a monochromatic bitmap and select Vertical or Horizontal, depending on the screen type.
#️⃣ Then, save all the converted C data arrays to the logo.h file.
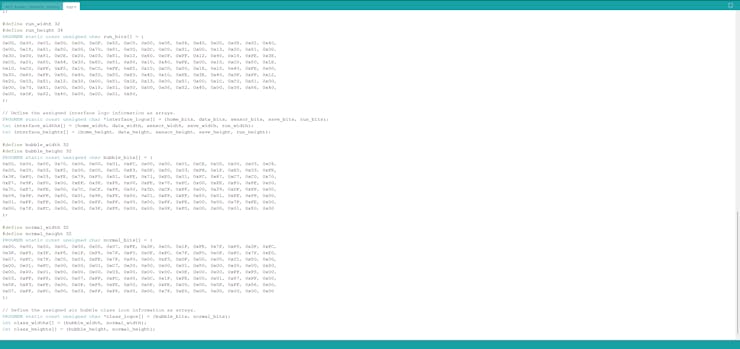
⭐ In the logo.h file, I defined multi-dimensional arrays to group the assigned logos (interface and class) and their sizes — width and height.
// Define the assigned interface logo information as arrays.PROGMEM static const unsigned char *interface_logos[] = {home_bits, data_bits, sensor_bits, save_bits, run_bits};int interface_widths[] = {home_width, data_width, sensor_width, save_width, run_width};int interface_heights[] = {home_height, data_height, sensor_height, save_height, run_height};// Define the assigned air bubble class icon information as arrays.PROGMEM static const unsigned char *class_logos[] = {bubble_bits, normal_bits};int class_widths[] = {bubble_width, normal_width};int class_heights[] = {bubble_height, normal_height};...display.drawBitmap(SCREEN_WIDTH-l_w, SCREEN_HEIGHT-l_h, interface_logos[menu_option], l_w, l_h, SSD1306_WHITE);![]()
![]()
![]()
-
12Step 7: Setting up UNIHIKER on MobaXterm & Thonny
Although UNIHIKER is an outstandingly compact single-board computer providing a built-in touchscreen, integrated Python modules, and a microcontroller coprocessor, I still needed to install the required Python modules and set up the necessary software before proceeding with the following steps.
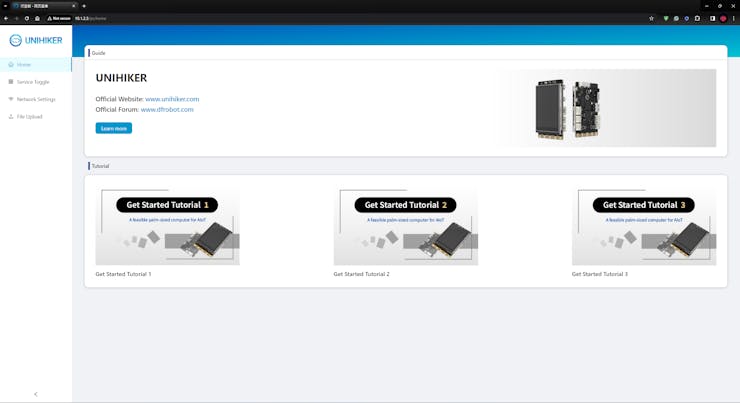
#️⃣ First of all, if you are a novice in programming with UNIHIKER, please visit the official tutorials and guidelines.
#️⃣ After connecting UNIHIKER to the computer via a USB Type-C cable, go to the home page of UNIHIKER's local web server via the default browser: 10.1.2.3.
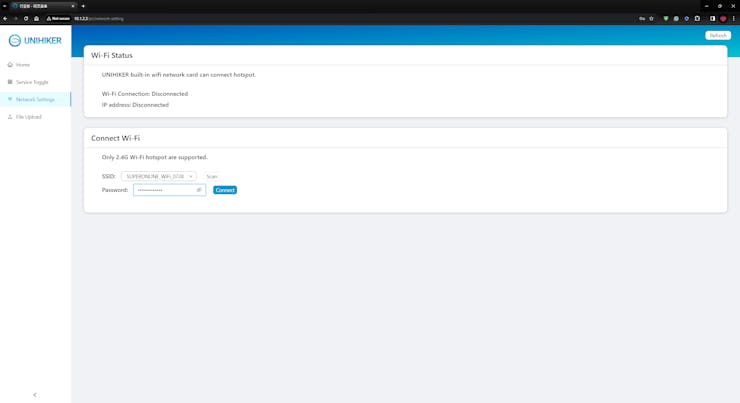
#️⃣ Then, navigate to Network Settings and establish the Wi-Fi connection.
![]()
![]()
![]()
#️⃣ Since it is necessary to utilize the terminal to install Python modules, but UNIHIKER does not allow the user to access the terminal via its onboard interface, I needed to connect to UNIHIKER remotely via SSH.
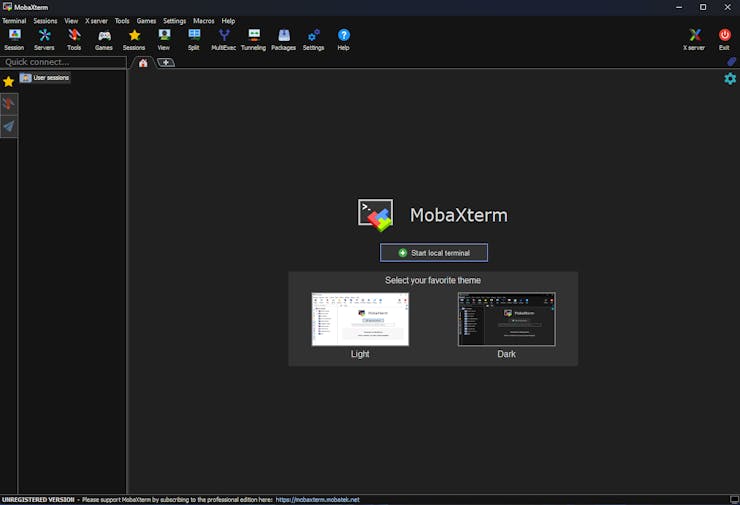
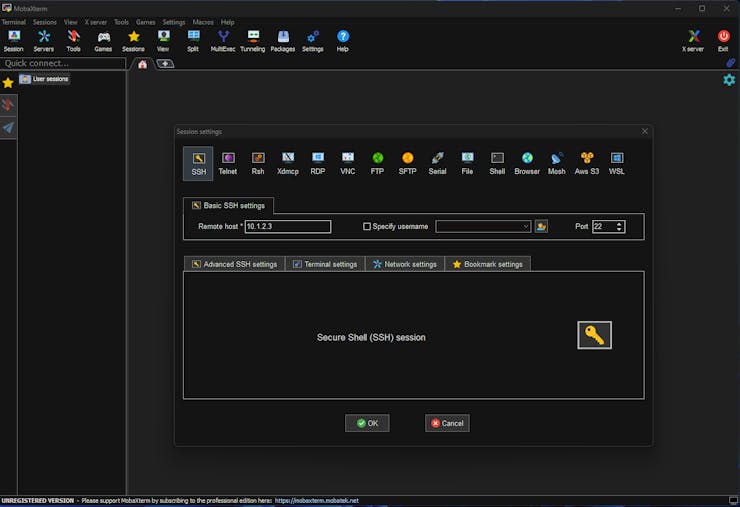
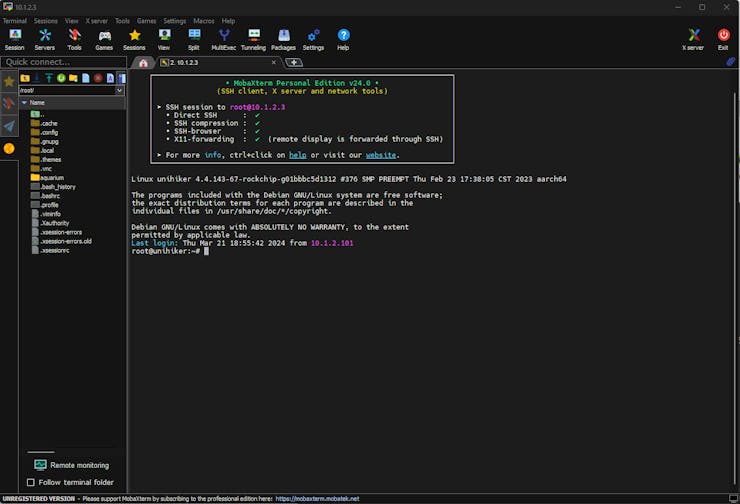
#️⃣ To set up the SSH connection to access the terminal, I decided to utilize MobaXterm due to its advanced terminal configuration options.
#️⃣ After installing MobaXterm, connect to the UNIHIKER remote host with the default root user credentials:
- Server (Host): 10.1.2.3
- Account (Username): root
- Password: dfrobot
![]()
![]()
![]()
![]()
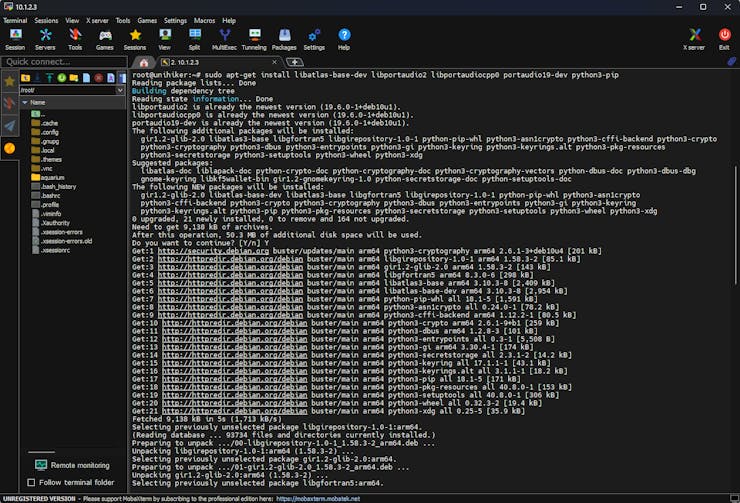
#️⃣ After establishing the SSH connection via MobaXterm, to run Edge Impulse object detection models on UNIHIKER, install the Edge Impulse Linux Python SDK by utilizing the terminal.
sudo apt-get install libatlas-base-dev libportaudio2 libportaudiocpp0 portaudio19-dev python3-pip
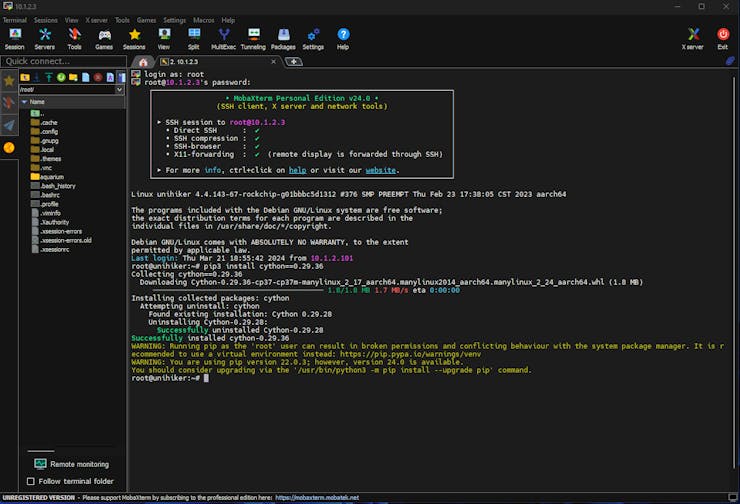
#️⃣ To be able to utilize the Linux Python SDK, the Cython module is required on UNIHIKER. However, the latest Cython version is not compatible with the SDK. According to my experiments, the Cython 0.29.36 version works without a problem.
pip3 install cython==0.29.36
#️⃣ After downloading the correct Cython version, continue installing the Linux Python SDK.
pip3 install pyaudio edge_impulse_linux
![]()
![]()
![]()
#️⃣ Since I employed the integrated Python modules to control the GPIO pins of the microcontroller coprocessor, design a feature-rich user interface (GUI — Tkinter application), and display the interactive user interface on the built-in touchscreen, I did not need to install any additional Python libraries via MobaXterm.
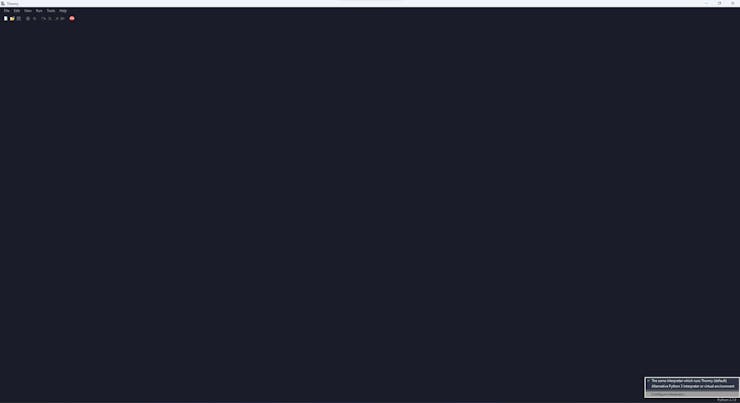
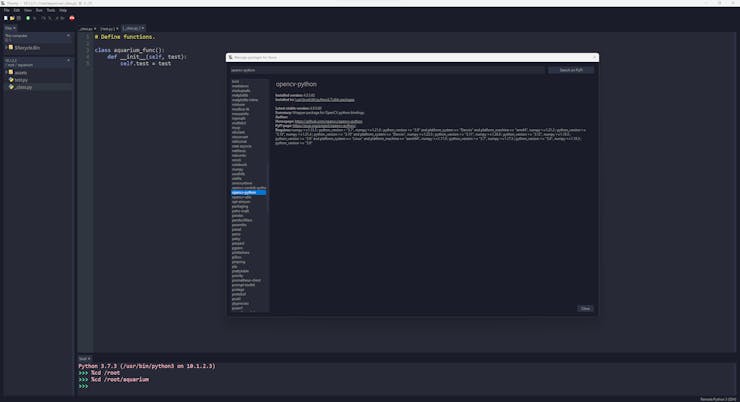
#️⃣ Although MobaXterm lets the user access the root folder and run Python scripts, I decided to utilize Thonny Python IDE to program my Python scripts due to its simple debugger.
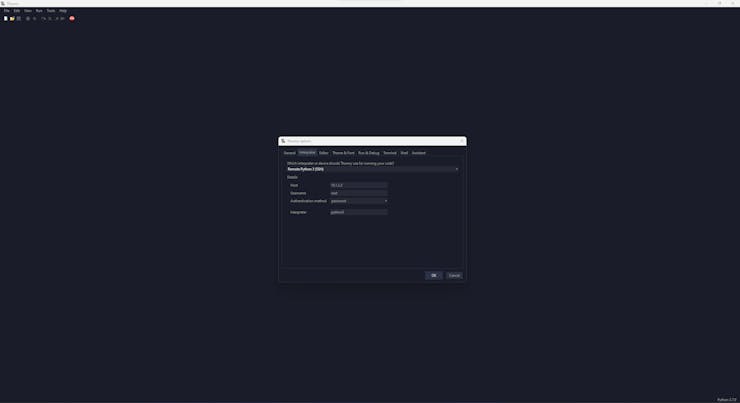
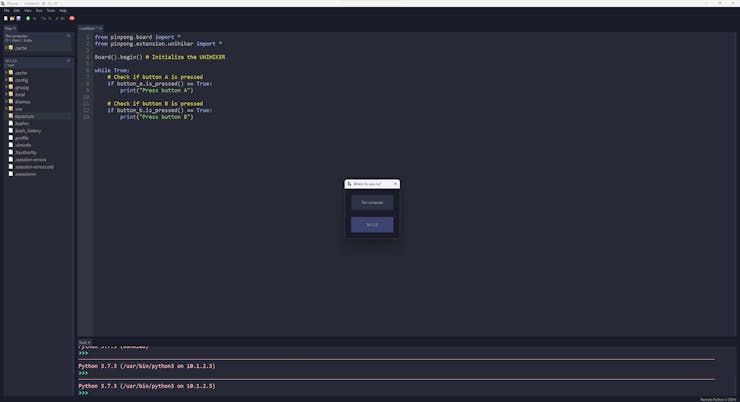
#️⃣ After installing the required modules via MobaXterm, open Thonny and connect UNIHIKER by applying the built-in Remote Python 3 (SSH) interpreter.
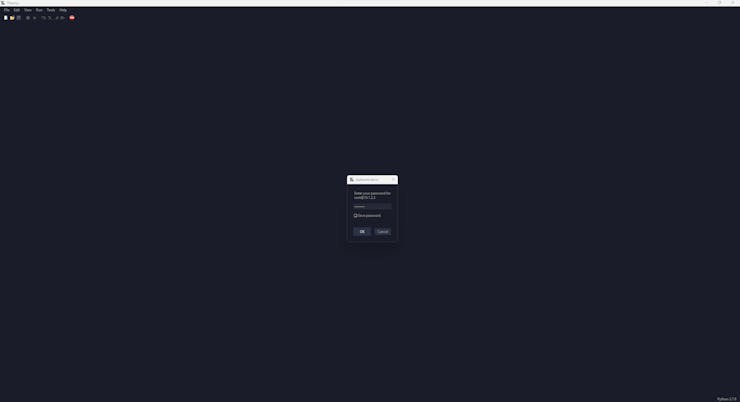
#️⃣ After changing the interpreter, use the default root user credentials to initiate the SSH connection on Thonny.
![]()
![]()
![]()
![]()
![]()
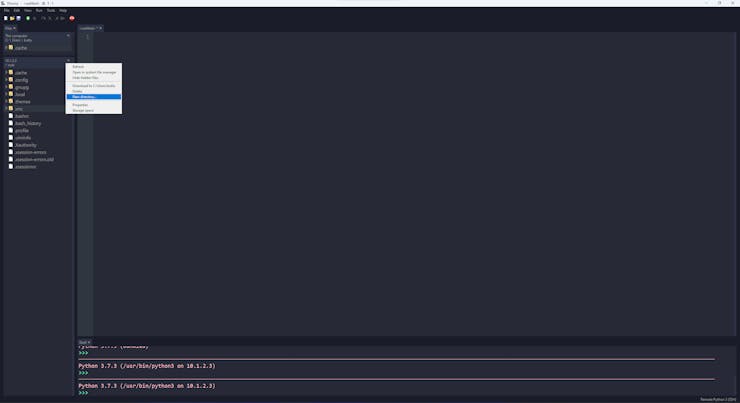
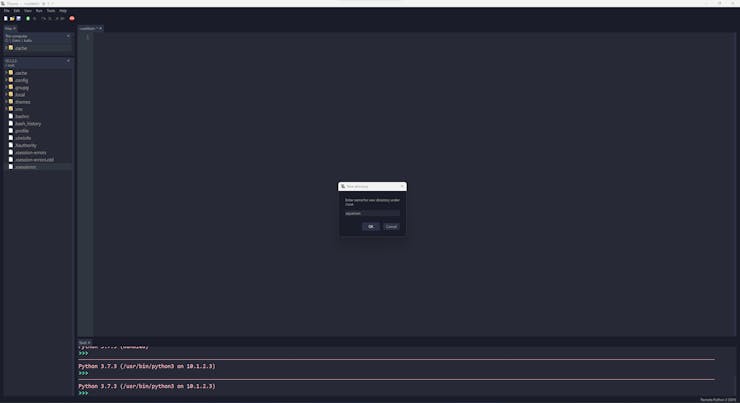
#️⃣ After establishing the SSH connection, Thonny lets the user access the root folder, create directories, upload files (assets), and run Python scripts.
![]()
![]()
![]()
![]()
![]()
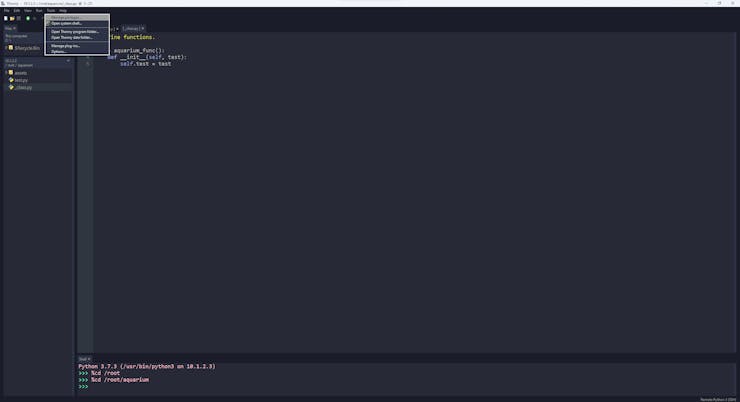
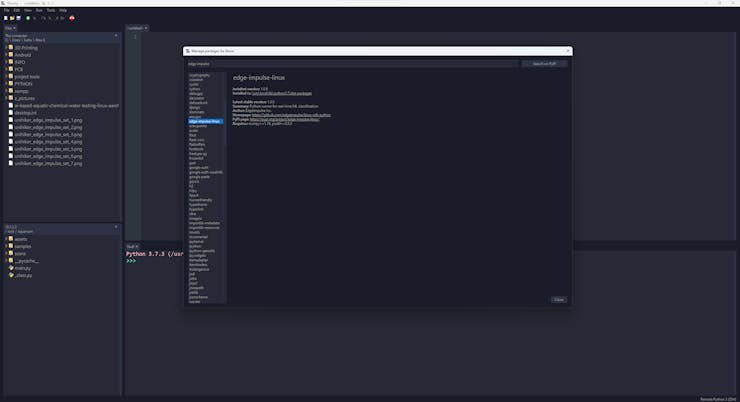
#️⃣ Although Thonny does not let the user install or update Python modules, to inspect the available (pre-installed) libraries, go to Tools ➡ Manage packages...
![]()
![]()
![]()
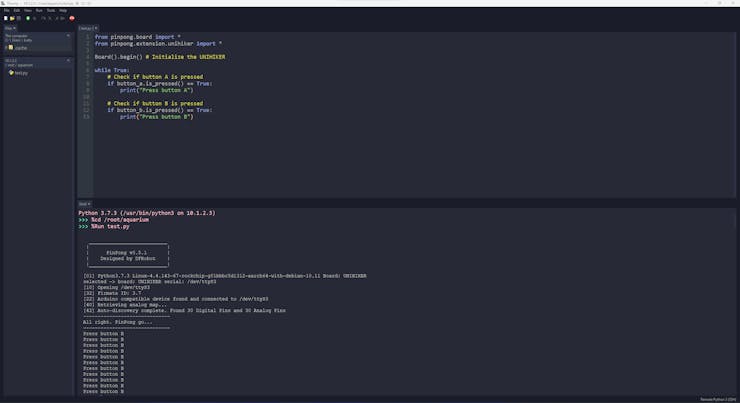
#️⃣ To run code files manually without establishing the SSH connection, press the onboard Home button on UNIHIKER, go to Run Programs, and select a code file.
![]()
![]()
-
13Step 8: Collecting information produced by the ultrasonic sensor and the accelerometer
After setting Nano ESP32 on the Arduino IDE, I programmed Nano ESP32 to initiate an aquatic ultrasonic scan, generate an ultrasonic scan data buffer according to the movements detected by the accelerometer, and transfer the generated ultrasonic scan buffer to the web application via an HTTP POST request.
Since I wanted to provide a feature-rich user interface allowing the user to assign labels while collecting data samples, I decided to connect the SSD1306 OLED display and four control buttons to Nano ESP32. Via the user interface, I was able to assign air bubble classes empirically and send the generated ultrasonic scan buffer with the selected air bubble class (label) directly to the web application. As mentioned earlier, Nano ESP32 does not provide an onboard storage option. Thus, by transferring samples to the web application, I obviated the need for connecting external storage to Nano ESP32.
Since Nano ESP32 features three hardware serial (UART) ports, excluding the USB serial port, I was able to connect multiple sensors requiring serial communication without a data transmission conflict.
As explained in the previous steps, the web application sorts the transferred data packet to save ultrasonic scan samples as text files named according to the assigned classes.
This AI-powered underwater air bubble detection device comprises two separate development boards — Nano ESP32 and UNIHIKER — performing interconnected features for data collection and running advanced AI models. Thus, the described code snippets show the different aspects of the same code file. Please refer to the code files below to inspect all interconnected functions in detail.
📁 AIoT_Aquatic_Ultrasonic_Imaging.ino
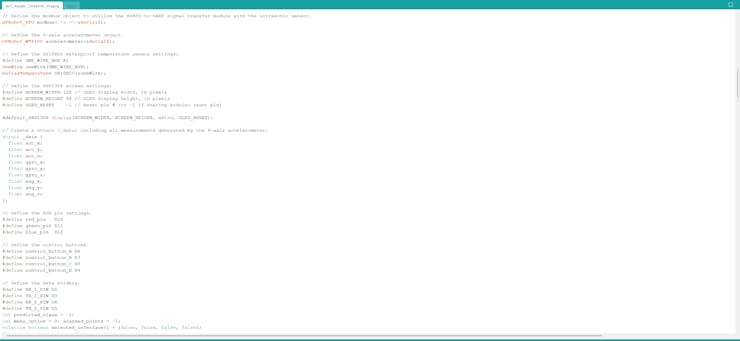
⭐ Include the required libraries.
#include <WiFi.h>#include "DFRobot_RTU.h"#include <DFRobot_WT61PC.h>#include <OneWire.h>#include <DallasTemperature.h>#include <Adafruit_GFX.h>#include <Adafruit_SSD1306.h>
⭐ Add the interface icons and the assigned class logos (converted C arrays) to be shown on the SSD1306 OLED display — logo.h.
#include "logo.h"
⭐ Define the required server configurations for the web application hosted on LattePanda 3 Delta 864.
⭐ Then, initialize the WiFiClient object.
char server[] = "192.168.1.22";// Define the web application path.String application = "/Aquatic_Ultrasonic_Imaging/";// Initialize the WiFiClient object.WiFiClient client; /* WiFiSSLClient client; */
⭐ Define the buffer (array) and allocate the buffer size to save the ultrasonic scan data items — a 20 x 20 image (400 data points).
#define scan_buffer_size 400float ultrasonic_scan[scan_buffer_size] = {0};⭐ Define the required configuration parameters and the address to register settings for the URM15 ultrasonic sensor.
#define SLAVE_ADDR ((uint16_t)0x0F)typedef enum{ ePid, eVid, eAddr, eComBaudrate, eComParityStop, eDistance, eInternalTempreture, eExternTempreture, eControl}eRegIndex_t;⭐ Define the modbus object and assign the hardware serial port (Serial1) to obtain the information generated by the ultrasonic sensor via the RS485-to-UART signal adapter module.
DFRobot_RTU modbus(/*s =*/&Serial1);
⭐ Define the accelerometer object and assign the hardware serial port (Serial2) to obtain the information generated by the 6-axis accelerometer via serial communication.
DFRobot_WT61PC accelerometer(&Serial2);
⭐ Define the required configuration settings for the DS18B20 waterproof temperature sensor.
#define ONE_WIRE_BUS A1OneWire oneWire(ONE_WIRE_BUS);DallasTemperature DS18B20(&oneWire);
⭐ Configure the SSD1306 OLED display.
#define SCREEN_WIDTH 128 // OLED display width, in pixels#define SCREEN_HEIGHT 64 // OLED display height, in pixels#define OLED_RESET -1 // Reset pin # (or -1 if sharing Arduino reset pin)Adafruit_SSD1306 display(SCREEN_WIDTH, SCREEN_HEIGHT, &Wire, OLED_RESET);
⭐ Create a struct (_data) to list and access the information generated by the 6-axis accelerometer easily.
struct _data { float acc_x; float acc_y; float acc_z; float gyro_x; float gyro_y; float gyro_z; float ang_x; float ang_y; float ang_z;};⭐ Initialize the first hardware serial port (Serial1) to communicate with the URM15 ultrasonic sensor via the RS485-to-UART signal adapter module.
⭐ Initialize the second hardware serial port (Serial2) to communicate with the 6-axis accelerometer.
Serial1.begin(19200, SERIAL_8N1, RX_1_PIN, TX_1_PIN); Serial2.begin(9600, SERIAL_8N1, RX_2_PIN, TX_2_PIN);
⭐ Set the URM15 ultrasonic sensor to trigger mode, select the external temperature compensation, and enable the temperature compensation function by overwriting the control register variable — byte (LSB).
/* bit0: 0 - select onboard temperature 1 - select external temperature bit1: 0 - enable temperature compensation function 1 - disable temperature compensation function bit2: 0 - activate auto detection 1 - activate passive detection bit3: 1 - read distance every 65 ms (in passive detection mode) */ modbus.writeHoldingRegister(/*id =*/SLAVE_ADDR, /*reg =*/ eControl, /*val =*/0b00000001);
⭐ Initiate the 6-axis accelerometer and configure its data output frequency.
accelerometer.modifyFrequency(FREQUENCY_200HZ); /* FREQUENCY_0_1HZ, FREQUENCY_0_5HZ, FREQUENCY_1HZ, FREQUENCY_2HZ, FREQUENCY_5HZ, FREQUENCY_10HZ, FREQUENCY_20HZ, FREQUENCY_50HZ, FREQUENCY_100HZ, FREQUENCY_125HZ, FREQUENCY_200HZ */
⭐ Initialize the DS18B20 temperature sensor.
DS18B20.begin();
⭐ Attempt to connect to the given Wi-Fi network and wait for the successful network connection.
WiFi.mode(WIFI_STA); WiFi.begin(ssid, pass); // Attempt to connect to the given Wi-Fi network. while(WiFi.status() != WL_CONNECTED){ // Wait for the network connection. delay(500); Serial.print("."); } // If connected to the network successfully: Serial.println("Connected to the Wi-Fi network successfully!");⭐ In the make_a_post_request function:
⭐ Connect to the web application named Aquatic_Ultrasonic_Imaging.
⭐ Create the query string by adding the given URL query (GET) parameters, including buffer data type, the selected class, and the detected label.
⭐ Define the boundary parameter named UltrasonicScan so as to send the generated ultrasonic scan data buffer (400 points) as a text (TXT) file to the web application.
⭐ Get the total content (data packet) length.
⭐ Make an HTTP POST request with the created query string to the web application in order to transfer the generated ultrasonic scan data buffer as a TXT file with the selected class or the label detected by the neural network model.
⭐ Wait until transferring the ultrasonic scan (text) buffer.
boolean make_a_post_request(String request){ // Connect to the web application named Aquatic_Ultrasonic_Imaging. Change '80' with '443' if you are using SSL connection. if (client.connect(server, 80)){ // If successful: Serial.println("\nConnected to the web application successfully!\n"); // Create the query string: String query = application + request; // Make an HTTP POST request: String head = "--UltrasonicScan\r\nContent-Disposition: form-data; name=\"ultrasonic_scan\"; filename=\"new_scan.txt\"\r\nContent-Type: text/plain\r\n\r\n"; String tail = "\r\n--UltrasonicScan--\r\n"; // Get the total message length. uint32_t totalLen = head.length() + sizeof(ultrasonic_scan) + (scan_buffer_size*sizeof(char)) + tail.length(); // Start the request: client.println("POST " + query + " HTTP/1.1"); client.println("Host: 192.168.1.22"); client.println("Content-Length: " + String(totalLen)); client.println("Connection: Keep-Alive"); client.println("Content-Type: multipart/form-data; boundary=UltrasonicScan"); client.println(); client.print(head); for(int i=0; i<scan_buffer_size; i++){ client.print(ultrasonic_scan[i]); client.print(",");} client.print(tail); // Wait until transferring the ultrasonic scan (text) buffer (20x20). delay(2000); // If successful: Serial.println("HTTP POST => Data transfer completed!\n"); return true; }else{ Serial.println("\nConnection failed to the web application!\n"); delay(2000); return false; }}⭐ In the read_ultrasonic_sensor function:
⭐ Configure the external temperature value by utilizing the evaluated water temperature to generate precise distance measurements.
⭐ Obtain the temperature-compensated distance measurement produced by the URM15 ultrasonic sensor, except if the sensor is out of range.
void read_ultrasonic_sensor(float water_temp){ // Configure the external temperature value by utilizing the evaluated water temperature to generate precise distance measurements. water_temp = water_temp*10; modbus.writeHoldingRegister(/*id =*/SLAVE_ADDR, /*reg =*/eExternTempreture, /*val =*/water_temp); delay(50); // Obtain the temperature-compensated distance measurement produced by the URM15 ultrasonic sensor. distance = modbus.readHoldingRegister(SLAVE_ADDR, eDistance); delay(50); // If the sensor is out of range, set the distance to -1. if(distance == 65535){ distance = -1; Serial.println("Ultrasonic sensor is out of range!"); }else{ distance = distance/10; } delay(50);}⭐ In the read_accelerometer function, obtain the X, Y, and Z-axis movement variables generated by the 6-axis accelerometer — acceleration, angular velocity, and angle.
void read_accelerometer(){ // Obtain the X, Y, and Z-axis measurements generated by the 6-axis accelerometer — acceleration, angular velocity, angle. if(accelerometer.available()){ _acc.acc_x = accelerometer.Acc.X; _acc.acc_y = accelerometer.Acc.Y; _acc.acc_z = accelerometer.Acc.Z; _acc.gyro_x = accelerometer.Gyro.X; _acc.gyro_y = accelerometer.Gyro.Y; _acc.gyro_z = accelerometer.Gyro.Z; _acc.ang_x = accelerometer.Angle.X; _acc.ang_y = accelerometer.Angle.Y; _acc.ang_z = accelerometer.Angle.Z; }}⭐ In the get_temperature function, obtain the water temperature in Celsius, estimated by the DS18B20 waterproof temperature sensor.
float get_temperature(){ // Obtain the temperature measurement in Celsius, estimated by the DS18B20 temperature sensor. DS18B20.requestTemperatures(); float t = DS18B20.getTempCByIndex(0); delay(50); return t;}⭐ In the ultrasonic_imaging function:
⭐ Detect real-time device motions by reviewing the movement variables (X-axis and Y-axis) generated by the 6-axis accelerometer — acceleration and angular velocity.
⭐ If the device is gradually moving underwater within an arbitrary square, collect the temperature-compensated distance measurements produced by the URM15 ultrasonic sensor and save them as data points until completing the ultrasonic scan data buffer — 20 x 20 (400 points).
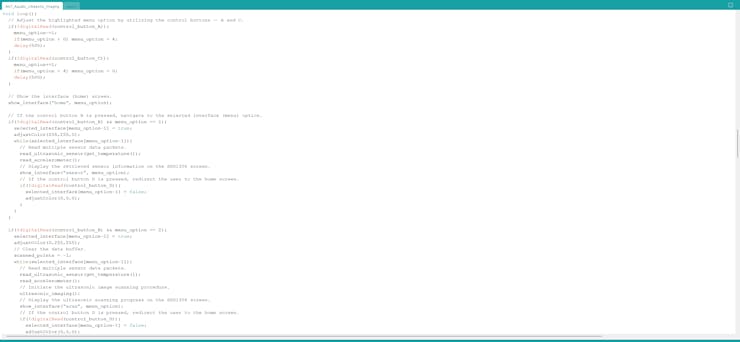
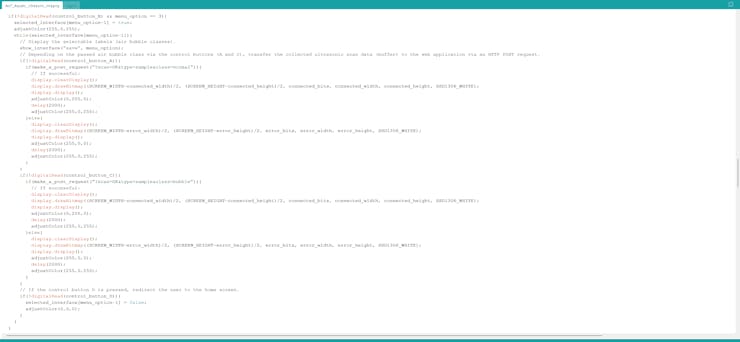
void ultrasonic_imaging(){ // Define underwater device movements by utilizing the axis measurements generated by the 6-axis accelerometer — acceleration and angular velocity. if(_acc.acc_x > 0 && _acc.gyro_x > 0 && _acc.acc_y > 0 && _acc.gyro_y > 0){ // If the device is moving underwater inside an arbitrary square, collect the temperature-compensated distance measurements produced by the URM15 ultrasonic sensor // and save them as data points to the scan data buffer — 20 x 20 (400 points). if(scanned_points < 399){ scanned_points+=1; ultrasonic_scan[scanned_points] = distance/100; delay(50); }else{ adjustColor(0,255,0); Serial.println("Scan Completed!"); delay(50); } }}⭐ Change the highlighted menu option by operating the onboard control buttons — A and C.
⭐ Show the selected (highlighted) menu option with its assigned interface icon on the SSD1306 OLED display.
if(!digitalRead(control_button_A)){ menu_option-=1; if(menu_option < 0) menu_option = 4; delay(500); } if(!digitalRead(control_button_C)){ menu_option+=1; if(menu_option > 4) menu_option = 0; delay(500); } // Show the interface (home) screen. show_interface("home", menu_option);⭐ After selecting a menu option, if the control button B is pressed, navigate to the highlighted interface (menu) option.
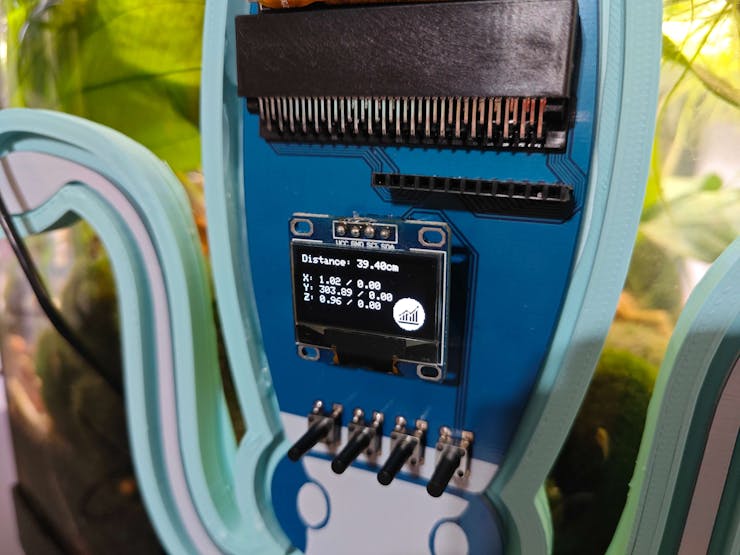
⭐ If the first option (Show Readings) is activated:
⭐ Obtain the information produced by the ultrasonic sensor and the accelerometer.
⭐ Then, display the assigned interface logo and the retrieved sensor information on the SSD1306 screen for debugging.
⭐ If the control button D is pressed, redirect the user to the home screen.
if(!digitalRead(control_button_B) && menu_option == 1){ selected_interface[menu_option-1] = true; adjustColor(255,255,0); while(selected_interface[menu_option-1]){ // Read multiple sensor data packets. read_ultrasonic_sensor(get_temperature()); read_accelerometer(); // Display the retrieved sensor information on the SSD1306 screen. show_interface("sensor", menu_option); // If the control button D is pressed, redirect the user to the home screen. if(!digitalRead(control_button_D)){ selected_interface[menu_option-1] = false; adjustColor(0,0,0); } } }⭐ If the second option (Ultrasonic+++) is activated:
⭐ Obtain the information produced by the ultrasonic sensor and the accelerometer.
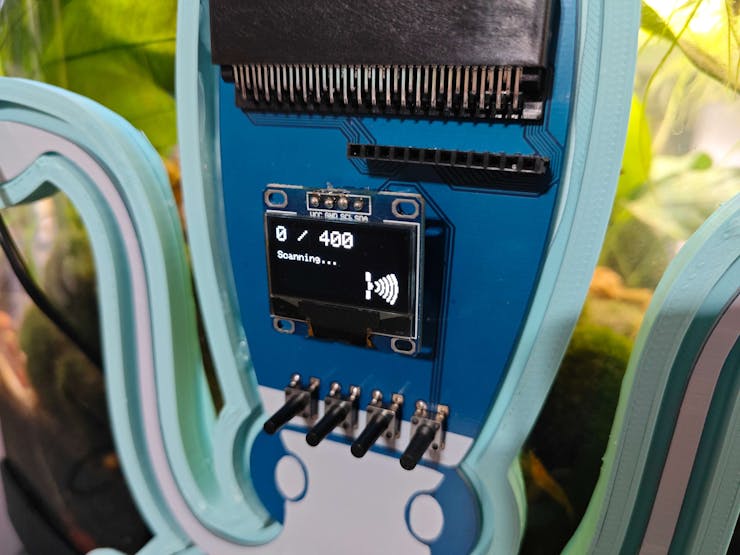
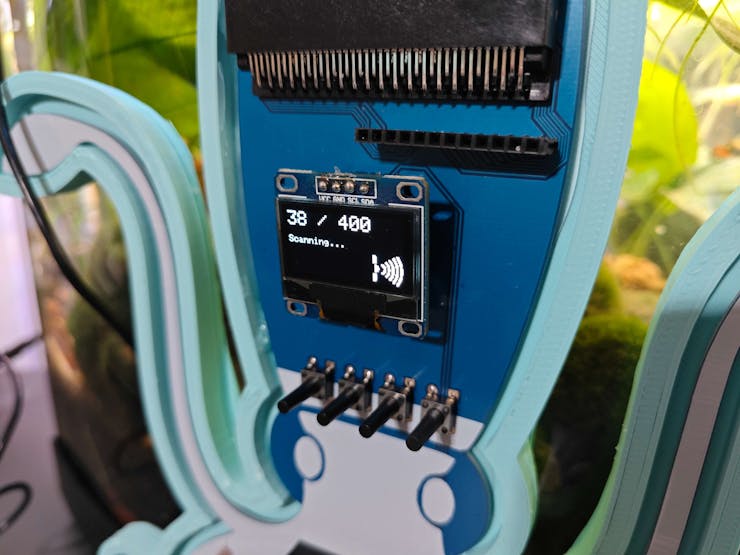
⭐ Initiate the ultrasonic image scanning procedure and save data points until completing the scan buffer — 20 x 20 (400 points).
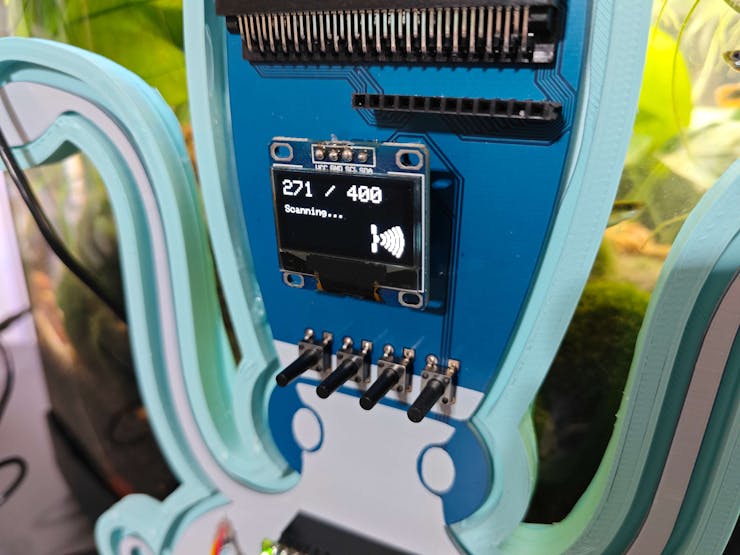
⭐ Display the ultrasonic scan progress (collected points) on the SSD1306 screen.
⭐ If the control button D is pressed, redirect the user to the home screen.
if(!digitalRead(control_button_B) && menu_option == 2){ selected_interface[menu_option-1] = true; adjustColor(0,255,255); // Clear the data buffer. scanned_points = -1; while(selected_interface[menu_option-1]){ // Read multiple sensor data packets. read_ultrasonic_sensor(get_temperature()); read_accelerometer(); // Initiate the ultrasonic image scanning procedure. ultrasonic_imaging(); // Display the ultrasonic scanning progress on the SSD1306 screen. show_interface("scan", menu_option); // If the control button D is pressed, redirect the user to the home screen. if(!digitalRead(control_button_D)){ selected_interface[menu_option-1] = false; adjustColor(0,0,0); } } }⭐ If the third option (Save Samples) is activated:
⭐ Display the selectable labels (air bubble classes) with their associated buttons.
⭐ Via the onboard control buttons (A and C), assign an air bubble class (normal or bubble) to the produced ultrasonic scan data buffer.
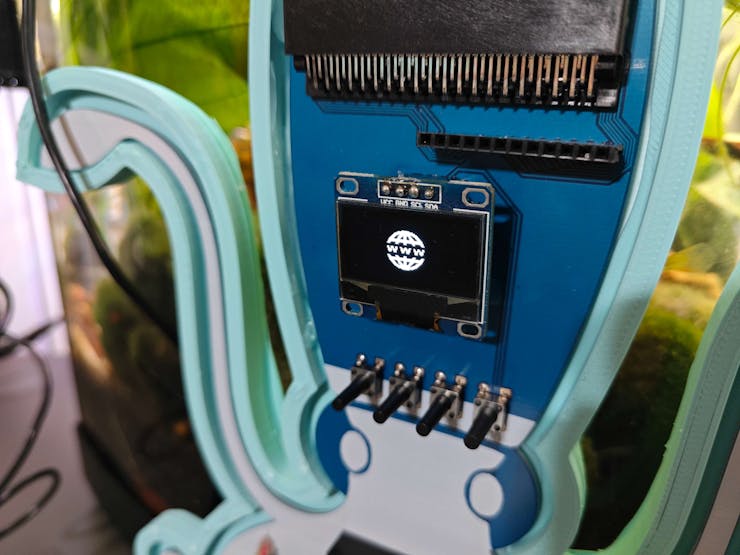
⭐ With the passed label, transfer the data type (sample or detection) and the given ultrasonic scan data buffer by making an HTTP POST request to the web application.
⭐ According to the data transmission success, notify the user by showing the associated connection icon on the screen.
⭐ If the control button D is pressed, redirect the user to the home screen.
if(!digitalRead(control_button_B) && menu_option == 3){ selected_interface[menu_option-1] = true; adjustColor(255,0,255); while(selected_interface[menu_option-1]){ // Display the retrieved sensor information on the SSD1306 screen. show_interface("save", menu_option); // Depending on the passed air bubble class via the control buttons (A and C), transfer the collected ultrasonic scan data (buffer) to the web application via an HTTP POST request. if(!digitalRead(control_button_A)){ if(make_a_post_request("?scan=OK&type=sample&class=normal")){ // If successful: display.clearDisplay(); display.drawBitmap((SCREEN_WIDTH-connected_width)/2, (SCREEN_HEIGHT-connected_height)/2, connected_bits, connected_width, connected_height, SSD1306_WHITE); display.display(); adjustColor(0,255,0); delay(2000); adjustColor(255,0,255); }else{ display.clearDisplay(); display.drawBitmap((SCREEN_WIDTH-error_width)/2, (SCREEN_HEIGHT-error_height)/2, error_bits, error_width, error_height, SSD1306_WHITE); display.display(); adjustColor(255,0,0); delay(2000); adjustColor(255,0,255); } } if(!digitalRead(control_button_C)){ if(make_a_post_request("?scan=OK&type=sample&class=bubble")){ // If successful: display.clearDisplay(); display.drawBitmap((SCREEN_WIDTH-connected_width)/2, (SCREEN_HEIGHT-connected_height)/2, connected_bits, connected_width, connected_height, SSD1306_WHITE); display.display(); adjustColor(0,255,0); delay(2000); adjustColor(255,0,255); }else{ display.clearDisplay(); display.drawBitmap((SCREEN_WIDTH-error_width)/2, (SCREEN_HEIGHT-error_height)/2, error_bits, error_width, error_height, SSD1306_WHITE); display.display(); adjustColor(255,0,0); delay(2000); adjustColor(255,0,255); } } // If the control button D is pressed, redirect the user to the home screen. if(!digitalRead(control_button_D)){ selected_interface[menu_option-1] = false; adjustColor(0,0,0); } } }![]()
![]()
![]()
![]()
![]()
-
14Step 8.1: Generating aquatic ultrasonic scans manifesting air bubbles and saving samples via the web application
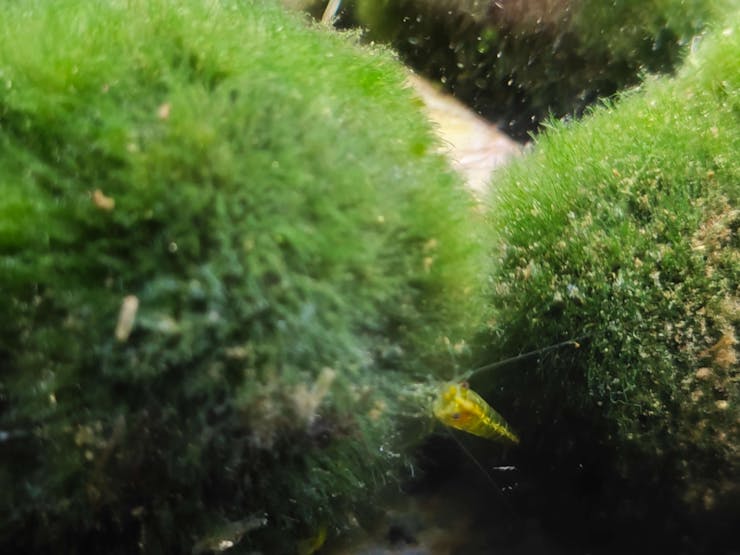
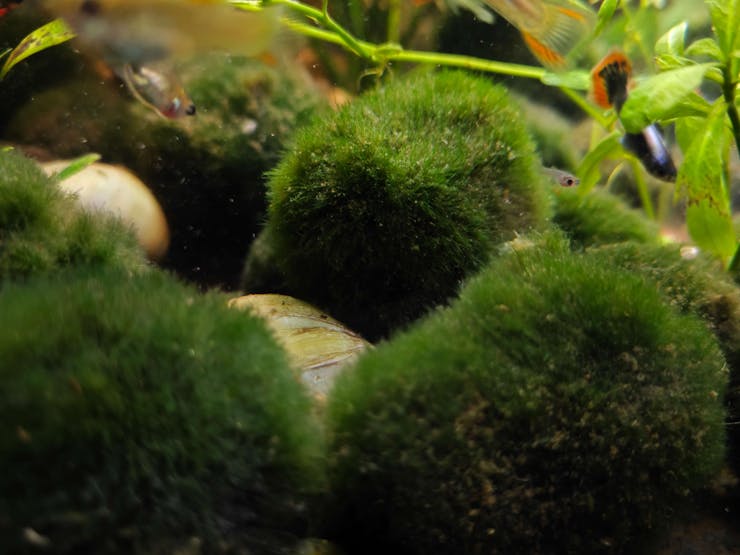
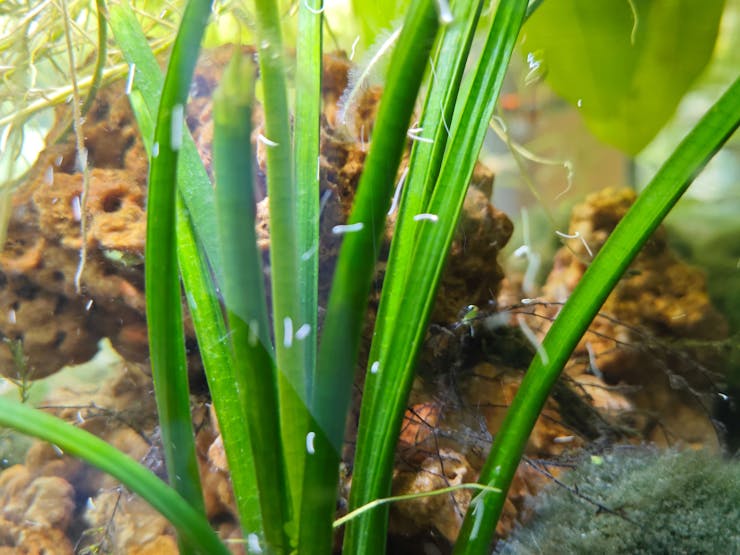
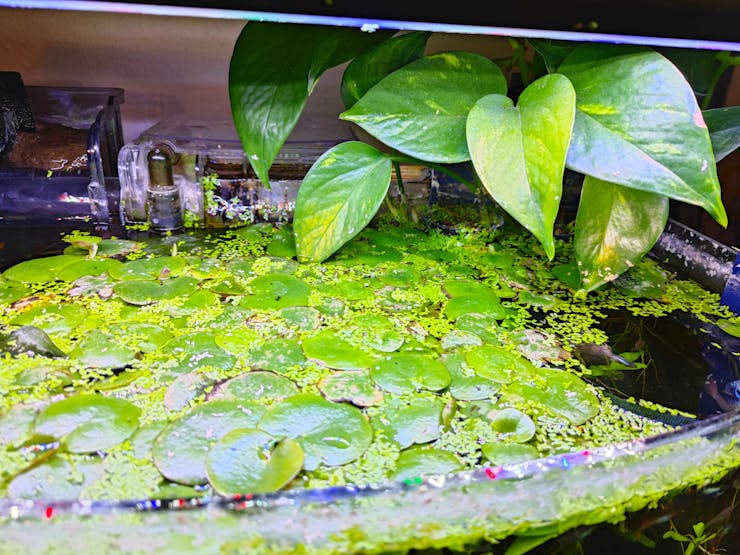
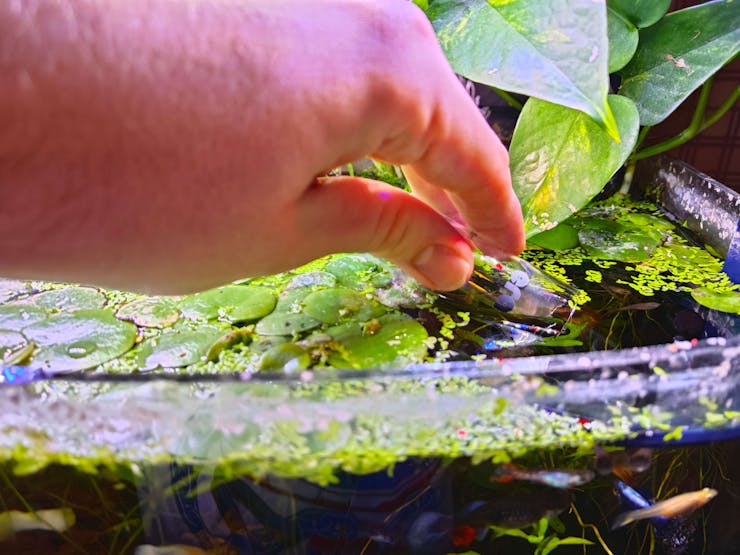
#️⃣ As explained earlier, I placed a lot of marimo moss balls at the bottom of the tank to increase the bottom surface area, provide underwater substrate gaps, and observe abundant noxious air bubbles while collecting ultrasonic scan data.
#️⃣ Thus, I managed to construct a valid data set for the neural network model.
![]()
![]()
![]()
🐠📡💧📊 If Nano ESP32 connects to the Wi-Fi network successfully, the device shows the home screen with the menu (interface) options on the SSD1306 screen.
- 1. Show Readings
- 2. Ultrasonic+++
- 3. Save Samples
- 4. Run Inference
![]()
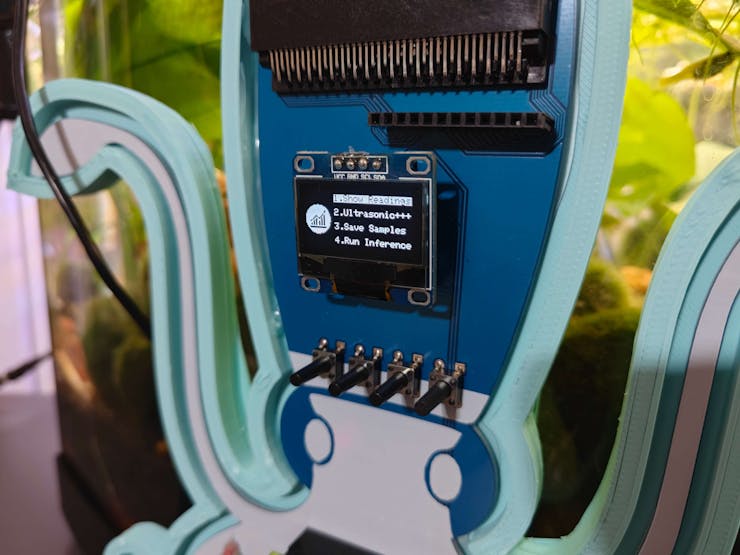
🐠📡💧📊 The device lets the user change the highlighted menu option by pressing the control buttons — A (↓) and C (↑).
🐠📡💧📊 While the user adjusts the highlighted menu option, the device displays the associated interface icon on the screen.
![]()
![]()
![]()
🐠📡💧📊 After highlighting a menu option, if the control button B is pressed, the device navigates to the selected option.
🐠📡💧📊 After activating a menu option, the device returns to the home screen if the user presses the control button D.
🐠📡💧📊 If the user activates the first menu option — Show Readings:
🐠📡💧📊 The device displays the information produced by the ultrasonic sensor and the accelerometer on the SSD1306 screen for debugging.
🐠📡💧📊 Then, the device turns the RGB LED (connected to Nano ESP32) to yellow.
![]()
![]()
![]()
![]()
🐠📡💧📊 If the user activates the second menu option — Ultrasonic+++:
🐠📡💧📊 The device turns the RGB LED to cyan.
🐠📡💧📊 The device detects real-time motions while the ultrasonic sensor is submerged by reviewing the movement variables produced by the 6-axis accelerometer — acceleration and angular velocity.
🐠📡💧📊 If the device is gradually moving underwater within an arbitrary square, Nano ESP32 collects the temperature-compensated distance measurements produced by the ultrasonic sensor and save them as data points until concluding the ultrasonic scan buffer — 20 x 20 (400 points).
🐠📡💧📊 After initiating the ultrasonic image scanning procedure, the device shows the scan progress (collected points) on the SSD1306 screen.
![]()
![]()
![]()
![]()
![]()
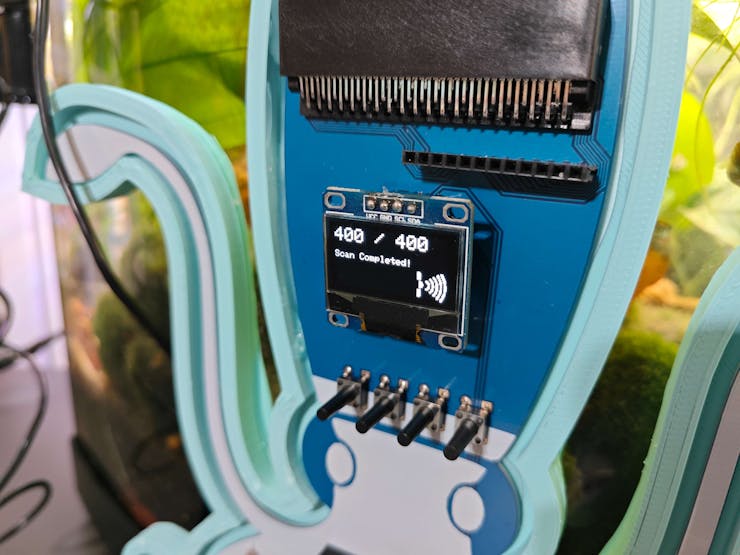
🐠📡💧📊 When Nano ESP32 completes collecting 400 data points of the scan buffer, the device notifies the user via the screen and turns the RGB LED to green.
![]()
![]()
🐠📡💧📊 If the user activates the third menu option — Save Samples:
🐠📡💧📊 The device turns the RGB LED to magenta and displays the selectable labels (air bubble classes) with their associated buttons.
- A) Class => normal
- C) Class => bubble
🐠📡💧📊 Via the onboard control buttons (A and C), the device lets the user assign an air bubble class (normal or bubble) to the generated ultrasonic scan data buffer empirically.
![]()
![]()
![]()
🐠📡💧📊 After pressing a control button (A or C), the device transfers the passed label and the generated ultrasonic scan data buffer to the web application via an HTTP POST request.
🐠📡💧📊 If Nano ESP32 transfers the given data packet successfully to the web application, the device notifies the user by showing the assigned connection icon on the screen and turning the RGB LED to green.
![]()
![]()
🐠📡💧📊 After receiving the ultrasonic scan buffer, the web application saves the buffer as a text (TXT) file (data record) to the sample folder by adding the passed label and the collection date to the file name.
- sample_normal__2024_03_14_07_52_41.txt
- sample_bubble__2024_04_03_16_53_08.txt
![]()
![]()
-
15Step 9: Applying chemical water quality tests to analyze water contamination
Since all underwater air bubble activity cannot be singled out as an imminent toxic pollution risk, I decided to enable this air bubble detection device with the ability to assess potential water pollution based on chemical water quality tests.
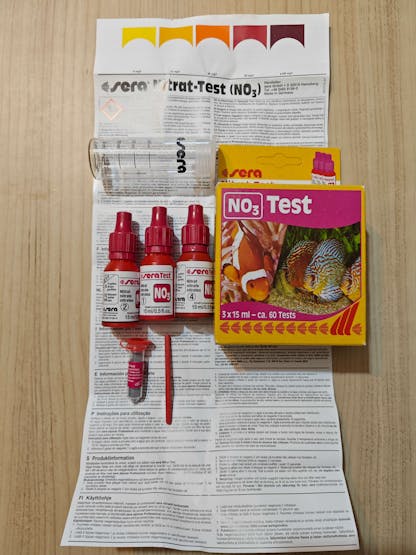
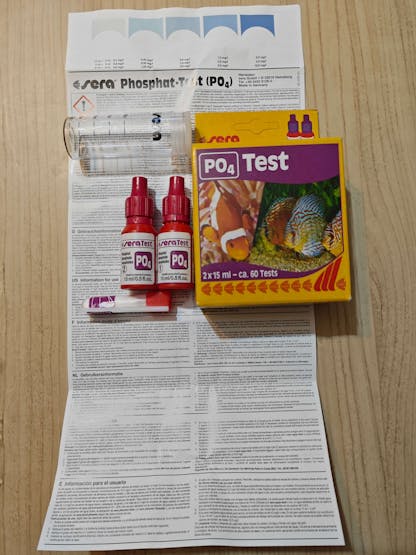
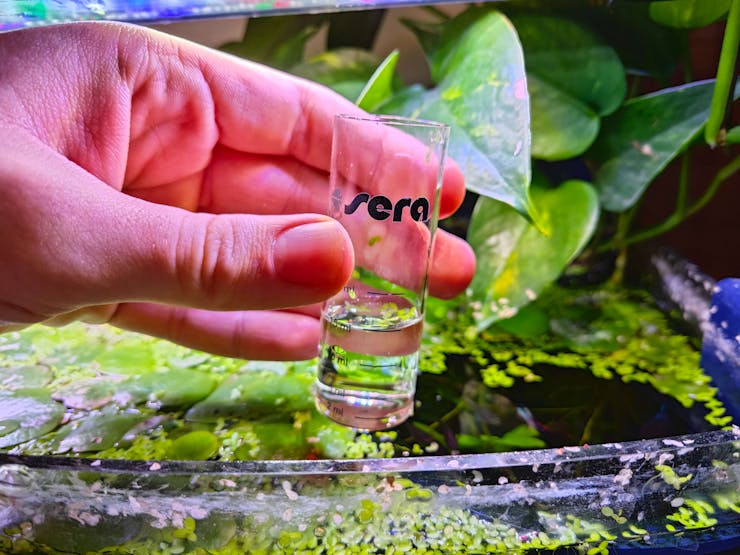
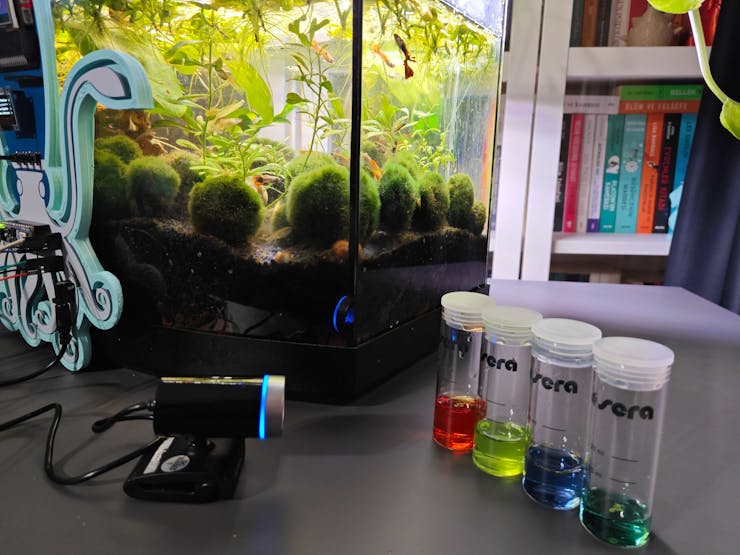
Even though there are various water quality tests for fish tanks, I decided to utilize color-coded chemical tests produced by the renowned full-range supplier for aquariums, ponds, and terrariums — sera. In this regard, I was able to make the object detection model determine the water pollution levels easily by the color discrepancies of the applied water quality tests.
After researching the most common indicators of water pollution in a retail fish farm, in this case, my overpopulated medium-sized aquarium simulating harsh fish farm conditions, I decided to apply these four water quality tests regularly:
![]()
![]()
![]()
![]()
![]()
After following the provided instructions thoroughly for each chemical test and observing the water quality levels (color codes) from a new water change state to the peak of the underwater air bubble activity, I managed to group water pollution levels into three categories:
- sterile
- dangerous
- polluted
![]()
![]()
![]()
![]()
![]()
![]()
![]()
![]()
-
16Step 9.1: Capturing water quality test result images w/ the USB webcam
After setting up the necessary software on UNIHIKER via SSH and installing the required modules, I programmed UNIHIKER to capture the water quality test result images with the USB webcam and save them as samples.
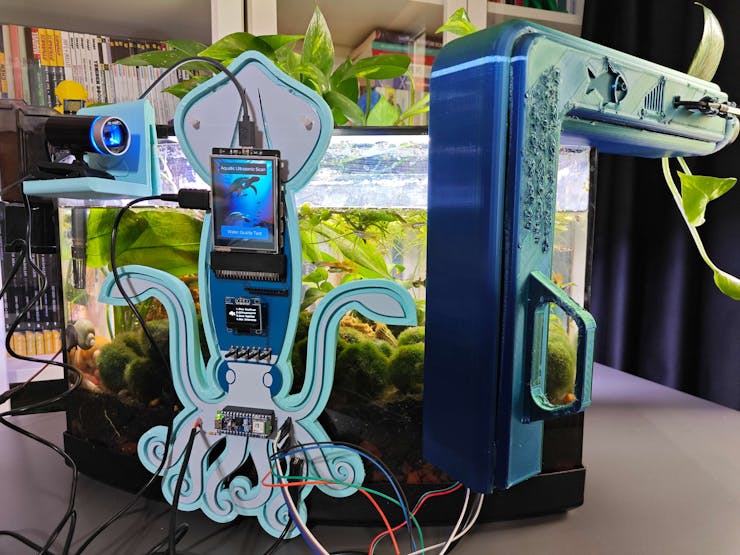
Since I wanted to provide a feature-rich user interface to capture water quality test result image samples, assign labels, and access the interconnected features, I decided to program an interactive user interface (GUI — Tkinter application) with the integrated Python modules. Since UNIHIKER provides an onboard touchscreen and two control buttons, I did not need to connect additional components to display the user interface. Via the micro:bit-compatible edge connector on the Squid PCB, I added a secondary RGB LED to inform the user of the device status while performing operations related to UNIHIKER.
As explained earlier, I managed to group water pollution levels into three categories. Thus, I added the corresponding pollution levels as labels to the file names of each sample while capturing images to create a valid data set for the object detection model.
This AI-powered underwater air bubble detection device, assessing water pollution based on chemical tests, comprises two separate development boards — UNIHIKER and Nano ESP32 — performing interconnected features for data collection and running advanced AI models. Thus, the described code snippets show the different aspects of the same code file. Please refer to the code files below to inspect all interconnected functions in detail.
📁 _class.py
To bundle all functions under a specific structure, I created a class named aquarium_func. In the following steps, I will clarify the remaining functions of this class. Please refer to the _class.py file to inspect all interconnected functions.
⭐ In the display_camera_feed function:
⭐ Obtain the real-time video stream (frames) generated by the high-quality USB webcam.
⭐ Resize the latest captured camera frame depending on the provided image sample sizes of the Edge Impulse object detection model.
⭐ Then, resize the same frame to display a snapshot of the latest captured camera frame on the onboard touchscreen.
⭐ Stop the real-time camera feed if requested.
def display_camera_feed(self): # Display the real-time video stream generated by the USB webcam. ret, img = self.camera.read() # Resize the captured frame depending on the given object detection model. self.latest_frame_m = cv2.resize(img, self.frame_size_m) # Resize the same frame to display it on the UNIHIKER screen (snapshot). self.latest_frame_s = cv2.resize(img, self.frame_size_s) # Stop the camera feed if requested. if cv2.waitKey(1) & 0xFF == ord('q'): self.camera.release() cv2.destroyAllWindows() print("\nCamera Feed Stopped!")⭐ In the take_snapshot function:
⭐ Save the latest snapshot frame to a temporary image file — snapshot.jpg — since the built-in Python module for Tkinter-based GUI does not support images as numpy arrays.
⭐ Then, show the snapshot image saved in the assets folder on the onboard touchscreen in order to notify the user of the latest captured camera frame.
⭐ Finally, store the latest image (depicted via the snapshot) resized according to the given model's frame sizes as the latest sample for further usage.
def take_snapshot(self, filename="assets/snapshot.jpg"): # Show the latest camera frame (snapshot) on UNIHIKER to inform the user. cv2.imwrite("./"+filename, self.latest_frame_s) self.cam_snapshot_img.config(image=filename) # Store the latest modified image sample on the memory. self.modified_image = self.latest_frame_m⭐ In the save_img_sample function:
⭐ If the user selects a pollution class via the built-in control button B (on UNIHIKER), create the file name of the image sample by adding the selected class and the collection date.
⭐ Then, save the latest stored frame to the samples folder via the built-in OpenCV functions and notify the user via the user interface (GUI).
def save_img_sample(self, given_class): if(given_class > -1): # Create the file name for the image sample. date = datetime.datetime.now().strftime("%Y%m%d_%H%M%S") filename = "IMG_{}_{}.jpg".format(self.class_names[given_class], date) # Save the modified image sample. cv2.imwrite("./samples/"+filename, self.modified_image) print("\nSample Saved Successfully: ./samples/" + filename) # Notify the user. self.cam_info_text.config(text="Saved: "+filename) else: self.cam_info_text.config(text="Please select a class.")#️⃣ Since UNIHIKER provides a built-in Python module tailored for displaying a Tkinter-based GUI on its onboard touchscreen (240 x 320), I was able to program the interactive user interface effortlessly.
#️⃣ Although the built-in module supports limited Tkinter features, I managed to create a multi-window user interface by shifting groups of GUI elements on and off-screen.
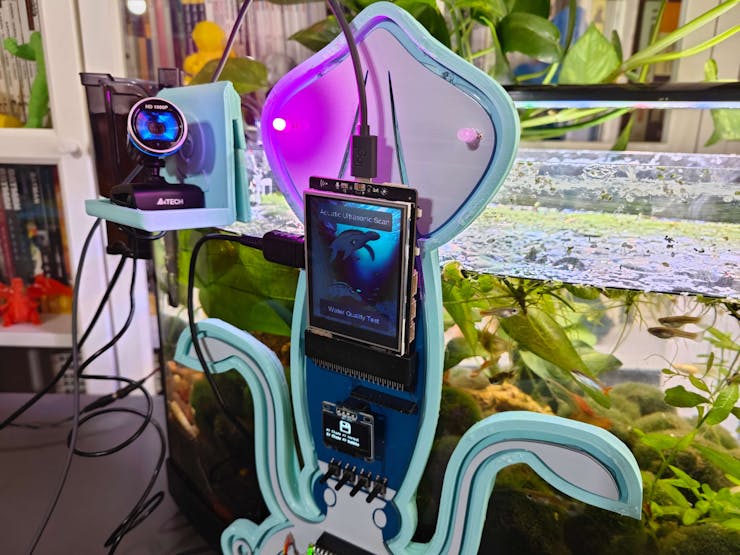
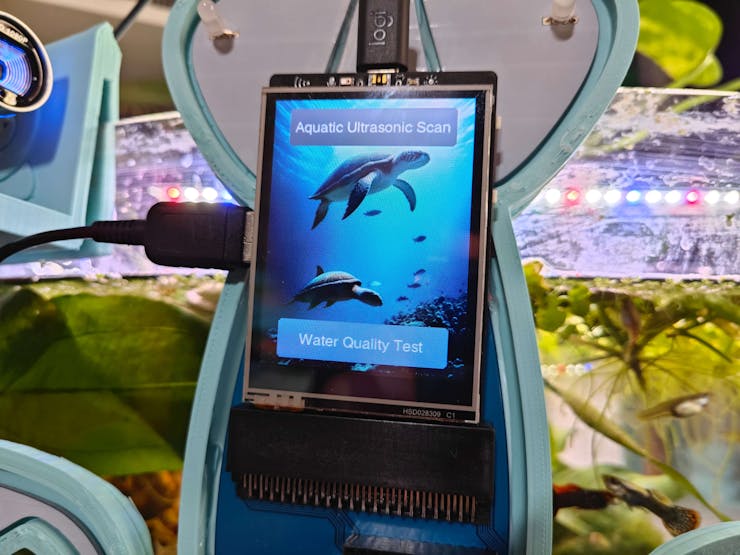
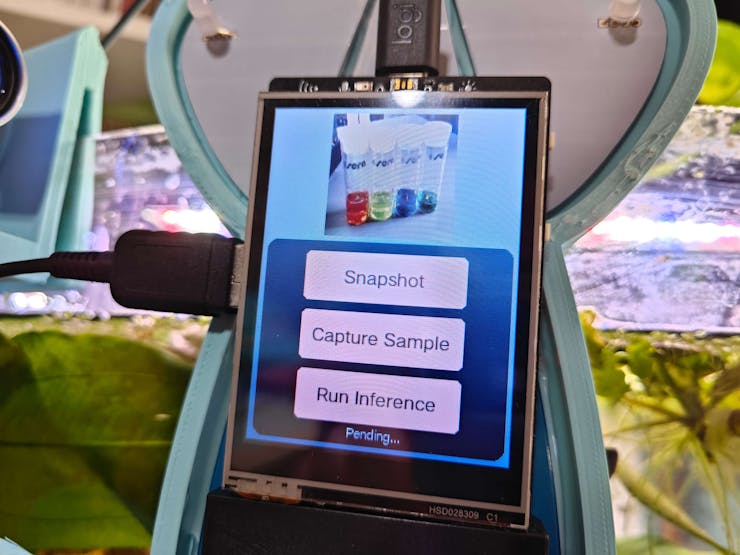
#️⃣ The interactive user interface (GUI) consists of three separate windows (layers):
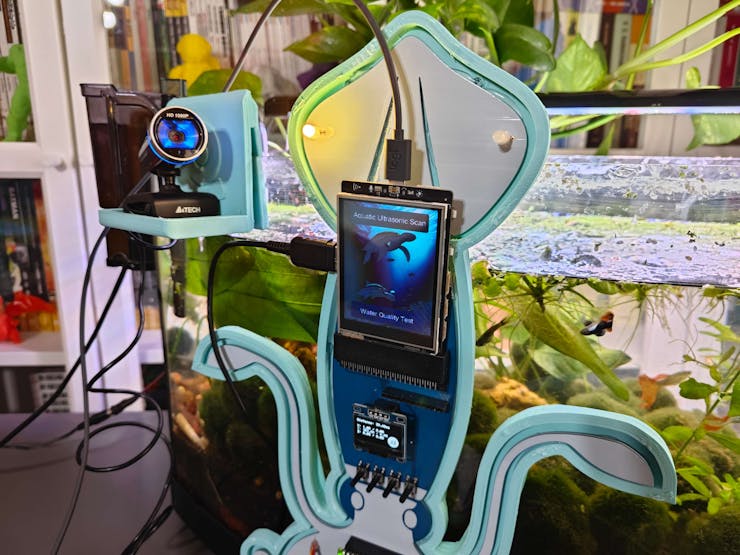
- Home
- Aquatic Ultrasonic Scan
- Water Quality Test
⭐ In the create_user_interface function:
⭐ Design the feature-rich user interface via the provided unihiker module.
⭐ Group the generated GUI elements and their screen coordinates into separate arrays for each interface section (layer) so as to navigate windows effortlessly.
⭐ To add callback functions to the GUI elements, utilize the onclick parameter (triggered when the element is clicked) and the lambda expression.
def create_user_interface(self, _x=120, _y=10, offset=15, origin="top_left"): # Design the user interface (GUI) via the built-in unihiker module. # Camera interface for AI-based chemical water quality test. self.cam_backg = self.interface.fill_rect(x=0, y=0, w=240, h=320, color="#9BB5CE") self.cam_snapshot_img = self.interface.draw_image(x=60, y=5, image="assets/cam_wait.jpg", origin=origin, onclick=lambda:self.interface_config("clear_class")) self.cam_section = self.interface.fill_round_rect(x=5, y=130, r=10, w=230, h=185, color="#215E7C") self.cam_run_button = self.interface.fill_round_rect(x=45, y=250, r=5, w=150, h=45, color="#FAE0D8", onclick=self.run_inference) self.cam_run_text = self.interface.draw_text(x=120, y=272, text="Run Inference", origin="center", color="#5C5B57", font_size=12, onclick=self.run_inference) self.cam_save_button = self.interface.fill_round_rect(x=45, y=195, r=5, w=150, h=45, color="#FAE0D8", onclick=lambda:self.save_img_sample(self.selected_class)) self.cam_save_text = self.interface.draw_text(x=120, y=217, text="Capture Sample", origin="center", color="#5C5B57", font_size=12, onclick=lambda:self.save_img_sample(self.selected_class)) self.cam_snap_button = self.interface.fill_round_rect(x=45, y=140, r=5, w=150, h=45, color="#FAE0D8", onclick=self.take_snapshot) self.cam_snap_text = self.interface.draw_text(x=120, y=162, text="Snapshot", origin="center", color="#5C5B57", font_size=12) self.cam_info_text = self.interface.draw_text(x=120, y=305, text="Pending...", origin="center", color="white", font_size=8) # Elements and coordinates — Camera. self.cam_int_vars = [self.cam_backg, self.cam_snapshot_img, self.cam_section, self.cam_run_button, self.cam_run_text, self.cam_save_button, self.cam_save_text, self.cam_snap_button, self.cam_snap_text, self.cam_info_text] self.cam_int_vals = [0, 60, 5, 45, 120, 45, 120, 45, 120, 120] # Ultrasonic sensor interface for AI-based ultrasonic imaging. self.ultra_backg = self.interface.fill_rect(x=0, y=0, w=240, h=320, color="#5C5B57") self.ultrasonic_img = self.interface.draw_image(x=20, y=0, image="assets/ultrasonic_temp.jpg", origin=origin, onclick=lambda:self.telegram_send_data("ultrasonic", "6465514194")) self.ultra_section = self.interface.fill_round_rect(x=5, y=205, r=10, w=230, h=110, color="#F9E5C9") self.ultra_ins_button = self.interface.fill_round_rect(x=45, y=260, r=5, w=150, h=35, color="#F5F5F0", onclick=lambda:self.make_a_get_request("get_model_result")) self.ultra_ins_text = self.interface.draw_text(x=120, y=277, text="Generate Image", origin="center", color="#5C5B57", font_size=12, onclick=lambda:self.make_a_get_request("get_model_result")) self.ultra_gen_button = self.interface.fill_round_rect(x=45, y=215, r=5, w=150, h=35, color="#F5F5F0", onclick=lambda:self.make_a_get_request("csv")) self.ultra_gen_text = self.interface.draw_text(x=120, y=232, text="Generate CSV", origin="center", color="#5C5B57", font_size=12, onclick=lambda:self.make_a_get_request("csv")) self.ultra_info_text = self.interface.draw_text(x=120, y=305, text="Pending...", origin="center", color="#5C5B57", font_size=8) # Elements and coordinates — Ultrasonic Sensor. self.ultra_int_vars = [self.ultra_backg, self.ultrasonic_img, self.ultra_section, self.ultra_ins_button, self.ultra_ins_text, self.ultra_gen_button, self.ultra_gen_text, self.ultra_info_text] self.ultra_int_vals = [0, 20, 5, 45, 120, 45, 120, 120] # Home screen. self.main_backg = self.interface.draw_image(x=0, y=0, image="assets/background.jpg", origin=origin, onclick=lambda:self.adjust_color([0,0,0])) self.main_ultra_button = self.interface.fill_round_rect(x=20, y=10, r=5, w=200, h=45, color="#5C5B57", onclick=lambda:self.interface_config("ultra")) self.main_ultra_text = self.interface.draw_text(x=120, y=32, text="Aquatic Ultrasonic Scan", origin="center", color="white", font_size=12, onclick=lambda:self.interface_config("ultra")) self.main_cam_button = self.interface.fill_round_rect(x=20, y=265, r=5, w=200, h=45, color="#9BB5CE", onclick=lambda:self.interface_config("cam")) self.main_cam_text = self.interface.draw_text(x=120, y=287, text="Water Quality Test", origin="center", color="white", font_size=12, onclick=lambda:self.interface_config("cam")) # Elements and coordinates — Home Screen. self.home_int_vars = [self.main_backg, self.main_ultra_button, self.main_ultra_text, self.main_cam_button, self.main_cam_text] self.home_int_vals = [0, 20, 120, 20, 120]⭐ In the board_configuration function:
⭐ Employ the built-in control buttons on UNIHIKER to provide a versatile user experience.
⭐ If the control button A (UNIHIKER) is pressed, navigate to the home screen.
⭐ If the control button B (UNIHIKER) is pressed, change the selected pollution class incrementally and adjust the background color of the Capture Sample button under the Water Quality Test section accordingly.
⭐ Also, adjust the secondary RGB LED according to the assigned class color.
def board_configuration(self): # Utilize the integrated sensors on UNIHIKER to provide a feature-rich user experience. while True: # If the control button A is pressed, return to the home screen. if button_a.is_pressed() == True: self.interface_config("home") sleep(1) # If the control button B is pressed, change the selected class. if button_b.is_pressed() == True: self.selected_class+=1 if self.selected_class == 3: self.selected_class = 0 self.cam_save_button.config(color=self.class_colors[self.selected_class]) if(self.selected_class == 0): self.adjust_color([0,1,0]) if(self.selected_class == 1): self.adjust_color([1,1,0]) if(self.selected_class == 2): self.adjust_color([1,0,0]) sleep(1)⭐ In the interface_config function:
⭐ Depending on the passed command, process the GUI elements and their screen coordinates grouped under separate arrays for each section to shift windows (layers) effortlessly.
⭐ If requested, clear the selected pollution class.
def interface_config(self, con, _hide=350): if(con == "home"): for i in range(len(self.home_int_vals)): self.home_int_vars[i].config(x=self.home_int_vals[i]) for i in range(len(self.cam_int_vals)): self.cam_int_vars[i].config(x=_hide) for i in range(len(self.ultra_int_vals)): self.ultra_int_vars[i].config(x=_hide) self.adjust_color([0,0,0]) elif(con == "cam"): for i in range(len(self.home_int_vals)): self.home_int_vars[i].config(x=_hide) for i in range(len(self.cam_int_vals)): self.cam_int_vars[i].config(x=self.cam_int_vals[i]) for i in range(len(self.ultra_int_vals)): self.ultra_int_vars[i].config(x=_hide) self.adjust_color([0,1,1]) elif(con == "ultra"): for i in range(len(self.home_int_vals)): self.home_int_vars[i].config(x=_hide) for i in range(len(self.cam_int_vals)): self.cam_int_vars[i].config(x=_hide) for i in range(len(self.ultra_int_vals)): self.ultra_int_vars[i].config(x=self.ultra_int_vals[i]) self.adjust_color([1,0,1]) elif(con == "clear_class"): self.selected_class = -1 self.cam_save_button.config(color="#FAE0D8") self.cam_info_text.config(text="Pending...") self.adjust_color([0,0,0])
![]()
![]()
-
17Step 9.2: Saving the captured images via the interactive user interface (GUI)
Since the captured camera frame size is not compatible with the object detection model, I utilized the built-in OpenCV features to resize the captured frame according to the required dimensions for both the model and the user interface (snapshot).
After executing the main.py file on UNIHIKER:
🐠📡💧📊 The device displays the home screen, showing two main sections, on the built-in touchscreen of UNIHIKER.
- Aquatic Ultrasonic Scan
- Water Quality Test
![]()
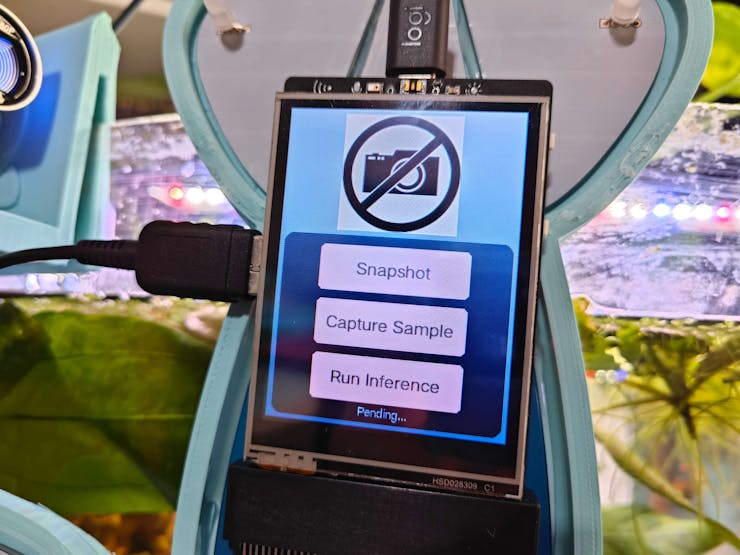
🐠📡💧📊 If the user clicks the Water Quality Test button, the device opens the Water Quality Test section.
🐠📡💧📊 While obtaining real-time frames produced by the high-quality USB webcam, the device resizes the latest captured camera frame depending on the provided image frame size of the Edge Impulse object detection model.
🐠📡💧📊 Also, the device resizes the same frame as a smaller snapshot of the latest captured camera frame.
![]()
🐠📡💧📊 When the user clicks the Snapshot button, the device saves the latest generated snapshot image to a temporary image file since the built-in Python module for Tkinter-based GUI does not support images as numpy arrays. Then, the device stores the latest frame modified by the model frame size.
🐠📡💧📊 After saving frames, the device shows the latest snapshot image on the onboard touchscreen in order to notify the user of the latest stored camera frame.
![]()
![]()
![]()
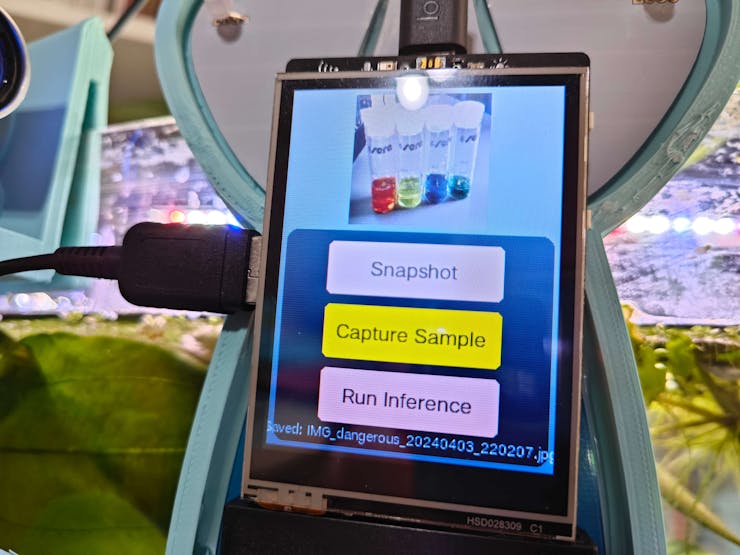
🐠📡💧📊 If the user clicks the onboard control button B (on UNIHIKER), the device changes the selected pollution class incrementally and adjusts the background color of the Capture Sample button according to the assigned class color.
- Green ➡ sterile
- Yellow ➡ dangerous
- Red ➡ polluted
🐠📡💧📊 After selecting a pollution class successfully, the device lets the user save an image sample by clicking the Capture Sample button.
🐠📡💧📊 To construct a comprehensive image data set, the device adds the selected class (label) and the collection date to each image sample file name.
IMG_sterile_20240330_120423.jpg
![]()
![]()
![]()
![]()
![]()
After collecting image samples of chemical water quality test results (color-coded), I constructed a valid and notable image data set for the object detection model.
-
18Step 10: Building a neural network model w/ Edge Impulse Enterprise
As explained earlier, I set up a freshwater aquarium to simulate the harsh fish farm conditions leading to noxious air bubbles lurking in the underwater substrate.
Then, I utilized the URM15 (waterproof) ultrasonic sensor to generate ultrasonic scan buffers of the bottom of the tank, consisting of 400 data points as a 20 x 20 ultrasonic image. While collecting and saving aquatic ultrasonic scan buffers, I empirically differentiated the produced samples (data records) depending on the presence of toxic air bubbles:
- normal
- bubble
When I completed collecting aquatic ultrasonic scan data buffers via the web application, I started to work on my artificial neural network model (ANN) to identify toxic underwater air bubbles manifesting potential water pollution risk.
Since Edge Impulse provides developer-friendly tools for advanced AI applications and supports almost every development board due to its model deployment options, I decided to utilize Edge Impulse Enterprise to build my artificial neural network model. Also, Edge Impulse Enterprise incorporates state-of-the-art machine learning algorithms and scales them for edge devices such as Nano ESP32.
Furthermore, Edge Impulse provides an accessible tool named CSV Wizard, which lets the user inspect a single CSV file, select the data type, obtain the label and data item fields from the given header, and register the configuration settings for the subsequent CSV files.
Since I employed the web application to follow the steps below to generate a pre-formatted CSV file from all ultrasonic scan buffer samples saved as text files and to sort data items, I was able to process my data set effortlessly so as to train my neural network model accurately:
- Data Scaling (Resizing)
- Data Labeling
After processing my data set, I decided to apply an advanced machine learning algorithm to train my neural network model, considering the unique and intricate structure of aquatic ultrasonic imaging data. After conducting various experiments with different model classifiers on Edge Impulse, I employed the Ridge classifier supported by Edge Impulse Enterprise since it has provided the most accurate precision results for identifying underwater air bubbles.
As a logistic regression method with L2 regularization, the Ridge classification combines conventional classification techniques and the Ridge regression for multi-class classification tasks. Since the integrated L2 regularization lets the user penalize unnecessary features to enhance the model performance and control the penalization rate, the Ridge classifier gives the trained model the ability to adapt classification results to a regression framework and prevent overfitting via the adjusted hyperparameter alpha, regulating how the penalty affects the model coefficients.
Plausibly, Edge Impulse Enterprise allows building predictive models with enhanced machine learning algorithms optimized in size and accuracy and deploying the trained model as an Arduino library. Therefore, after formatting and processing my data set, I was able to build a valid neural network model with the Ridge classifier to identify toxic underwater air bubbles and run the optimized model on Nano ESP32 without any additional requirements.
You can inspect my neural network model with the Ridge classifier on Edge Impulse as a public project.
-
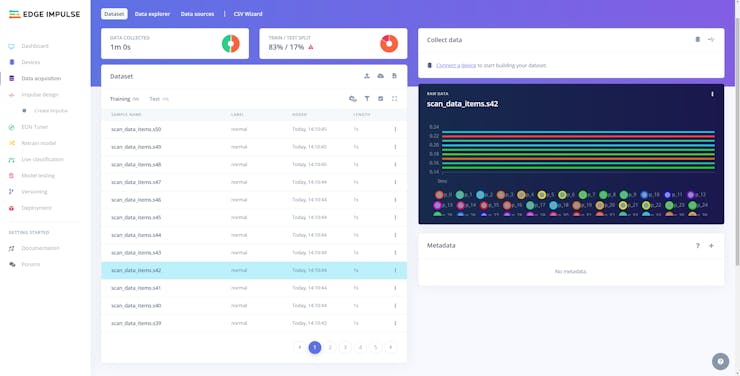
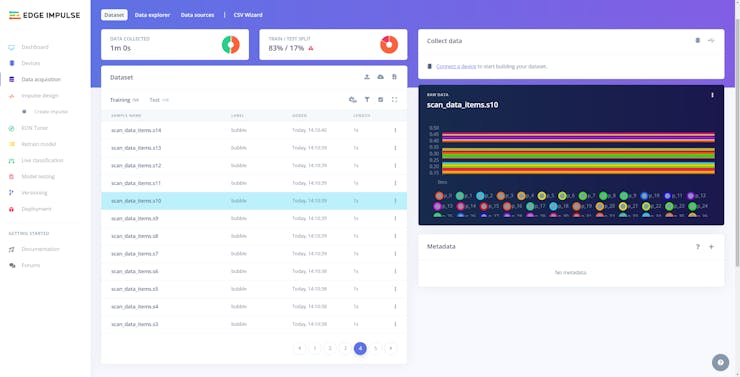
19Step 10.1: Uploading and processing samples
After generating training and testing samples successfully, I uploaded them to my project on Edge Impulse Enterprise.
#️⃣ First of all, to utilize the incorporated tools for advanced AI applications, sign up for Edge Impulse Enterprise.
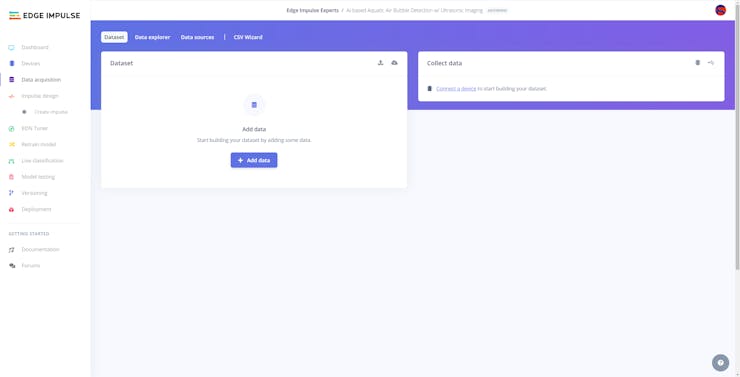
#️⃣ Then, create a new project under your organization.
![]()
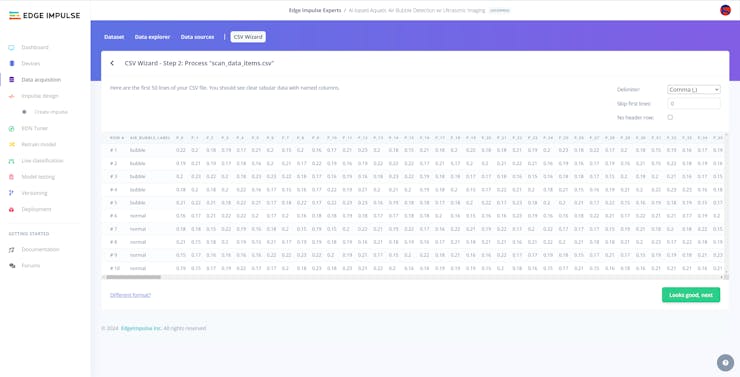
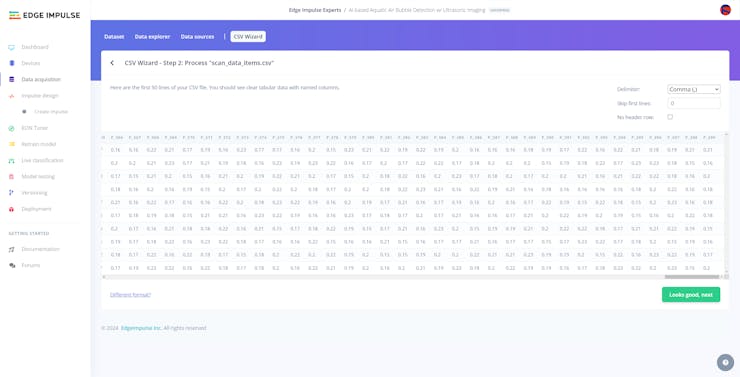
#️⃣ Open the Data acquisition page and go to the CSV Wizard section.
![]()
![]()
#️⃣ Upload a CSV file as an example to set the configuration settings (rules) for processing files via CSV Wizard.
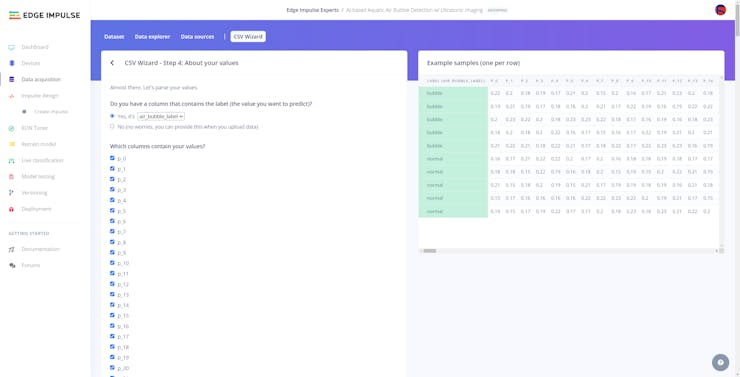
#️⃣ Define the data structure (time-series data or not) of the records in the passed CSV file.
#️⃣ Select the column (data field) containing labels for the given data records.
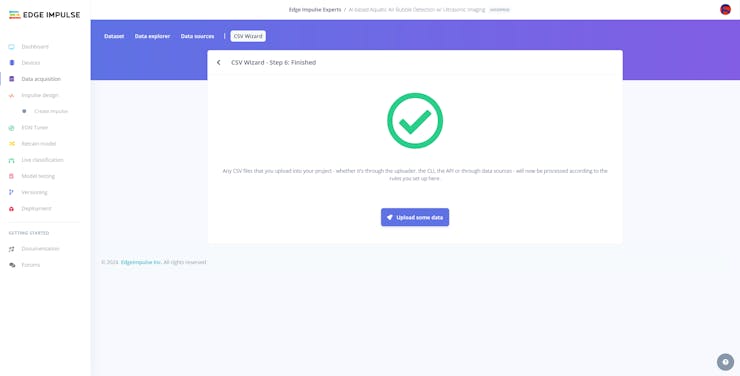
#️⃣ Then, determine the columns containing values to split a data record into data items and click Finish wizard.
![]()
![]()
![]()
![]()
![]()
![]()
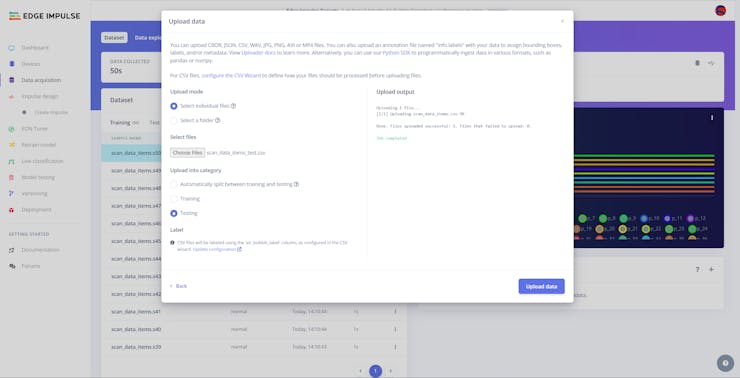
#️⃣ After setting the CSV rules, navigate to the Data acquisition page and click the Upload data icon.
![]()
#️⃣ Choose the data category (training or testing) and select a CSV file.
#️⃣ Then, click the Upload data button to upload samples labeled automatically with the values in the specified column (data field).
![]()
![]()
![]()
![]()
![]()
![]()
-
20Step 10.2: Training the model on aquatic ultrasonic scan buffers
After uploading and labeling my training and testing samples successfully, I designed an impulse and trained the model to identify noxious underwater air bubbles.
An impulse is a custom neural network model in Edge Impulse. I created my impulse by employing the Raw Data processing block and the Classification learning block.
The Raw Data processing block generates windows from data samples without applying any specific signal processing procedures.
The Classification learning block represents a Keras neural network model. This learning block lets the user change the model classifier, settings, architecture, and layers.
#️⃣ After navigating to the Create impulse page, select the Raw Data processing block and the Classification learning block. Then, click Save Impulse.
![]()
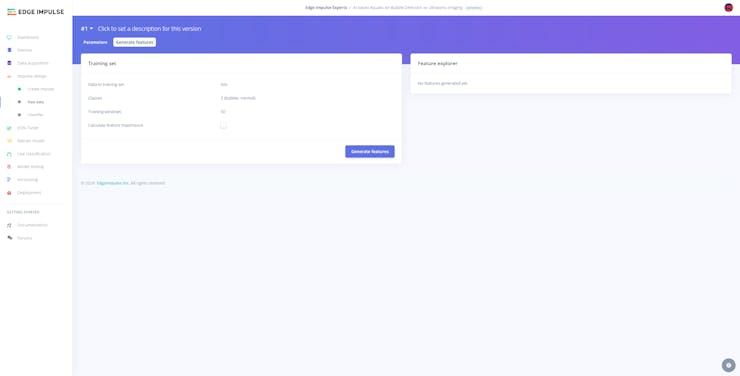
#️⃣ Before generating features for the neural network model, go to the Raw data page and click Save parameters.
![]()
#️⃣ After saving parameters, click Generate features to apply the Raw Data processing block to training samples.
![]()
![]()
#️⃣ Then, navigate to the Classifier page.
#️⃣ To change the default model classifier, click the Add an extra layer button and select the scikit-learn Ridge classifier employing L2 regularization.
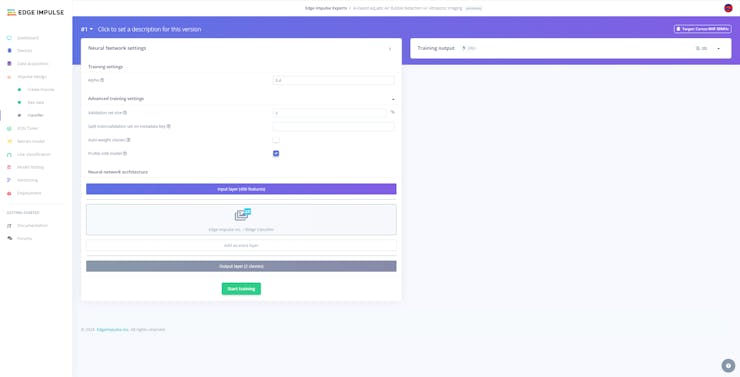
#️⃣ After configuring the model classifier, click Start training.
![]()
![]()
![]()
According to my experiments with my neural network model with the Ridge classifier, I modified the classification settings and the hyperparameter alpha to build a neural network model with high accuracy and validity:
📌 Neural network settings:
- Alpha ➡ 0.4
- Validation set size ➡ 5
After generating features and training my model with training samples, Edge Impulse evaluated the precision score (accuracy) as 100%.
The precision score (accuracy) is approximately 100% due to the modest volume of validation samples of ultrasonic scan buffers demonstrating toxic underwater air bubbles. As compared to other supported classifiers, the Ridge classifier produced the most accurate detections after adjusting the regularization strength according to my data set. Since I configured my neural network model to conform to my aquarium's conditions, I highly recommend retraining the model with aquatic ultrasonic scan samples from the targeted fish farm before running inferences to identify underwater air bubbles.
![]()
![]()
AI-based Aquatic Ultrasonic Imaging & Water Test
Identify noxious air bubbles lurking in the substrate w/ ultrasonic scans and assess water pollution based on chemical tests simultaneously.


Discussions
Become a Hackaday.io Member
Create an account to leave a comment. Already have an account? Log In.
Wow pretty amazing work and description of it. Thanks so much for sharing. Pretty interesting work with the ultrasonic sensor - still grokking your direction. Wow.!!
I wonder did you post/release the ESP32 software anywhere , gitxxx?
Are you sure? yes | no
Thanks for your kind words :)
I only posted my code files here:
https://www.hackster.io/kutluhan-aktar/ai-based-aquatic-ultrasonic-imaging-chemical-water-testing-f6b233#code
Are you sure? yes | no