 Nelson Phillips
-
1powering up
This device is able to run via a usb-c plugged into a computer(power source) or by 9v battery. The process is the same, other than a computer can send command for saving data to a computer file for later analysis.
![]()
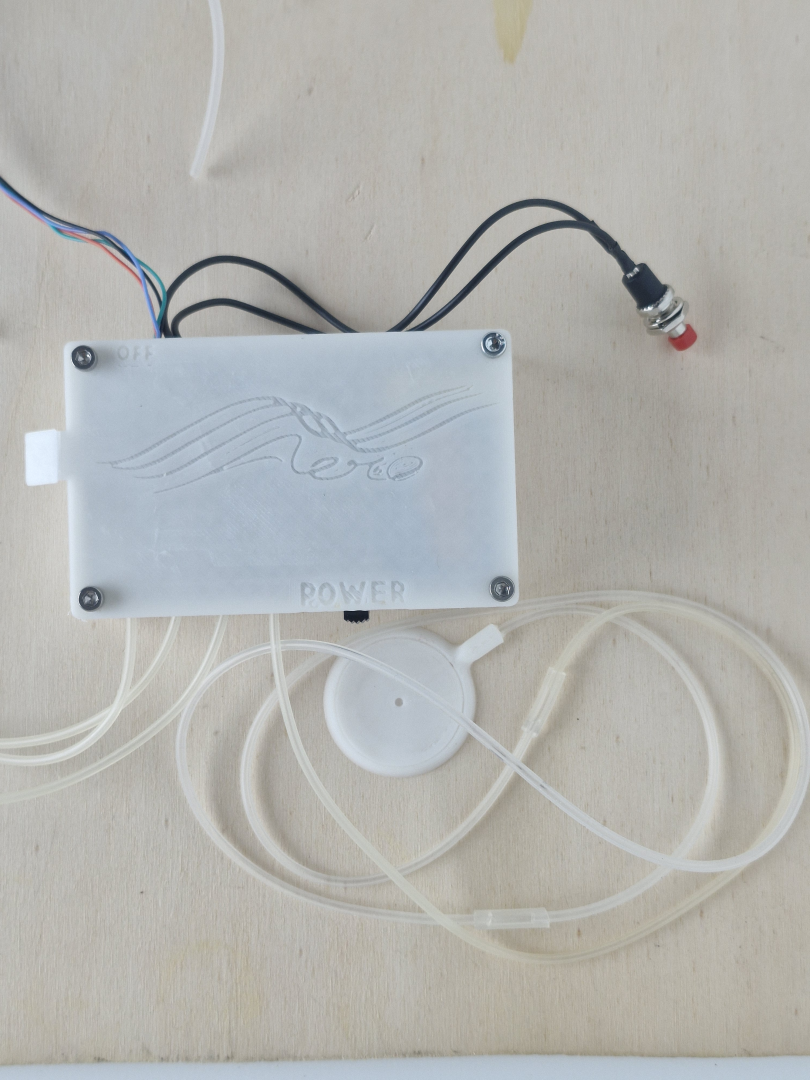
When the device is turned on, automatically with a usb cable, with a battery installed via the power switch the green light become apparent.
![]()
![]()
-
2gathering data - Basic kit
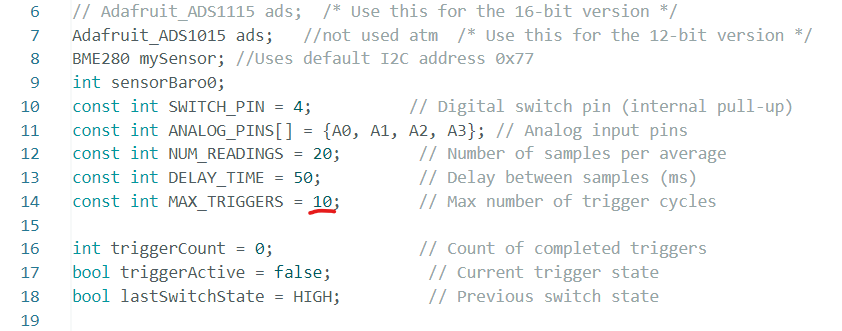
Using a battery; after powering up the device it would be a good idea to set a baseline measurement by triggering it using the red button. This first measurement will be labelled "trigger 0" in the data. The data will be read from the four main analog sensors for 1s and then averaged to be stored in the EEPROM(memory). After this another data set can be trigger by pressing the button again, up to ten times unless the code is changed.
![]()
Subsequent data measurements are trigger by sliding the switch which will save data to sequential "trigger 1, 2, 3,....." labels.
![]()
Each time the microcontroller is switched off and powered up again the trigger count resets and over writes the data from each triggered data set.
-
3fetching the data -Basic Kit
After gathering the data it is stored in the microcontroller memory and needs to be extracted for analysis in a spreadsheet. The device can be switched off and it needs to be plugged into a computer via a usb-c cable for the data to be extracted. This doesn't need to be done immediately as the data will be there until it is over written with the next data gathering set.
The Arduino ide software can be used for this via its serial interface by copying and pasting it, Or Processing4 software can be used through running the .pde UI file. This creates a csv file where the UI file is saved.
![]()
When the device is plugged into the computer the serial port needs to be the same as that in the .pde code and change accordingly, a warning will remind you if it needs to be done.
![]()
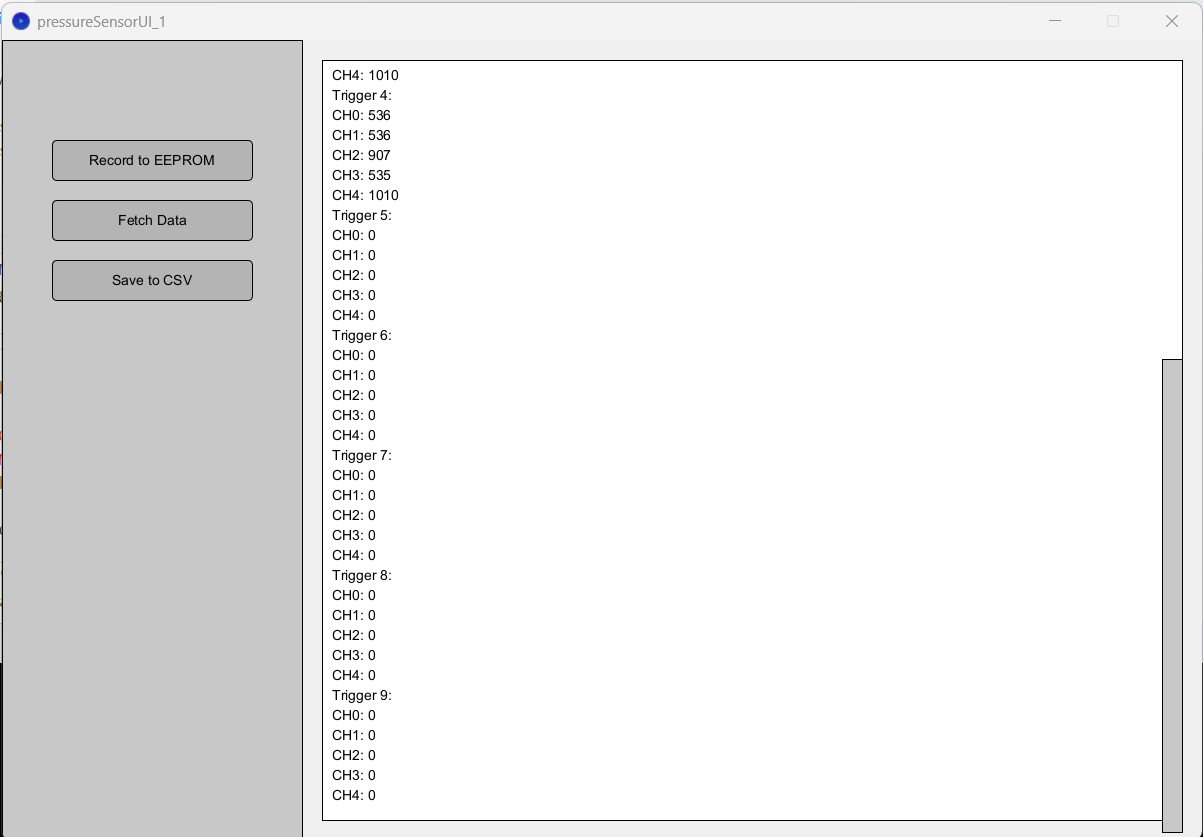
With the UI code interfacing the device there are three clickable buttons on the left. The second one will fetch the data from the microcontrollers memory and writes it to the dialog box. After this is done the third button will write this data to an unique file.
-
4using the data
The output of the data when loaded into the UI by clicking the fetch button will print all the data recorded and zeros for all the empty data set, this will changed.
![]()
Pressing save to CSV now will create a unique file and reset the eeprom data with zeros.
![]()
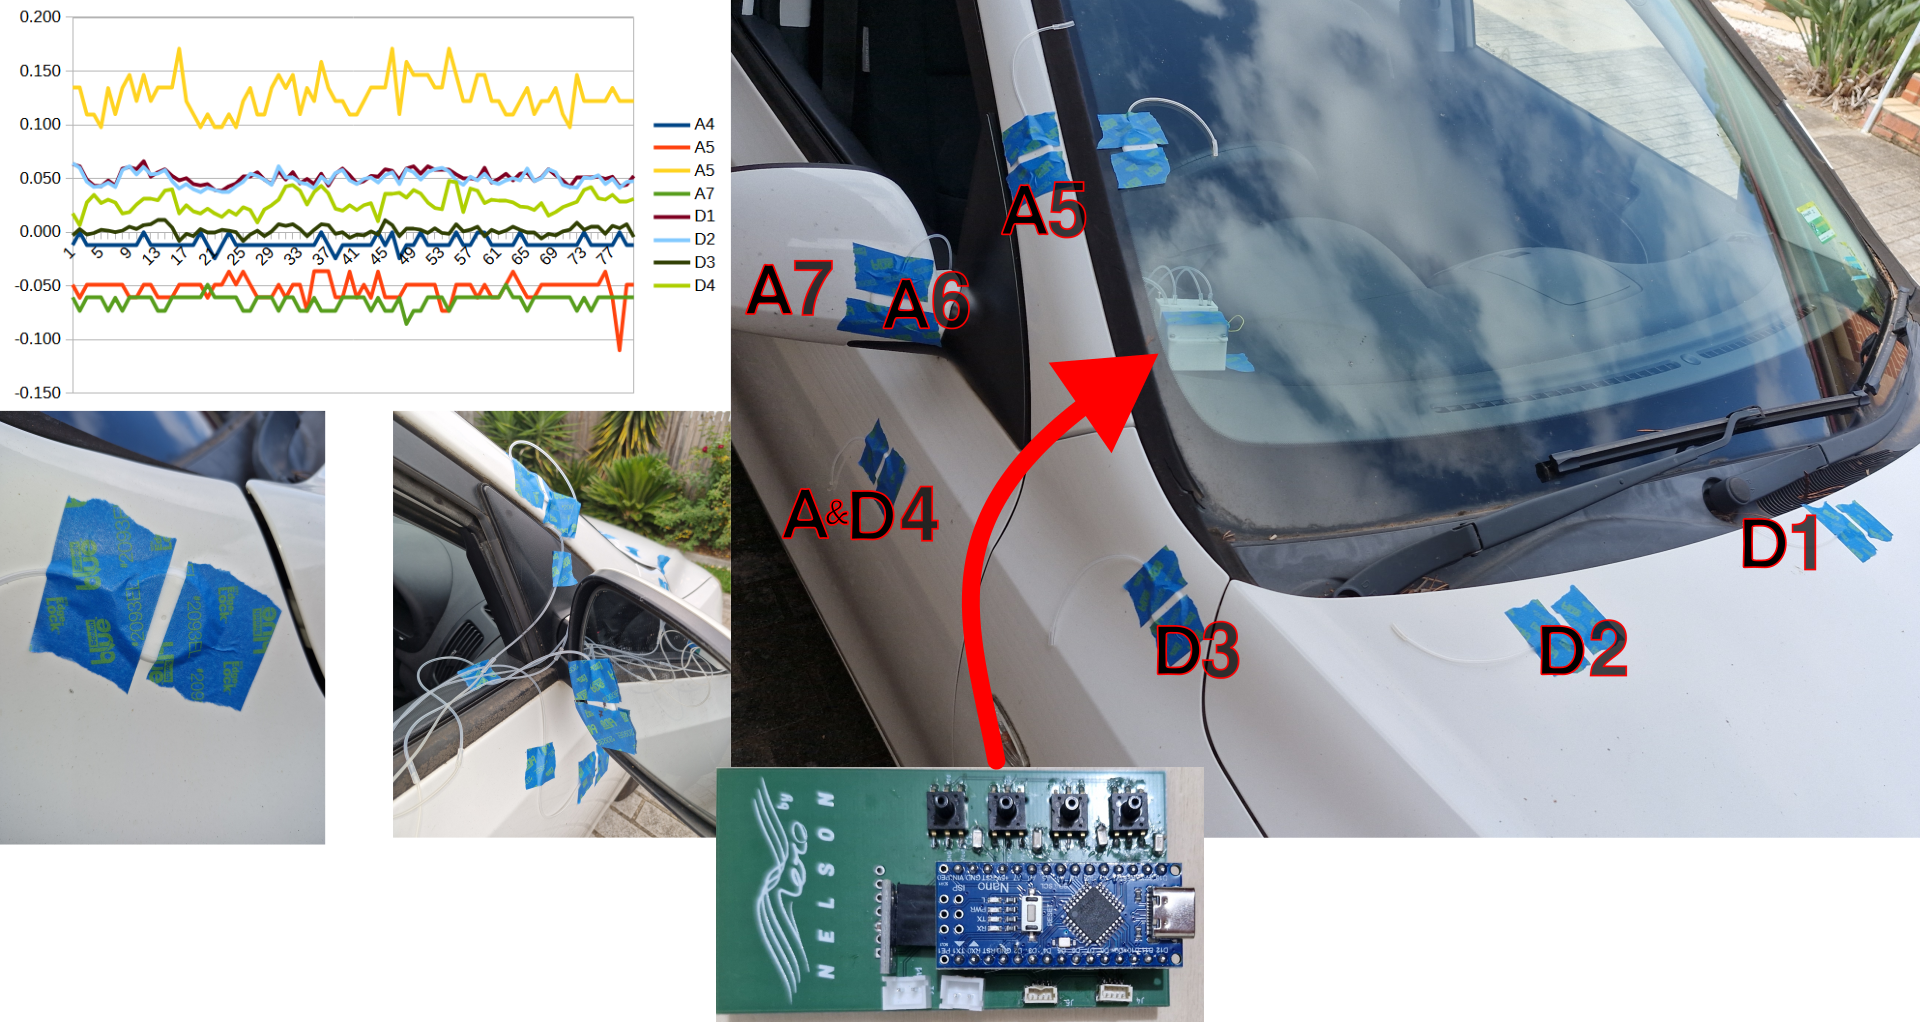
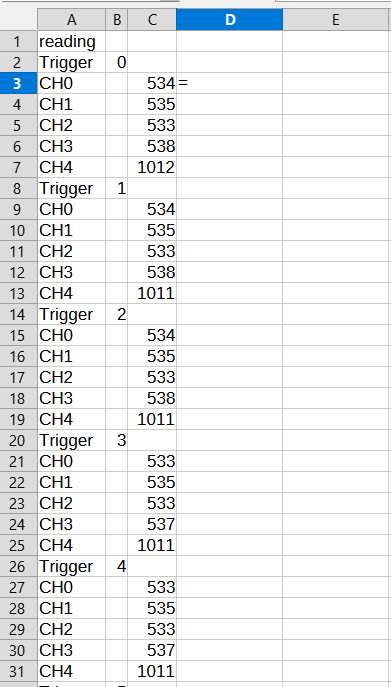
loading it into a spreadsheet we are presented with the raw analogue read values from the 10bit register. Channel 4 is the absolute atmospheric pressure in pascals(pa).
The pressure sensor measures from -5kpa - 5kpa with an output of 0.5v - 4.5v. Converting that into the analogue output is from 102 to 922 and the zero should be 512. Depending on the supply voltage this may drift a little, zero should be taken as the trigger 0 value and is 534-538 in the above image. Each bit represents 12.2pa so the baseline is important to maintain accuracy.
![]()
A crude conversion -- is you take the values of the first data set and copy and paste the equation onto the following data sets and each bit change is represented as a 12.pa increment.
With digital measurements the last bit will be flipping constantly so the accuracy that this kit gives is to
![]()
There is methods to increase this accuracy by applying sensors at different speeds and increasing the number of sample sets.
-
5gathering the data - advanced kit
The setup is a little different for this advanced kit, as there are two sets of code that needs to be flashed to the microcontroller. One is for the data recording and the other is for communicating to the UI to access the memory. Then if the data needs to be erased from the memory chip, an additional program needs to be loaded.
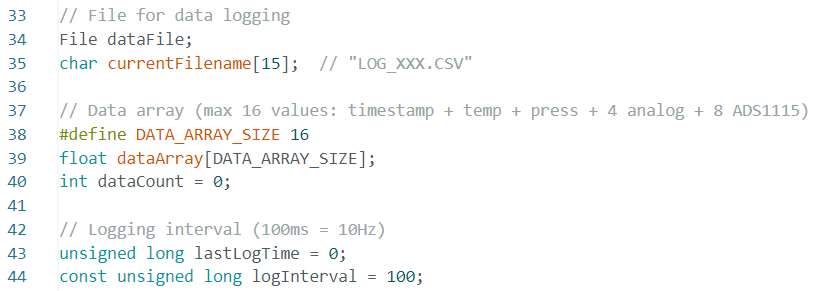
The data recording code must be flashed to the microcontroller. After this it is functionally the equivalent to the basic kit. This time all the data is recorded and stored by the kit with no averaging. Each time the red button is pressed to trigger a data set and it creates a unique file. In this set of data points one is added every 100ms until the red button is pressed again to stop the recording. The frequency of the recording data points can be increased in the code if it is thought necessary from the 10Hz as seen on line 44.
![]()
-
6fetching the data - Advanced kit
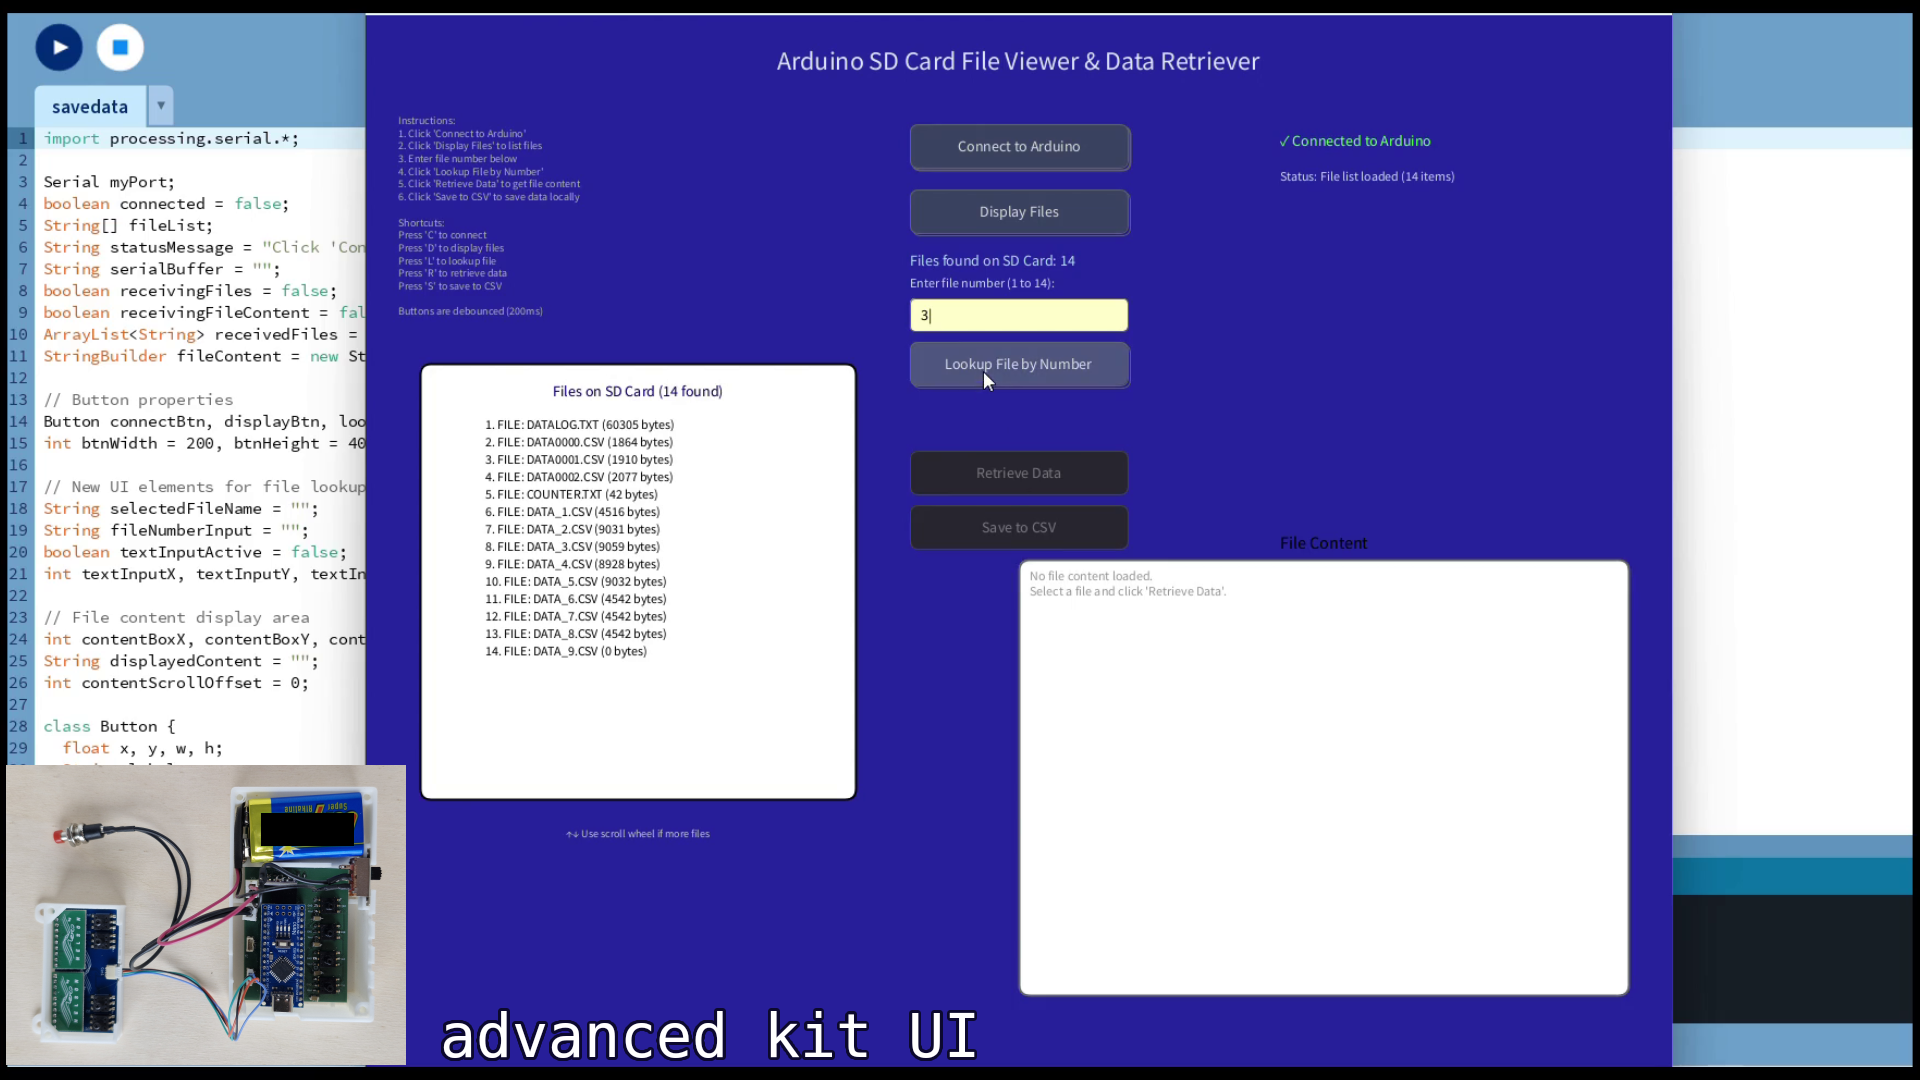
A separate Arduino file for interfacing with the UI is required to be flashed to the controller before the Processing4 software can extract the stored file. The UI is a crude interface but setup to follow the process in an obvious manner. Connecting to the Arduino is more straight forward than the basic kit, where the software will detect the serial port and connect to the kit by pressing the top button. It will give feedback to whether this was successful or not. If successful the following button can be pressed to retrieve the file names that will be displayed. The file that you want to extract needs its indexed number typed into the dialogue box and then the next button is pressed to display the data to be transferred to the computer. If the displayed data isn’t from the right file, reenter the alternative file number in the dialogue box. The save button will transfer the data to the computer with the same name and stored where the Processing4 code is situated. Video of the process is available on the YouTube page.
![]()
Air Pressure Sensor Kit
Here you can access all the resources and files for this air pressure kit.


Discussions
Become a Hackaday.io Member
Create an account to leave a comment. Already have an account? Log In.