Close
0%
0%

Turning Impedance into Frequency: An LC Experiment

Arduino + Franklin oscillator

Similar projects worth following
I did not start this project to build a high-precision LC meter.
I started because I was fascinated by the structure of the Franklin oscillator itself.

By converting impedance into frequency, the problem becomes something a microcontroller handles naturally.
The oscillator runs in Class-A phase-shift mode, allowing stable observation of LC resonance.

Instead of fighting oscillator errors, I focused on differential measurements.
In the end, the accuracy majarly depends on only one thing: the reference capacitor.

While researching the origin of this LC meter approach, I found that the core idea is much older than microcontrollers.

The oscillator itself traces back to the 1920s, when Mr. Franklin at Marconi described what is now known as the Franklin oscillator: an LC resonator combined with a phase-inverted amplifier.

The history

Much later, in 1988, Dr. Hegewald in East Germany applied this principle to an LC meter concept using a microcontroller. This idea was later popularized by Neil Heckt through AADE, where he sold LC meter kits and openly shared both the circuit and the PIC firmware. The design was also described in detail by Phil Rice (VK3BHR) in an Australian amateur radio magazine.

What fascinated me is not absolute accuracy, but how naturally this circuit maps an analog impedance problem into a frequency domain that a microcontroller can handle very well. By focusing on differential measurements and a known reference capacitor, the system becomes simple, transparent, and easy to verify.

I’ve noticed that many builds closely replicate the original AADE design, which is perfectly valid. However, fewer people seem to change both the analog front end and the microcontroller itself.

By simplifying the implementation and using Arduino, my goal was to make such experimentation easier. In one case, this approach even led someone to re-implement the design again using a PIC, after first studying both versions.

This project is my attempt to revisit that idea with modern low-cost MCUs, while keeping the same spirit of simplicity and openness.

The principle

I think the principle behind this meter is very clever.

An additional element is temporarily added to the LC resonant circuit, and the oscillation frequency is measured. By comparing this frequency with that of the original LC circuit, the value of the added element can be derived by solving a simple set of simultaneous equations.

The measurement is divided into two steps. In the calibration step, a high-precision reference capacitor is added to the LC tank to determine the base LC parameters. In the measurement step, the element under test is added instead, the frequency is measured again, and its value is calculated from the difference.

By relying on frequency differences rather than absolute values, this approach naturally reduces errors caused by stray inductance and parasitic effects.

LTSpice simulation

First, I used LTSpice analysis to verify that the Franklin oscillator circuit works with an LC tank circuit and an inverting amplifier using a 74HCU04. I imported the .asy and .lib files related to the 74HC and performed a simulation as follows:

(1) Download the schematic from the link below and place it in the LTspice sym folder under the file name 74hcu04.asy.
http://ltwiki.org/files/LTspiceIV/lib/sym/Dig_Add/74HC/74hcu04.asy

This will become the circuit diagram data, and it will appear when you select it in the Component menu.

(2) Import the simulation data from the following location into the 74HC-related directory using 74HC.lib:
http://ltwiki.org/files/LTspiceIV/lib/sub/74hc.lib
Specify it as available for calling via Edit → SPICE Directive. (This is referenced when 74hcu04.asy calls the 74hcu04 simulation data.)
.lib 74hc.lib

(3) 74hcu04.asy requires an external power supply of 5V via "Vcc." Add a DC power supply and specify Vcc.

(4) Oscillation will not start unless initial operating conditions are set, so I set .ic V(n003) = 1V in Edit → SPICE Directive.

The circuit diagram for simulation is as follows.
LCM_FRANCLIN_HCU04_HC.asc

- The sketch overview

To count the frequencies: start measurement
→ wait for stable oscillation
→ count pulses for gate time "To refer FreqCount Library"
→ average N times until the adjacent frequencies are within 0.5%

→ output frequency

Calibration flow
→ measure freq1
→ insert Cref  by turning on the relay
→ measure freq2
→ solve L,C of base tank
→ store parameters

Measuring flow
→ insert DUT
→ measure...

Read more »

OSC_CIR2.jpg

JPEG Image - 110.01 kB - 03/09/2026 at 14:11

Preview

LCM_FRANCLIN_HCU04_HC.asc

asc - 1.71 kB - 01/28/2026 at 11:49

Download

LCM_CIRC.png

The circuit diagram

Portable Network Graphics (PNG) - 23.31 kB - 01/23/2026 at 14:25

Preview

Equation+Circuit2.jpg

This is how to get the inductance value from the frequencies..

JPEG Image - 128.68 kB - 01/23/2026 at 12:53

Preview

  • 1 × 74HCU04 Logic ICs / Gates and Inverters
  • 1 × Arduino nano or ATmega328P

  • Video walkthrough: LC meter V7 — the first DPDT switch version

    nobcha03/19/2026 at 12:23 0 comments

    Before V8, there was V7 — the first version to replace the relay with a DPDT switch. Here is a complete walkthrough video.

    VIDEO
    What the video covers:

    Overview and key specifications
    Parts list before assembly
    KiCad PCB design walkthrough
    3-step calibration procedure
    Measurement examples (inductance and capacitance)
    Diagnostic screen (DIAG mode)

    V7 established the core concept of manual calibration with a DPDT switch. V8 then refined the sketch — reducing flash usage from 95% down to 80% and restructuring the code for readability.
    If you are considering building your own, V8 is the recommended starting point:
    👉 https://github.com/Nobcha/ARD_LCM_MANUAL

  • "How does my DIY LC meter compare to a nanoVNA? — A practical inductance measurement shootout"

    nobcha03/10/2026 at 14:10 0 comments

    I originally assumed the nanoVNA would be the clear winner for inductance measurement. It's a vector network analyzer after all. So I ran a direct comparison using the same set of sample inductors across three methods: LC meter V2.4, LC meter V8, and nanoVNA with a 50Ω adapter (S11 measurement).

    The setup
    For nanoVNA measurements, I used a simple 50Ω adapter — a 100Ω chip resistor in parallel, placed in series with the inductor under test at the terminal. This shifts the Smith chart operating point toward the center for typical inductance values, improving readability.


    The three instruments compared:

    LC meter V2.4 — Franklin oscillator (74HCU04) + Arduino Nano, relay-switched Cref
    LC meter V8 — Franklin oscillator (74HCU04) + ATmega328P, DPDT-switch Cref, LIPO powered
    nanoVNA — standalone S11 reading (no PC connection)

    Results summary


    Several things stood out immediately:

    The 10mH inductor could not be measured by the nanoVNA with this adapter configuration. The LC meters handled it without issue.
    The 100μH inductor showed anomalous readings on the nanoVNA, likely due to self-resonance effects pushing the measurement point far from 50Ω — the adapter is simply not optimized for that impedance range.
    Both LC meter versions agreed well with each other across most of the range.

    A key insight: readability vs. generality
    The nanoVNA's Smith chart representation is powerful for distributed-circuit thinking — useful for antenna and transmission line work. But when designing at HF or VHF where coils are treated as lumped elements, a direct inductance reading in µH or nH is simply more actionable. You don't want to interpret a Smith chart position every time you're winding a toroidal coil for an ATU-100 or a band-pass filter.
    In this sense, the LC meter wins on readability for everyday coil-winding and verification work.

    An honest limitation
    Stray inductance in the measurement terminal wiring is not cancelled by the calibration procedure. This means accuracy degrades for very small inductances — the kind you'd encounter with a few turns of heavy wire on a small former. PCB layout optimization at the measurement terminals would help here.

    What this suggests for future development

    There is one area where the current Franklin oscillator LC meter falls short: the oscillation frequency is fixed in the 1–2 MHz range by the tank circuit. Real-world air-core coils used at VHF (50MHz+) have frequency-dependent inductance — so a measurement at 1.5 MHz may not reflect the actual inductance at operating frequency.
    A worthwhile improvement would be to offer a high-frequency tank circuit option — a separate terminal or switch position optimized for air-core coil measurement at higher oscillation frequencies (e.g., 10–30 MHz). This would make the instrument more relevant for VHF coil work. Something to explore in V9, perhaps.

    Full details

    GitHub (V2.4): https://github.com/Nobcha/ArduinoLCM
    http://chitose6thplant.web.fc2.com/LCM/Arduino_LCM_EXP.htm


    GitHub (V7/V8): https://github.com/Nobcha/ARD_LCM_MANUAL
    https://chitose6thplant.fc2.page/lc-meter-v7-dpdt-calibration-3-steps-layers-pcb-model/


    Blog (Japanese, with measurement table): https://nobcha23.hatenablog.com/entry/2026/03/09/220241

  • Why I replaced the relay with a DPDT switch — and why manual calibration is a feature

    nobcha03/09/2026 at 15:15 0 comments

    In earlier versions of this LC meter (up to V6), calibration was handled automatically by a relay. The relay would insert the reference capacitor into the tank circuit at the start of each measurement session. Simple, automatic — but not without problems.

    Problems with the relay approach

    Cost: small signal relays suitable for ~1.5 MHz switching are not cheap

    Availability: sourcing a consistent relay across builds was annoying

    The V7 solution: a 6P DPDT switch

    I replaced the relay with a readily available 6-pin double-pole double-throw (DPDT) switch. The switch physically inserts or removes the reference capacitor from the LC tank — the same function, but done by hand.

    This makes calibration a conscious 3-step manual operation:

    Set switch to CAL position

    Press the calibration button — the sketch measures f1 and f2, solves for L and C of the tank

    Set switch to MEASURE position — ready to use

    "Manual calibration is a feature, not a bug"

    Once you understand that calibration only needs to be done once per power-on (or when ambient temperature changes significantly), the manual switch becomes perfectly acceptable. In fact, it makes the measurement process more transparent — you always know exactly what state the circuit is in.

    The sketch for V7 is available on GitHub, along with the KiCad PCB files and assembly manual (English and Japanese):

    👉 https://github.com/Nobcha/ARD_LCM_MANUAL

    A detailed build log is also on my blog:

    👉 https://chitose6thplant.fc2.page/lc-meter-v7-dpdt-calibration-3-steps-layers-pcb-model/

    One note on the PCB

    The first version of the V7 PCB had three errors (OLED header pinout, R6/R7 silkscreen, ICSP header). These are documented in the repository as a "Mistake prevention list." A corrected schematic is also included.

    Next up: V8, where the sketch was restructured to reduce flash usage from 95% down to 80%, making room for future improvements.

    kpa radio ©nobcha 

  • I added the OLED version

    nobcha02/13/2026 at 09:30 0 comments

    The LCD is connected via I2C, so I replaced it with an OLED 128x64 and rewrote the sketch. I uploaded it to GITHUB as V6.4. 

  • PCB pattern design

    nobcha02/03/2026 at 16:04 0 comments

    I used KiCAD and uploaded the Gerber files on GITHUB.

  • ​What SPICE shows about a Franklin oscillator

    nobcha01/28/2026 at 11:54 0 comments

    I used LTSpice analysis to verify that the Franklin oscillator circuit works with an LC tank circuit and an inverting amplifier using a 74HCU04.

  • I added the short history and the principle.

    nobcha01/25/2026 at 09:21 0 comments

    I found the history for this meter. I'm interested in the principle how to measure the values.

  • To derive the tank parameters (C1 and L1)

    nobcha01/23/2026 at 14:11 0 comments

    At first, the tank parameters (C1 and L1) are derived by adding a known standard capacitor to the tank. Please refer the equation note.

  • nobcha

    nobcha01/18/2026 at 13:42 0 comments

    Why a Franklin Oscillator, Not a Precision LC Meter.

View all 9 project logs

Enjoy this project?

Share

Discussions

nobcha wrote 03/19/2026 at 10:14 point

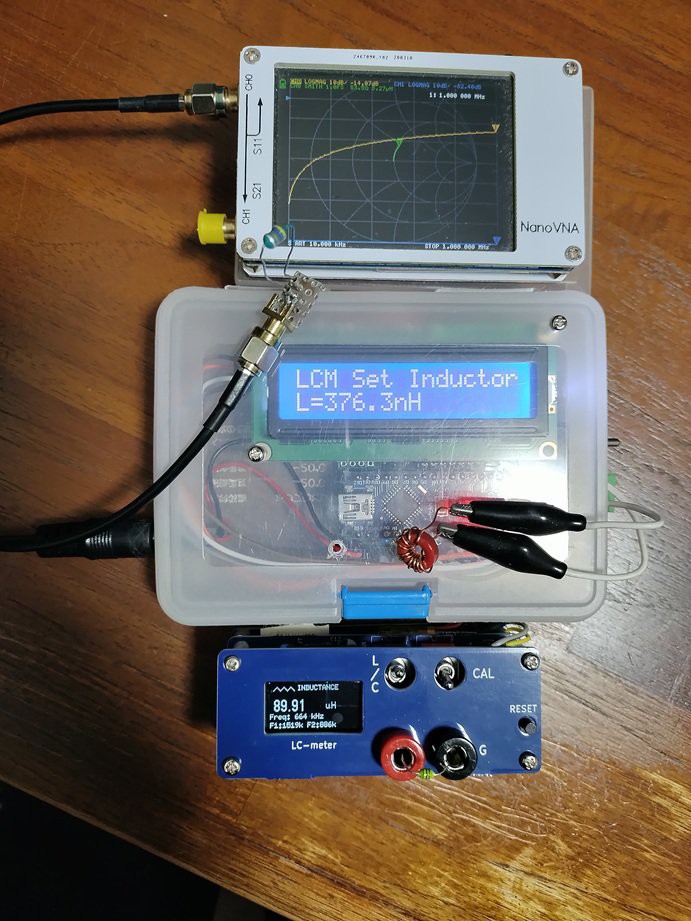
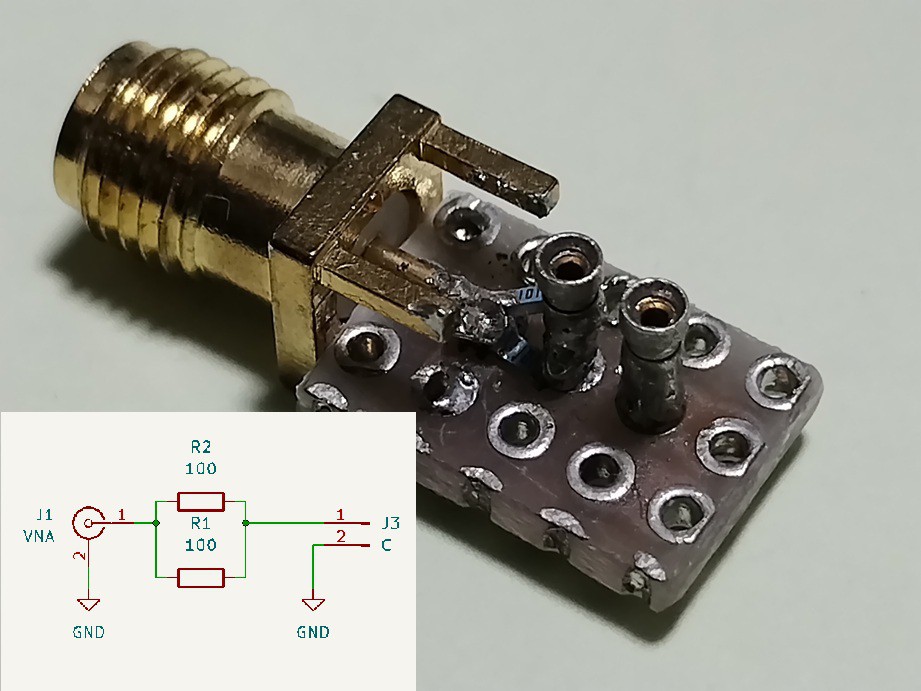
The residual inductance at the measurement terminals can actually be measured directly — just insert a shorting plug and read the value. In my setup it comes out to around several nH, which is consistent with what the nanoVNA adapter measurement shows as well.

That said, this is also within the natural variation range of the Franklin oscillator for this circuit configuration, so sub-µH measurements are indeed at the noise floor. For the intended use case — verifying hand-wound coils in the µH range for HF/VHF work — this is acceptable. The limitation is real, but the instrument is not useless.

  Are you sure? yes | no

nobcha wrote 02/02/2026 at 15:21 point

Thank you for pointing out the spelling mistake.

  Are you sure? yes | no

Per Jensen wrote 02/02/2026 at 13:00 point

I believe it's spelled *Franklin oscillator :)

  Are you sure? yes | no

Does this project spark your interest?

Become a member to follow this project and never miss any updates