Close
0%
0%

Light level geolocator

If you have a lot of time, you can decide your position on Earth just using watches and eyes. Or RTC and LDR.

Similar projects worth following
This project aims to implement Light-level geolocation method into small unit, capable of running and logging for months or years from single coin cell, like CR2032.

Years ago I stumbled upon article describing geolocation logger for animals, allowing biologists to track their position. The device was self-sustained, logging into its memory, available to be downloaded after retrieval.

As usual, no details were released, I just remember method of determining position from time of dawn and dusk - it certainly piqued my interest. I decided to investigate more into this method... one day. And coin cell contest gave me good reason to start it.

This project ran in two phases, with two different hardware variants built:

1, At first I have no single clear idea how to turn light input data into geolocation output - though I had partial ideas that can be employed. In order to make the decision easier, I built simple and "disposable" loggers I  sent around the world to see and log as many sunsets/sunrises as possible. Those loggers were designed to not make any geolocation output, just logging light levels; and were of no use after the mission is done.

2, Once the geolocation algorithm was clear, I made the final LLG hardware, providing geolocation output on display, also with logging capability.

The accuracy of geolocation seems to be in order of dozens of kilometers. It depends strongly on surroundings, though in really unsuitable conditions it can provide valid results within few hundred of kilometers.

The LLG has calculated run-time of nearly 10 years with LCD permanently on, or over 30 years with LCD off. EEPROM capacity is for more than 22 years worth of logging.

  • Two more data points to resolve location

    jaromir.sukuba01/15/2018 at 12:54 0 comments

    Apart from Sun light geolocation, I have two more options to passively resolve geographic location on small low-power device.

    1, Watching the light output from Moon, as @Ted Yapo suggested in one of previous logs. It's almost the same as geolocation by Sun, just it's by Moon :-)

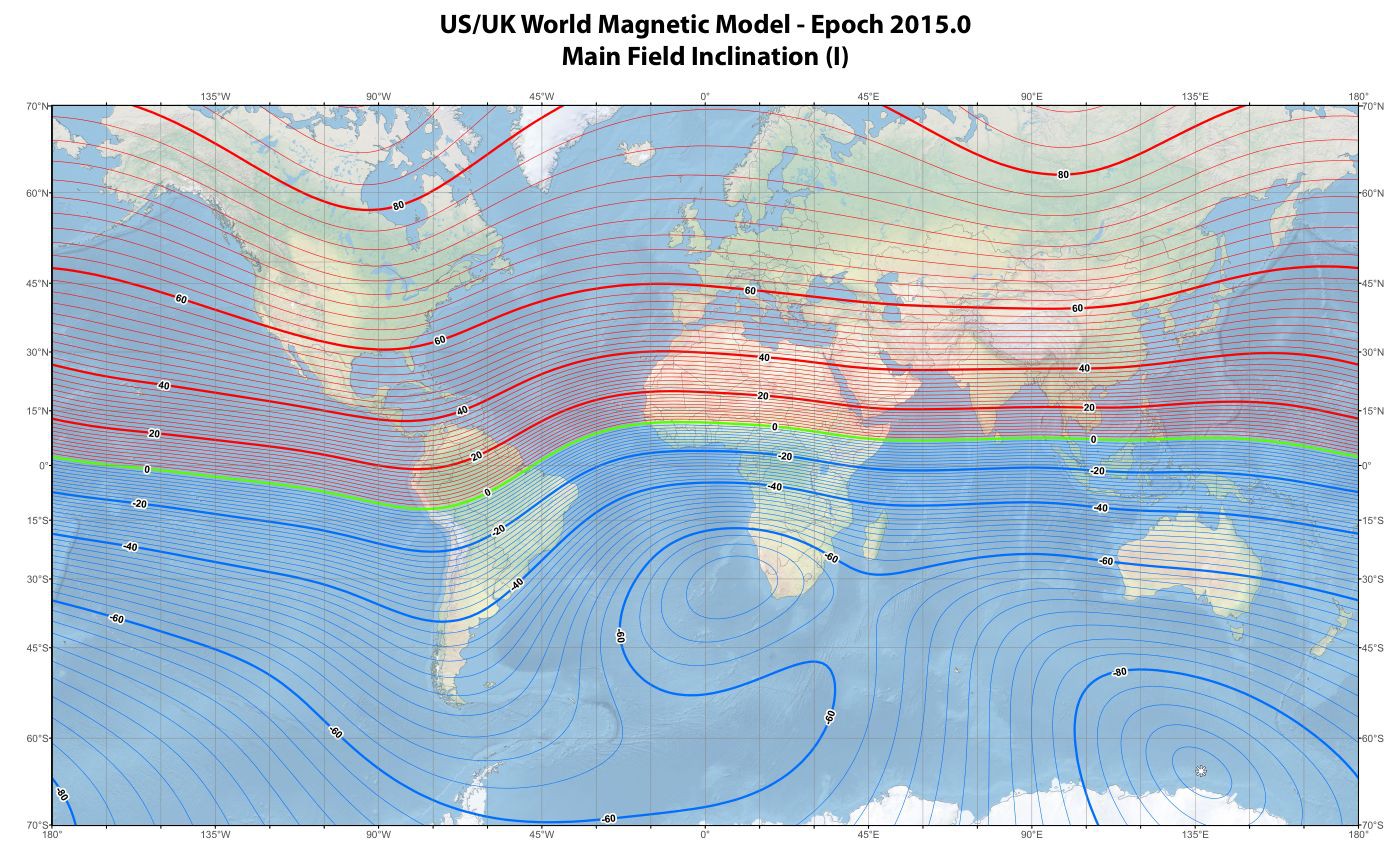
    2, Watching the inclination of geomagnetic field against center of gravity. The map is known and looking just like this

    Using 3-axis accelerometer and 3-axis sensitive magnetic field detector should be able to uncover relation between the two variables and it will provide me another point to resolve geographical latitude.

  • Some more thoughts

    jaromir.sukuba01/12/2018 at 09:56 3 comments

    I have some more thoughts about this project:

    • I can build minimal version - without display and buttons, just with logging option. Time setting/readout of logged data would be done via serial interface. The minimal option can be done very small and lightweight. There is also option of using larger photodiodes to generate not just measurement input, but also power to the logger. I wonder if it's possible to power logger from harvested sun energy without any other power source. Accumulator of some kind would be probably needed, though - at least to backup RTC.
    • To make longer term logs, more precise RTC is needed. RTC drift causes mainly geographical longitude  to drift (latitude is less affected), slowly.
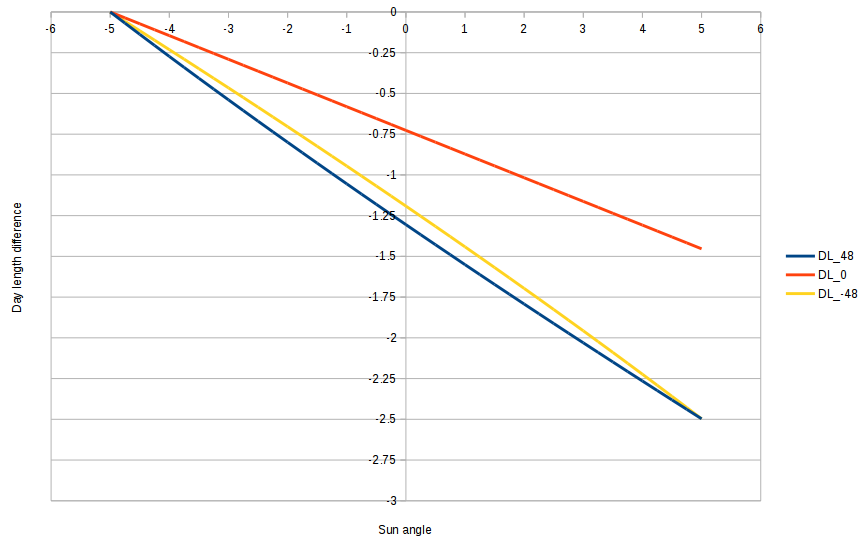
    • The accuracy of LLG changes over the year, especially for latitude. As shown here, day length for zero declination is nearly equal for all over the world (with exception of polar areas, not shown in graphs), that happens at spring/autumn equinoxes. In such condition, LLG is almost unable to determine its position and accuracy is bad. Fortunately, it's easy to predict when this does happen and filter out wrong results. Accuracy of longitude is more-less constant all over the year.
    • I didn't fully explore the blue filters idea. Filters I employed are probably not the best choice and I need something better.
    • I wonder if LDR is good light detection device. Photodiode with TIA is better option in terms of accuracy (it can be done linear over many orders of magnitude of photocurrent), not that much in terms of component count and probably current consumption. The advantage of LDR is that it produces roughly exponential output, but I've been unable to properly use data measured by @Ted Yapo as his logger has different "gain" compared to my combination of LDR/47kOhm resistor. Maybe I need LDR with more than one resistor to achieve different "gain levels". Also, currently there is a few manufacturers of integrated devices photodiode+TIA+ADC in single package, this is also viable alternative. LDR with fixed resistor was simplest and easiest way to do it in short timeframe of contest, and provides quite good results, though.
    • The "unlocked" XC16 compiler works great.

  • Resume

    jaromir.sukuba01/08/2018 at 21:46 2 comments

    Though started 12th of December - less than month ago - this project was funny a rewarding one. From beginning I knew there will be a few weak spots I have to addres:

    • I have to make two hardware variants, one just for collectnig data, another one being the final product
    • I have to transfer the loggers to its destination as fast as possible at reasonable price, while dealing with overloaded post offices during pre-christmas time
    • Light level geologging is not very well known and sources of information are scarce

    Despite that, I've been able to make 6 light loggers, five of them being sent across the Europe, being ready to collect data which served as basis of my geolocation algorithm setup. After I succesfully received four of them I honed the algorithm, discovered some peculiarities making my life harder, but at the end I validated my ideas and established approach to use on real LLG.

    In the meantime, I designed and made the LLG hardware. Because I had no time to wait days or weeks to collect reasonable amount of results from LLG measurement, I implanted data previously measured by simple loggers into LLG as if it were measured by LLG and observed results, being surprisingly good considering how trivial is the measurement method, even proving some degree of robustness against unsuitable conditions.

    At the end I calculated projected battery life, being 10 years with display on and 30 years with display off - just running geolocation and logging the location points.

    Firmware, PCB files and 3D files are available on github.

    LLG has error of, say 100km versus 10m for GPS, ie. four orders of magnitude worse accuracy. On the other hand, commonly available GPS units have consumption in order of tens miliwatts, while LLG can track and log its position with consumption of microwatts, that is four orders of magnitude less.


  • Current consumption, battery life

    jaromir.sukuba01/08/2018 at 16:16 1 comment

    LLG was built with lowest possible current consumption in mind right from its inception, see my one of my previous project logs. I expected 2,5uA with LCD on, 0,7uA with LCD off; and 9 or 23 years battery life. Let's check it against reality.

    Device works in three modes

    • High-power mode, when ADC acquisition and calculations do take place. In this mode LLG takes approximately 400uA
    • Mid-power mode, when LLG is brought out of sleep and interacts with user; scanning buttons, refreshing LCD. This takes approximately 25uA and after a few seconds falls to low-power mode.
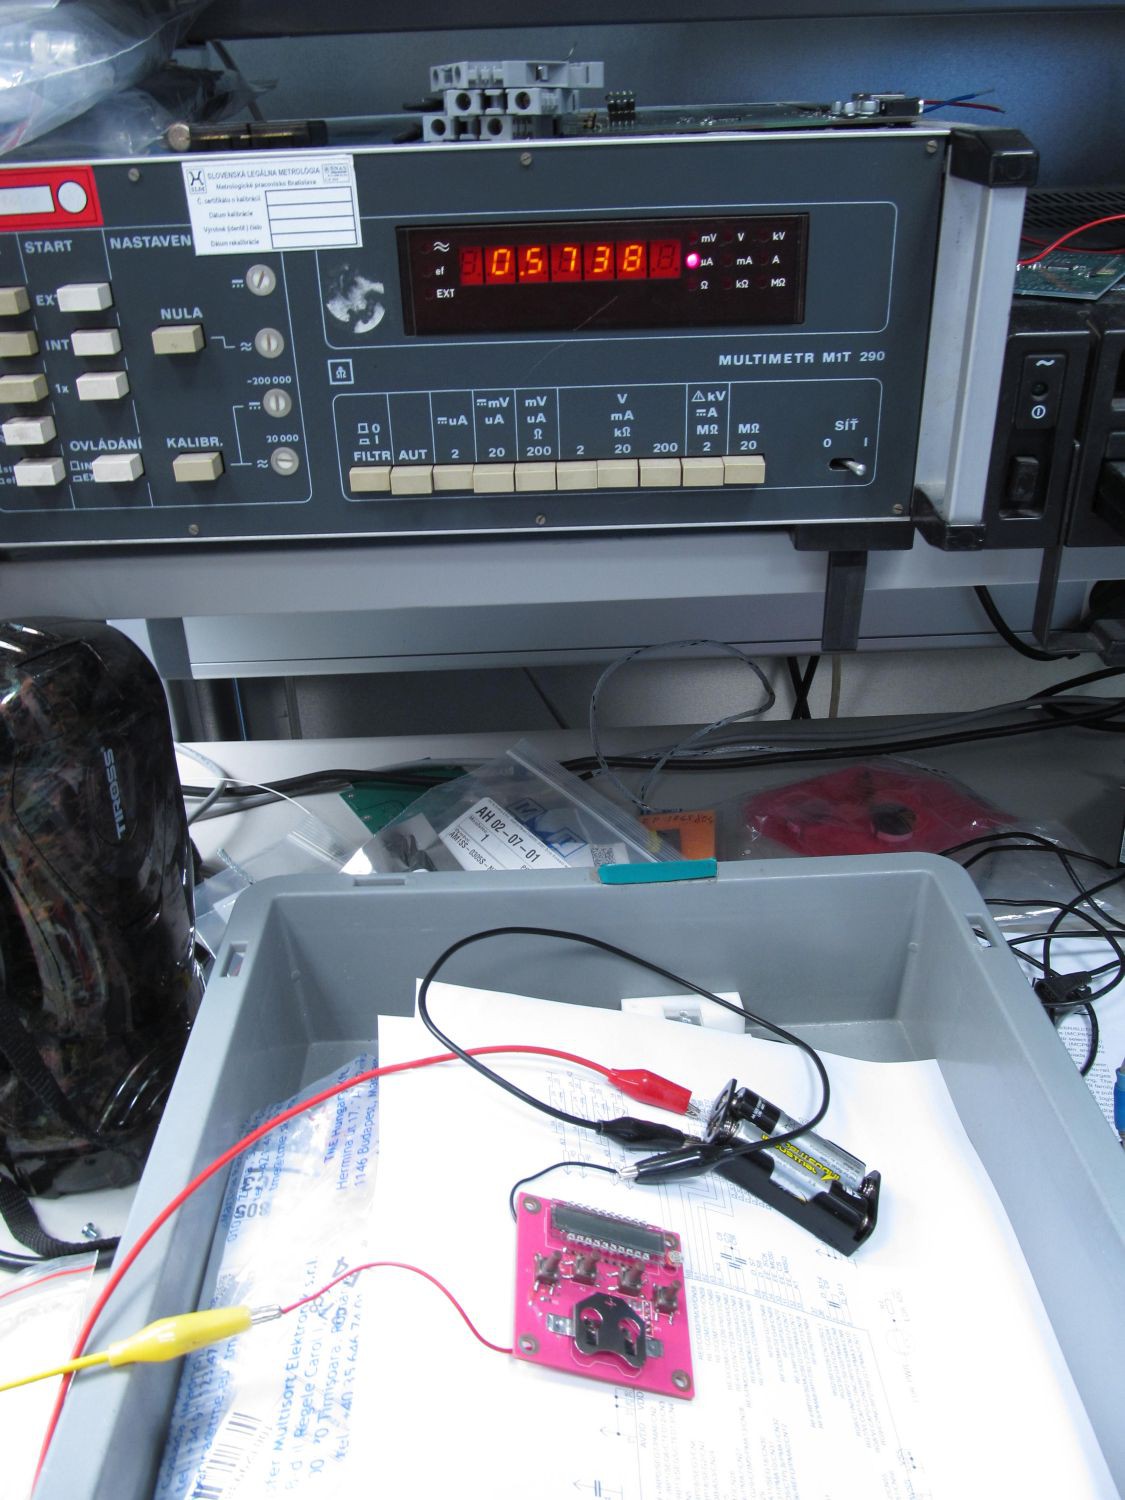
    • Low power mode, when LLG is idle and waits for user interaction or RTC to wake up and take measurement. In this mode, LLG takes 2,55uA with LCD on or 570nA with LCD off.

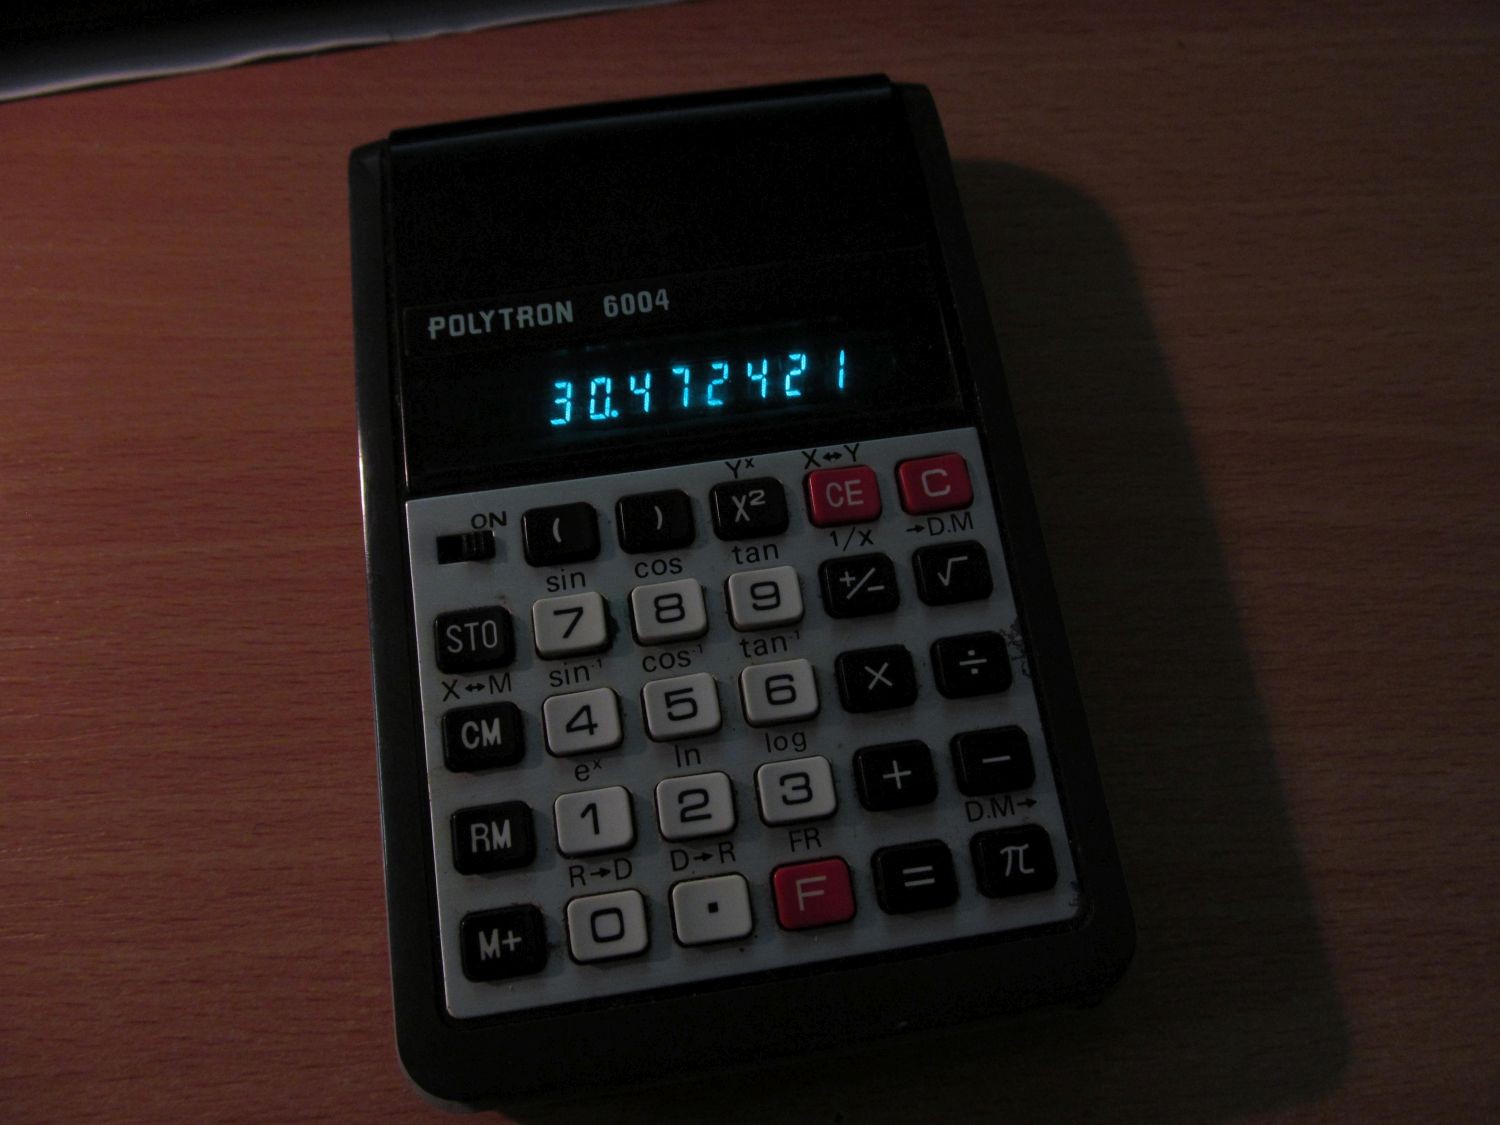
    When I took video in previous project log, the 2,55uA and 25uA figures are obvious, but at the time I didn't have LCD-off mode yet. In order to measure it more precisely I had to use some older, heavy stuff

    The logger spend different time in those power managed modes. Vast majority of time is spend in low-power modes. Let's say user spends one minute per day checking the LLG results - that is mid-power mode. High power modes are ran automatically - 1440 times per day for light measurements (each one takes less than 5ms) and once per day to analyze the data, calculate geographical location and save one log into EEPROM (that takes roughly 150ms).

    It draws 60uAs (microampere-seconds) in high calculations, 3,24mAs in measurement mode, 1,5mAs in mid-power mode and 220mAs per day in low-power mode with LCD on. That is roughly 225mAs per day or 22,8mAh of capacity consumed by the logger. Self discharge is usually defined as 1% per year - leaving us with a bit of doubt what it does mean, as @Ted Yapo discusses here, but if I assume it's 1% of nominal 240mAh capacity, that adds another 2,4mAh of capacity per year, giving total 25,2mAh per year. This yields to 9,5 years of lifetime on average usage and LCD on.

    With LCD off the idle-mode figure goes roughly five times lower, in total 54mAs per day, or 5,48mAh per year, plus 2,4mAh self-discharge, that is 7,88mAh per year. Given the same capacity, runtime could be 30,5 years for one CR2032.

    Keep in mind those are projected numbers, especially the 30 years figure has to be taken with grain of salt, as anything over a few years. I've seen and heard of many stories where CR2032 powered BIOS backup for 15 years and then ran just like new, but battery is just chemical component and as everything other it's only so much tolerable to manufacturing variances, temperature changes, humidity... etc. The same applies to the LLG itself. MCU sleep current is somehow temperature dependent. PCB - especially at places where solder flux wasn't perfectly washed out - can absorb some humidity, bringing the consumption higher.
    The onboard 25AA256 EEPROM can hold 32768B data. One log is 4B long, that is 8192 records (8191, actually, because of the way it's organized). Considering one record per day, EEPROM should be filled in 22,4 years. LLG has no option to disable logging, as I considered it unnecessary.

  • Firmware, enclosure

    jaromir.sukuba01/08/2018 at 12:19 4 comments

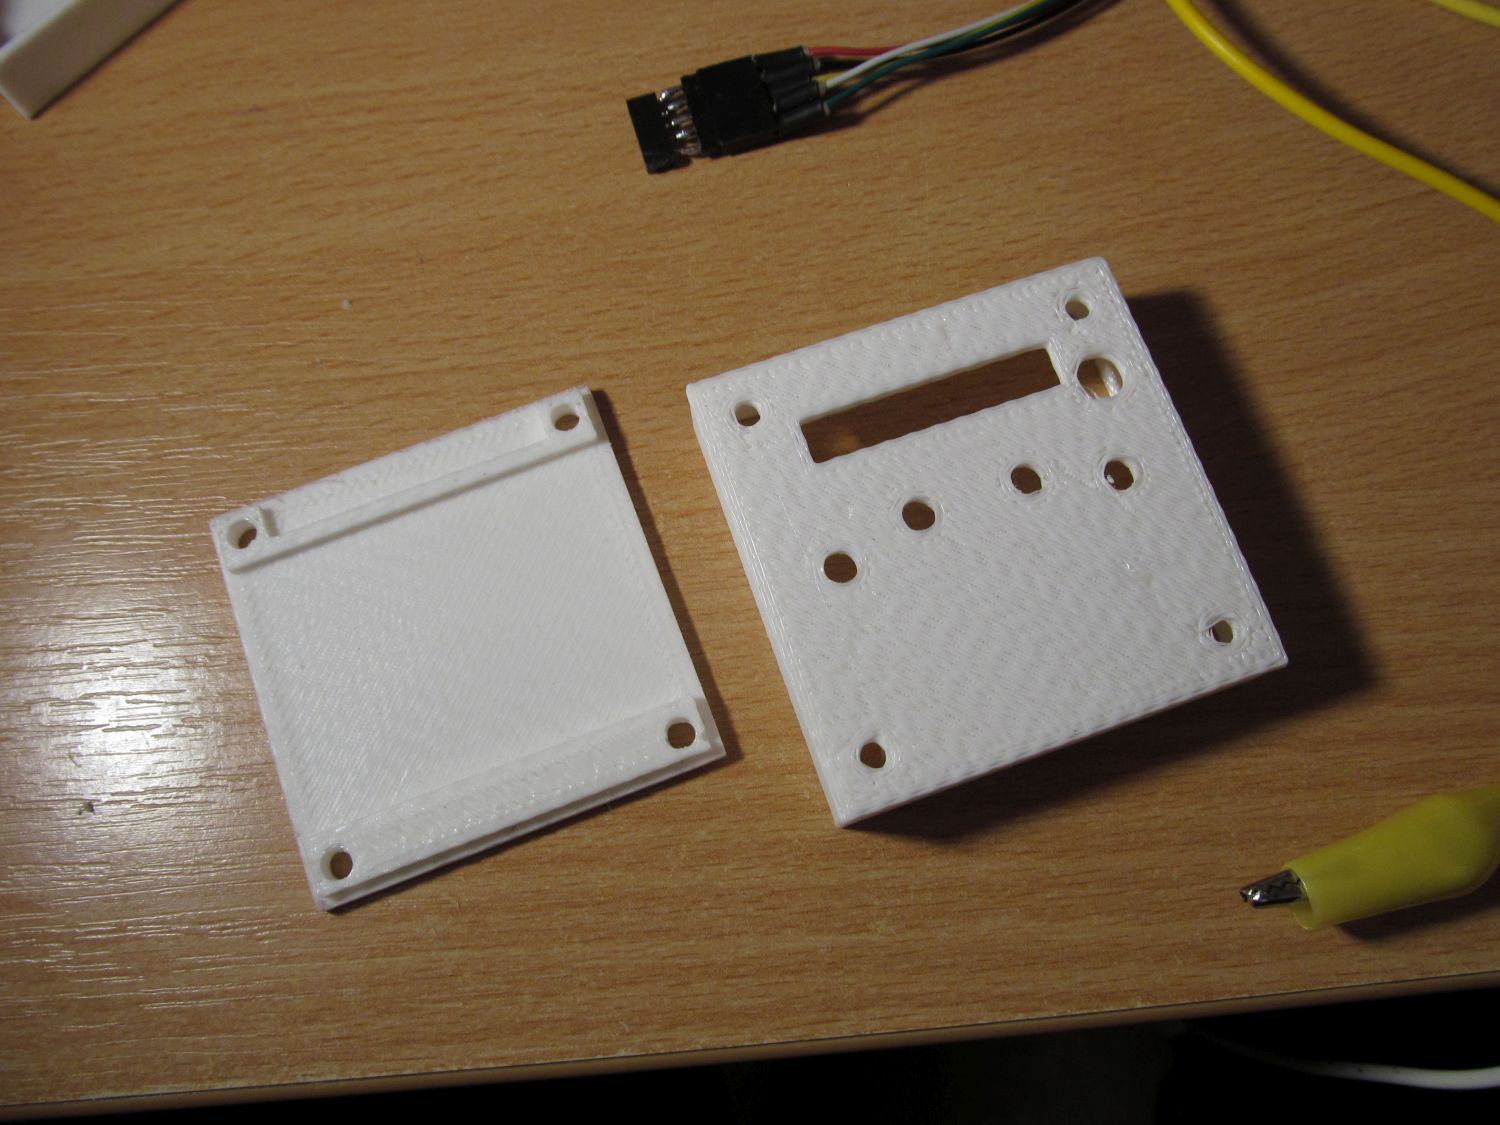
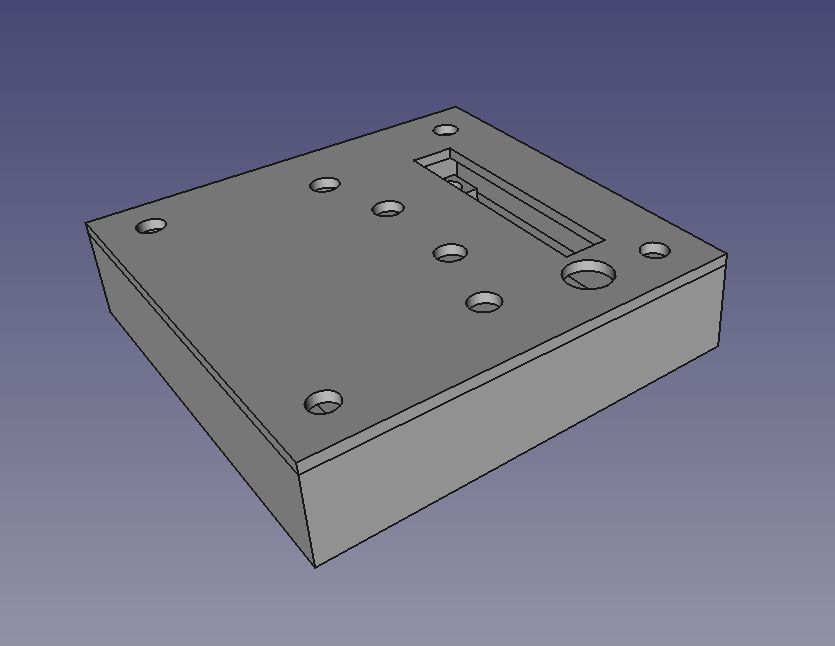
    Yesterday I designed enclosure for my LLG in FreeCad

    and printed it in two parts

    After a few strokes with sandpaper it fitted nicely together, bottom part first, with standoffs
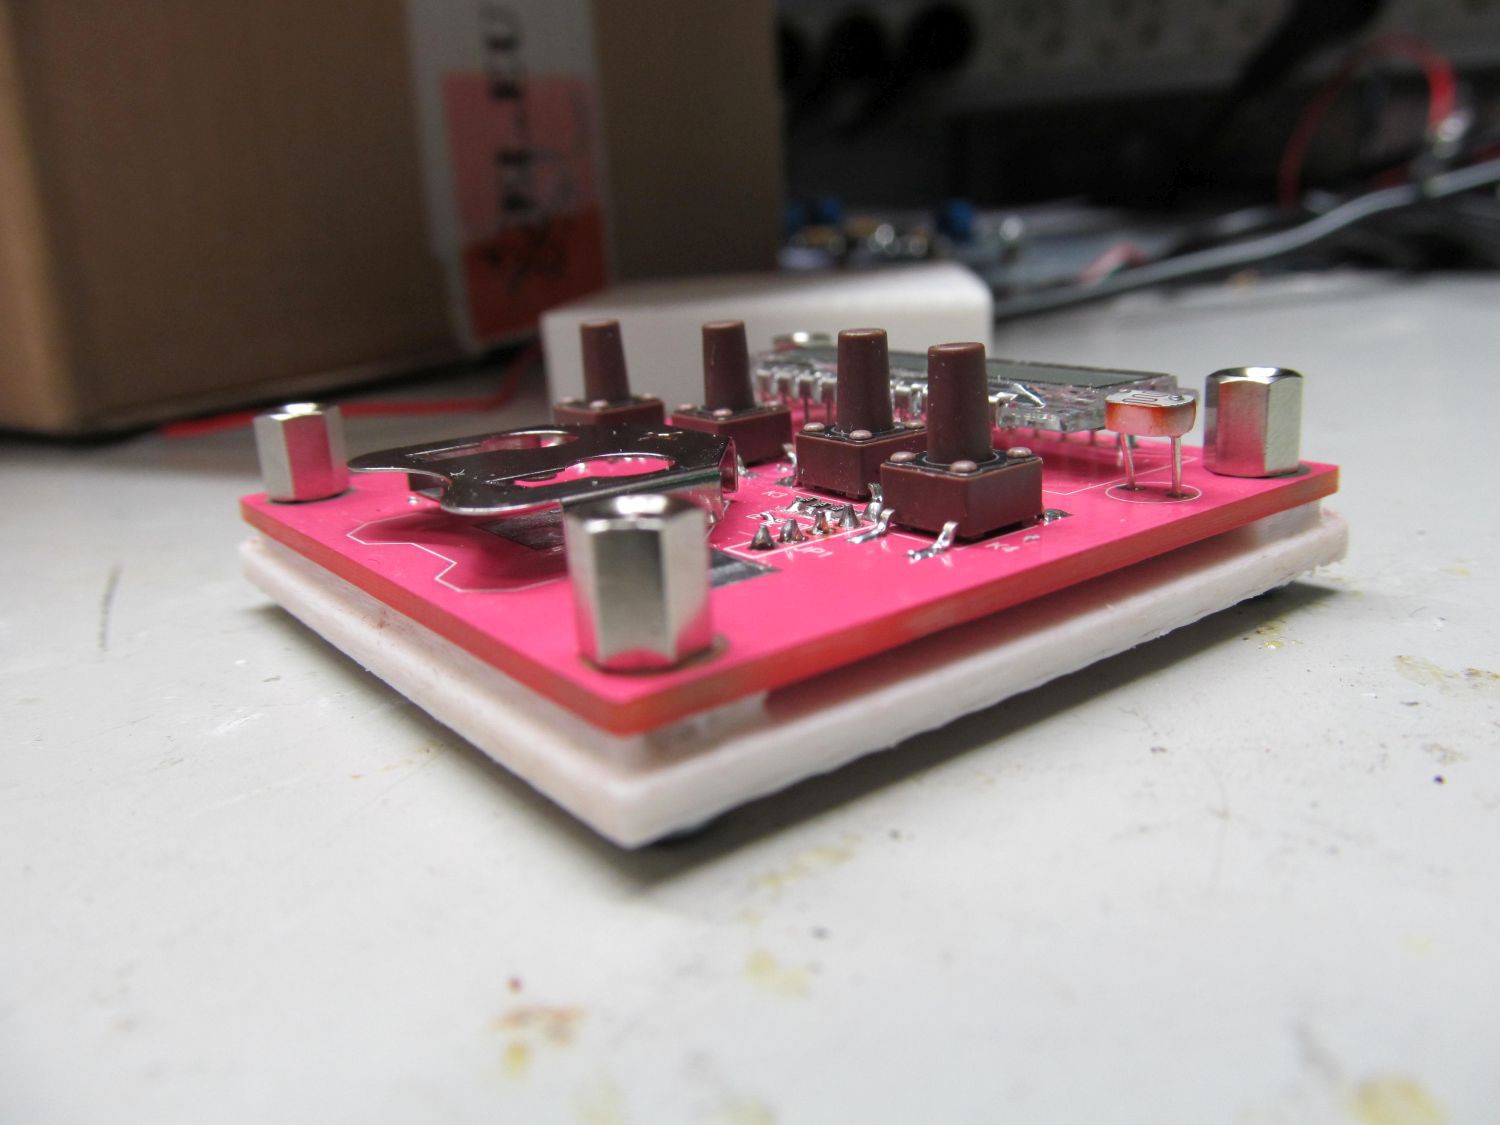
    inserted battery

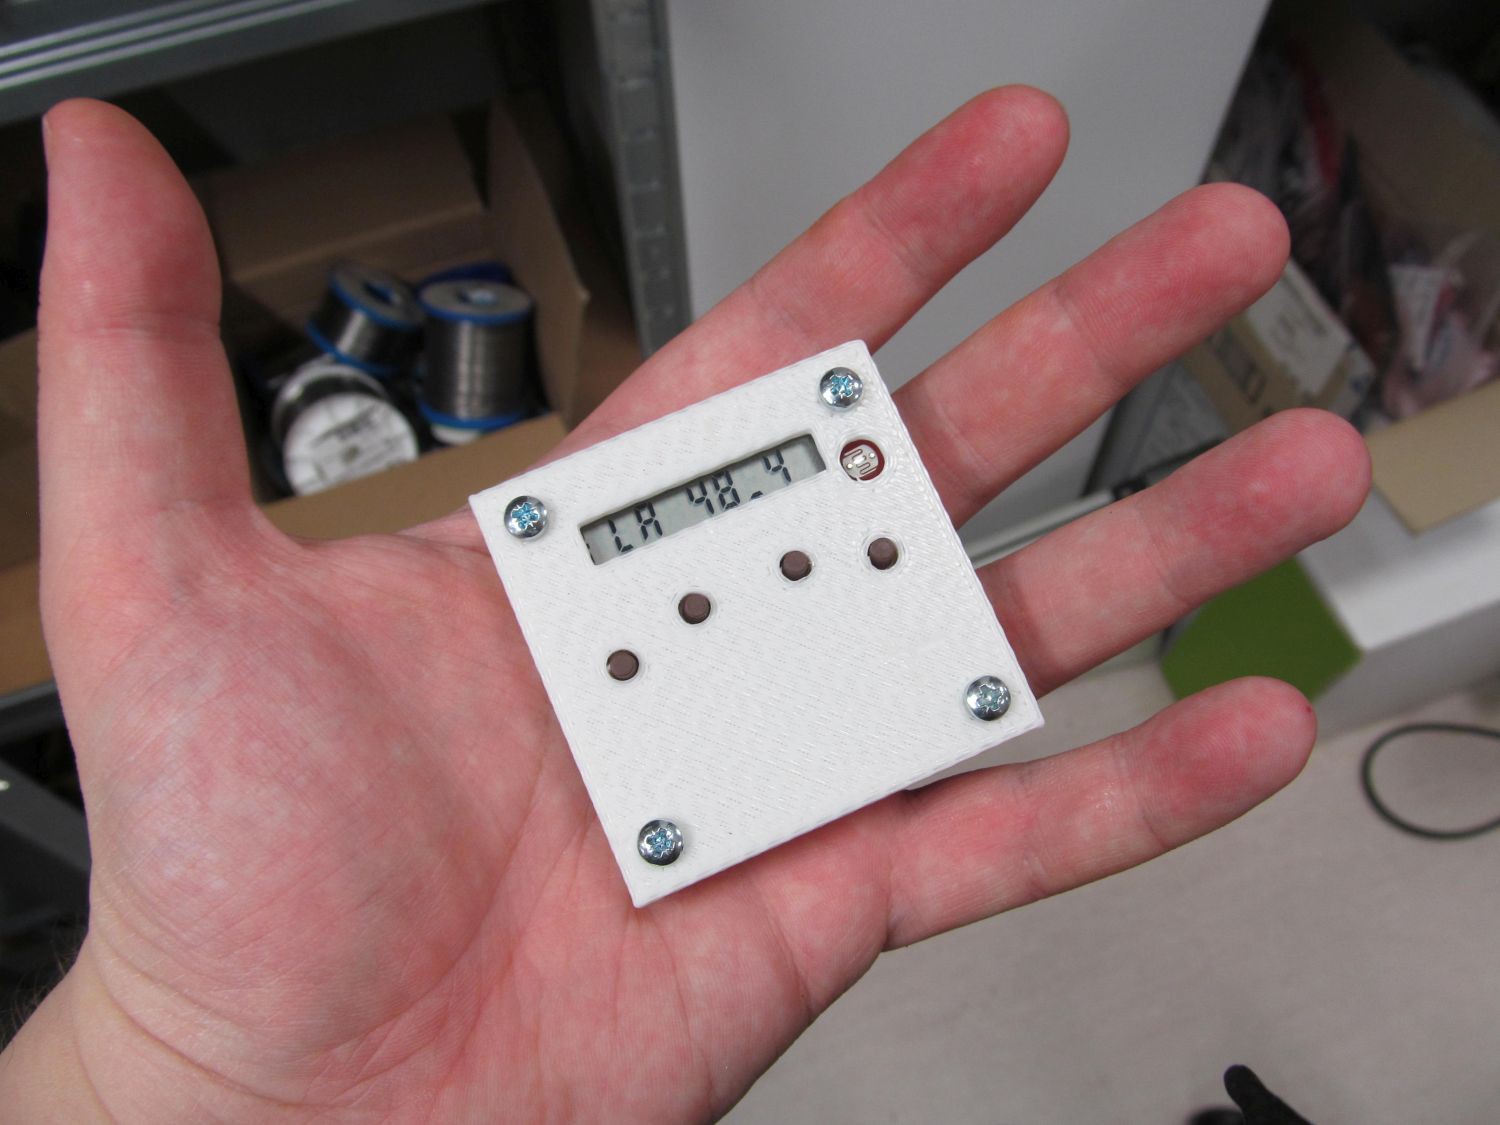
    and top cover

    While case was being printed, I made final touches to my firmware I was working on for last three days. As this project reaches to completely new filed to me, at least 95% of code was freshly written, with little code reuse.
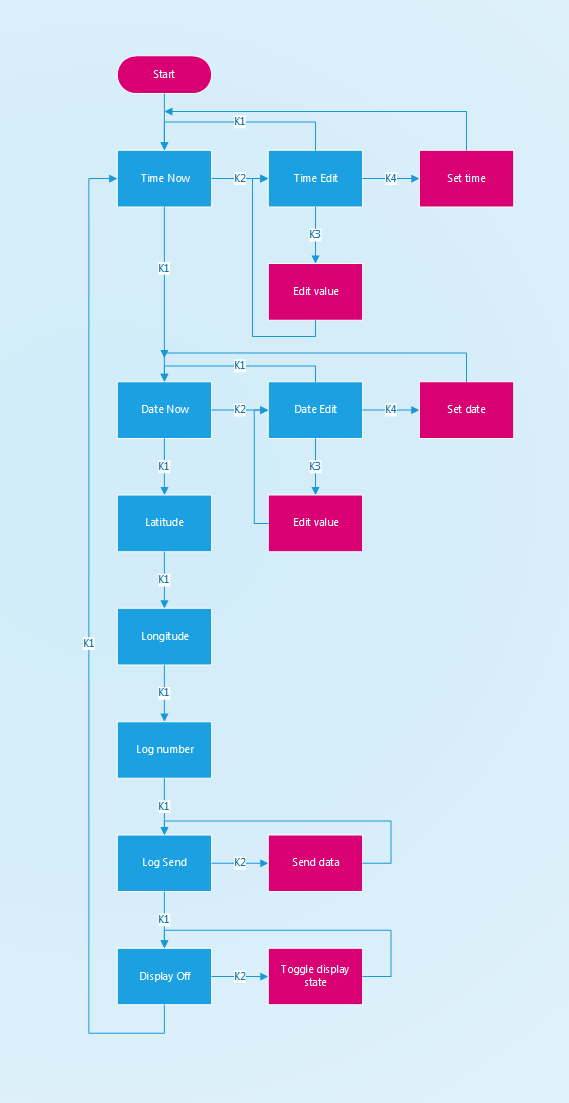
    User interface of the LLG is being built around four key switches and LCD. The switches are numbered K1, K2, K3 and surprisingly K4; left to right. In general, K1 changes current display content, K2 selects what to change, K3 does the change and K4 is here to confirm the change.
    Flow diagram of the UI logic is as follows:

    When browsing UI, device is clocked off internal 31kHz oscillator, with total consumption roughly 25uA.
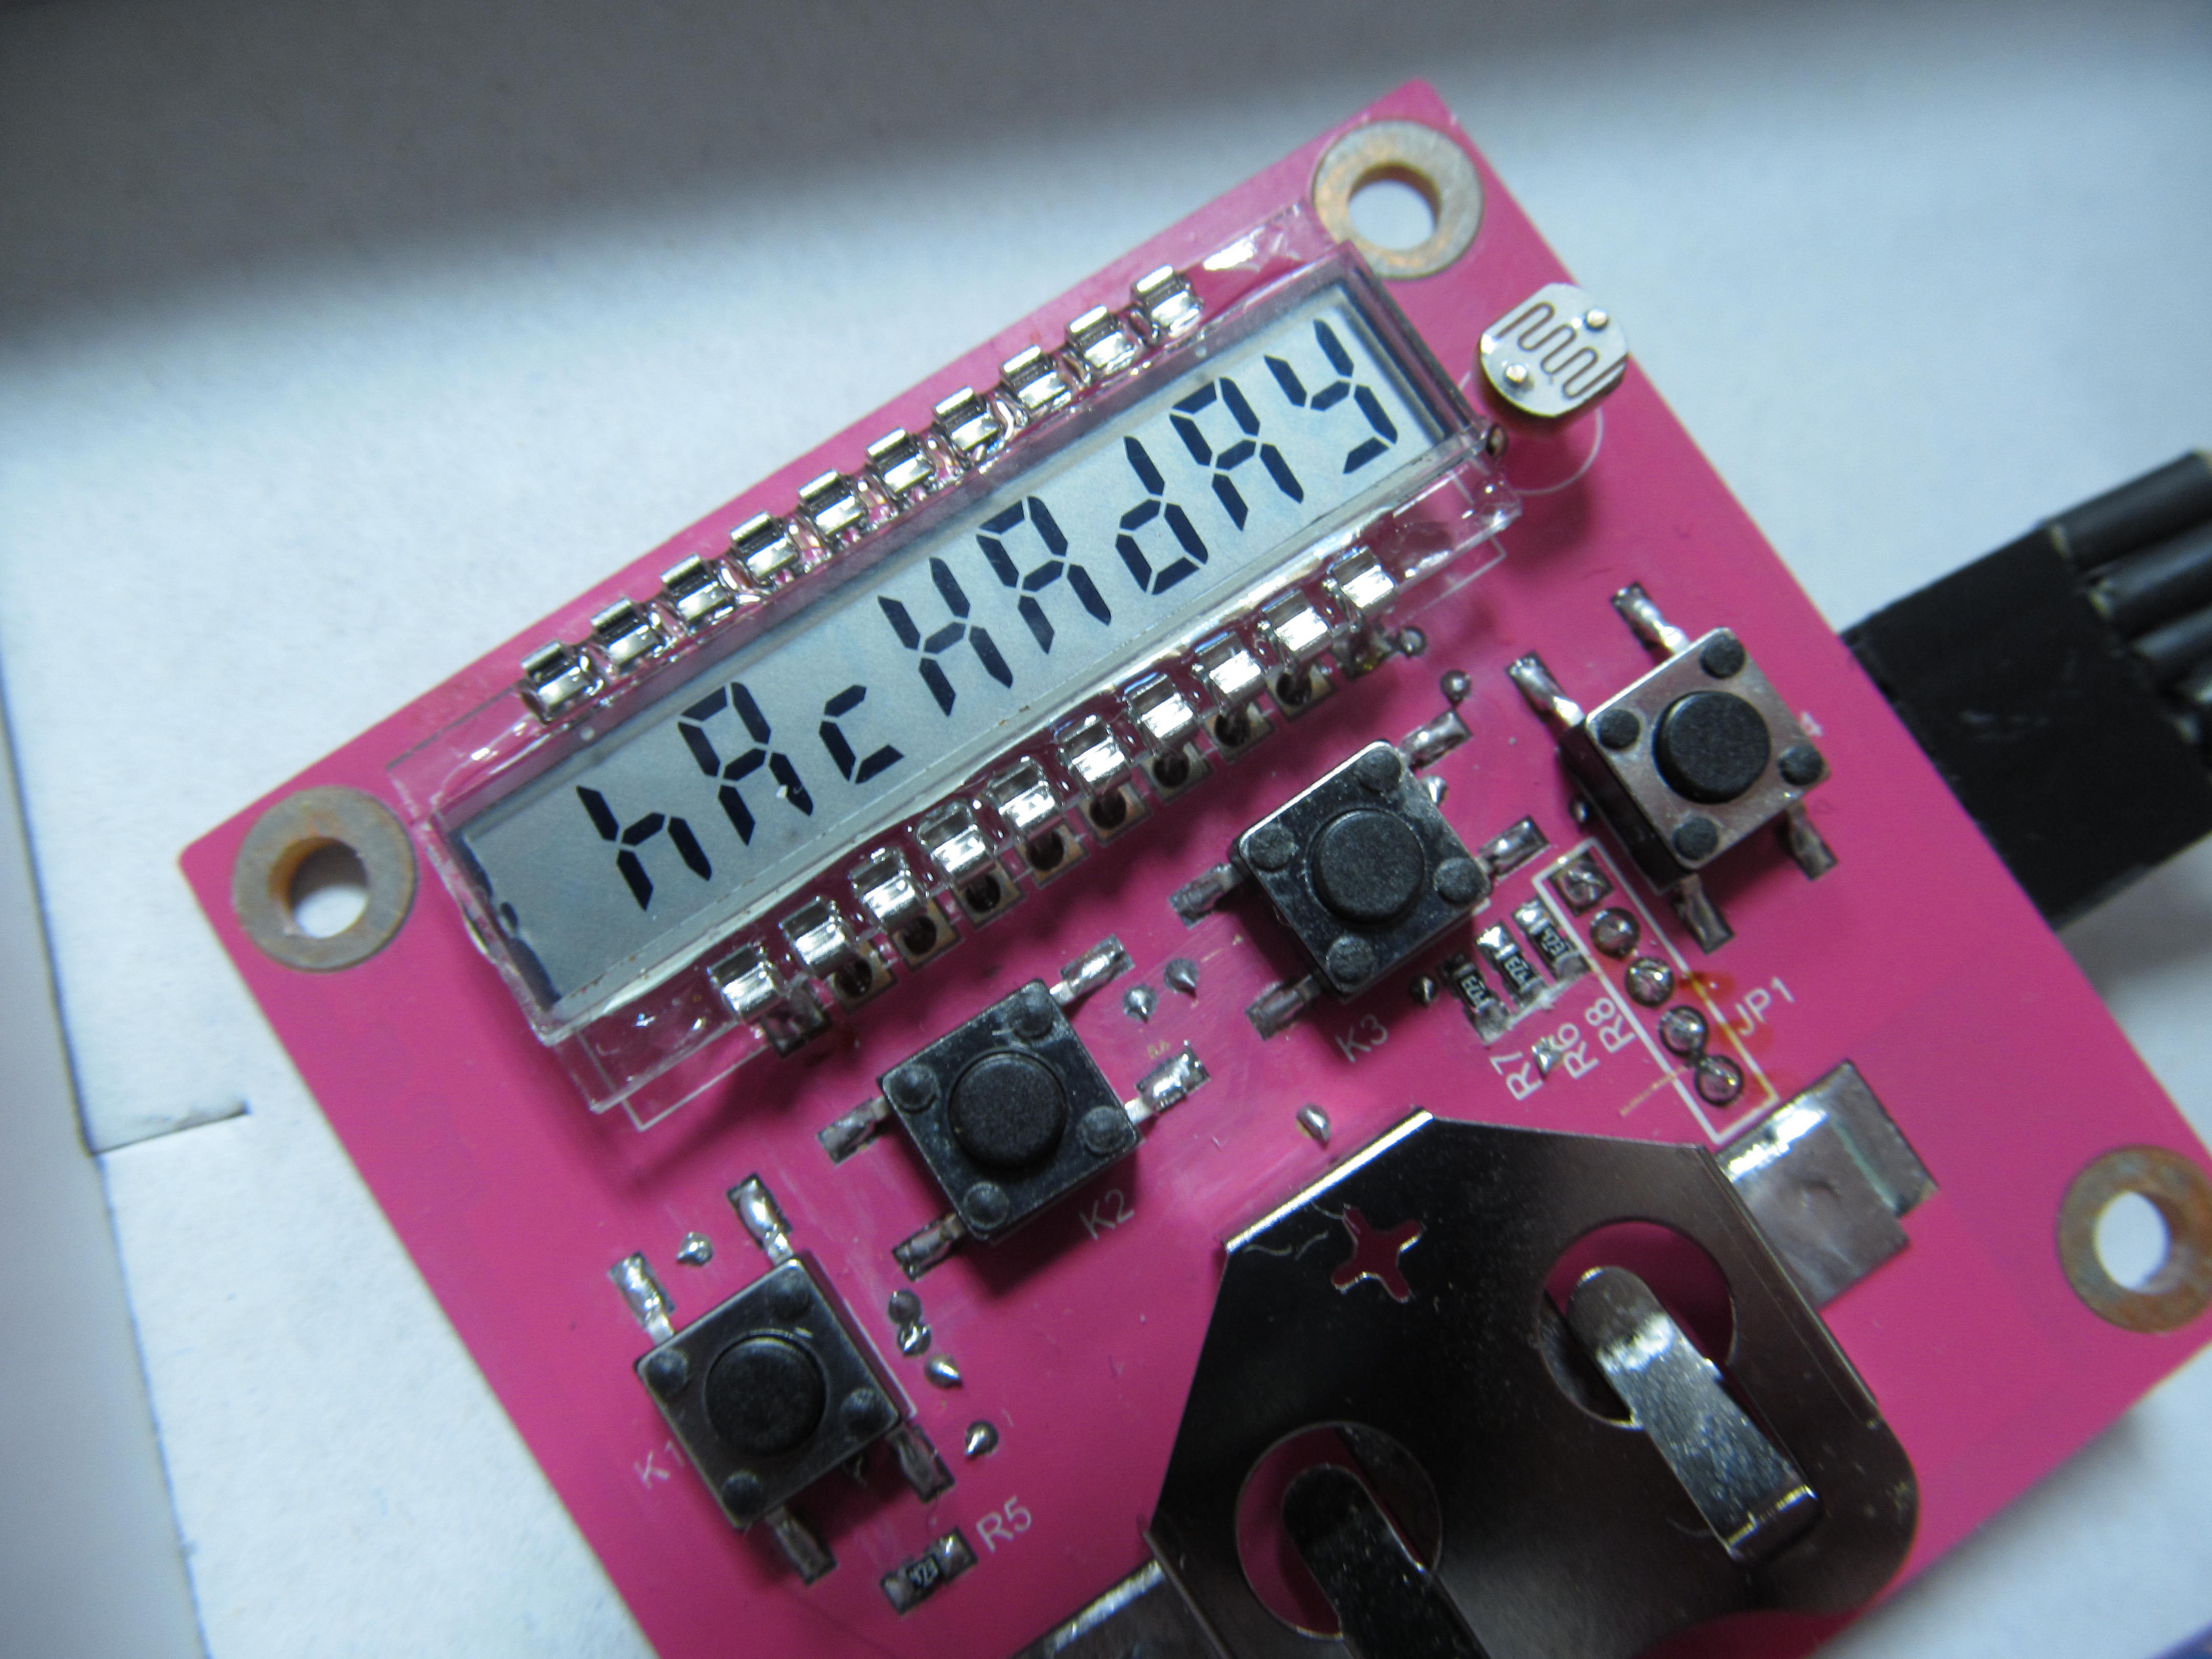
    After half a minute of inactivity device enters idle mode, with lowest possible current consumption, with two possible options - display on or display off. With display on, the consumption is roughly 2,5uA, without display approximately 570nA.
    Every minute logger switches to 1MHz oscillator, then briefly powers voltage divider with LDR, takes one sample from ADC input where LDR is connected and saves the sample into RAM, then enters previous state. When midnight is reached and sufficient amount of samples is collected, geographical latitude and longitude are calculated, one record is written into EEPROM, internal variables are updated and device enters previous state again.

    Here is video of LLG (without case) in action.


    The video is 12 hours old, what unfortunately means it doesn't have display on/off feature captured. The switching sound of switches is actually quite modest, but the automatic gain control of camera microphone channel made it loud as if my bones were cracking or something.

    I have to record another video, probably, and also make some battery life estimation.

    Also, I setup github repository with various bits regarding LLG, I'm filling it on the fly.

  • LLG accuracy on real data

    jaromir.sukuba01/06/2018 at 20:36 5 comments

    I finally made the reverse sunrise equation to work. As usual, it wasn't that hard, but it took another one great input from @Ted Yapo  to get there. The equation

    can be expressed as

    alternatively as

    with substitution of

    from now it's just matter of applying some standard high-school math to solve the equation for L into form that can be easily calculated on MCU. That is for calculating latitude.

    I thought calculating longitude is trivial, but as usual it's not quite like that. When oversimplifying reality, it's just counting how many hours of difference is between local noon and noon at Greenwich; being roughly at 12:00 UTC and multiply this number by 15 degrees for every hour. The key word here is the 'roughly' word. Trying to synchronize clock to sun over the length of year is a bit more complicated, because simple looking movement of Earth versus the Sun is somehow more complicated by axial tilt and its eccentricity, bringing error of a few minutes into the sync. This doesn't look like too much, but it can mean a few hundred of kilometers error for longitude calculation. So, I have to take this effect, named equation of time into account. Fortunately, it can be calculated as sum of two sine functions with different periods as

    where is d is day of year, starting at 1 at first of January. This difference should be subtracted from measured local solar noon and then scaled to 15 degrees per hour. This is quite good approximation for my needs, so I decided to move on.

    I did some more work on LLG hardware, got myself to implement proper segment mapping table, so I'm finally able to display some meaningful messages.

    Above that, I reorganized my measured data so I can import it into my source files for LLG and adjusted the sources so that LLG calculates the geographical position from the data - is if the LLG would sit at the place and capturing data on its own. The calculations ran on real hardware, being outputted via serial link from MCU.

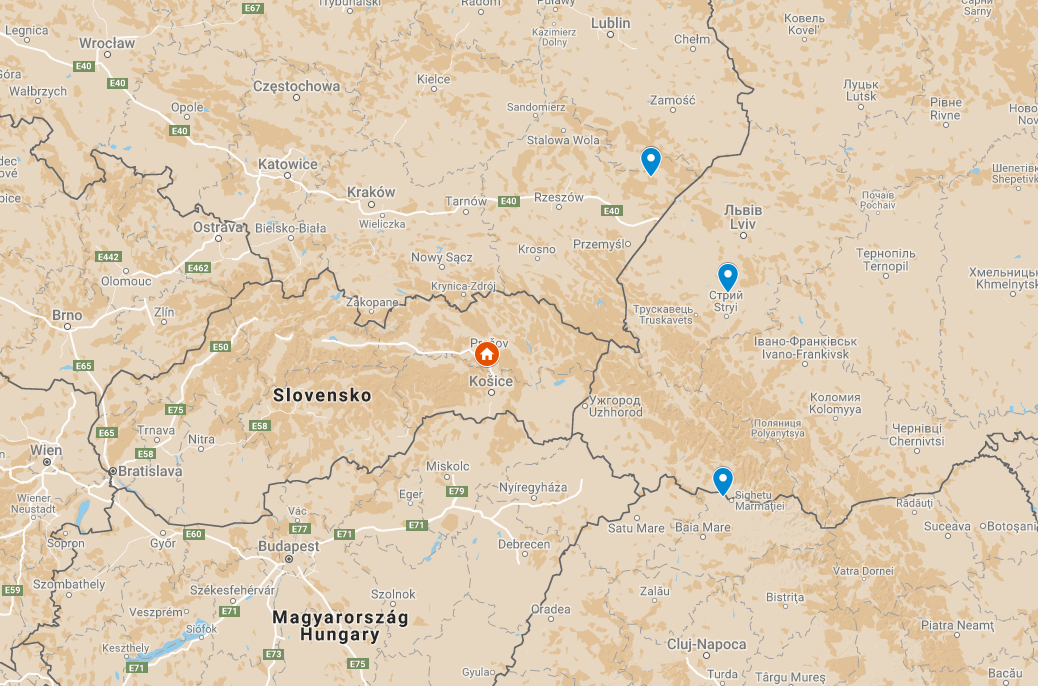
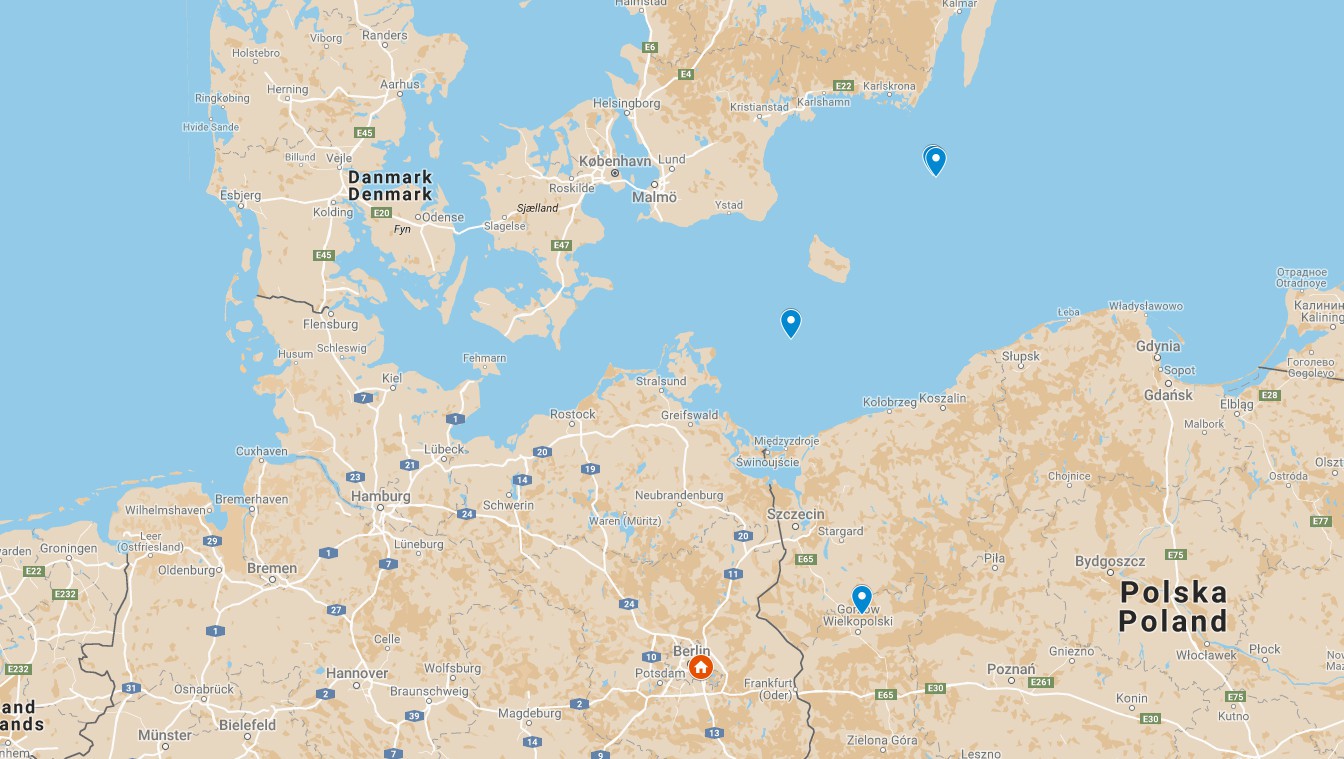
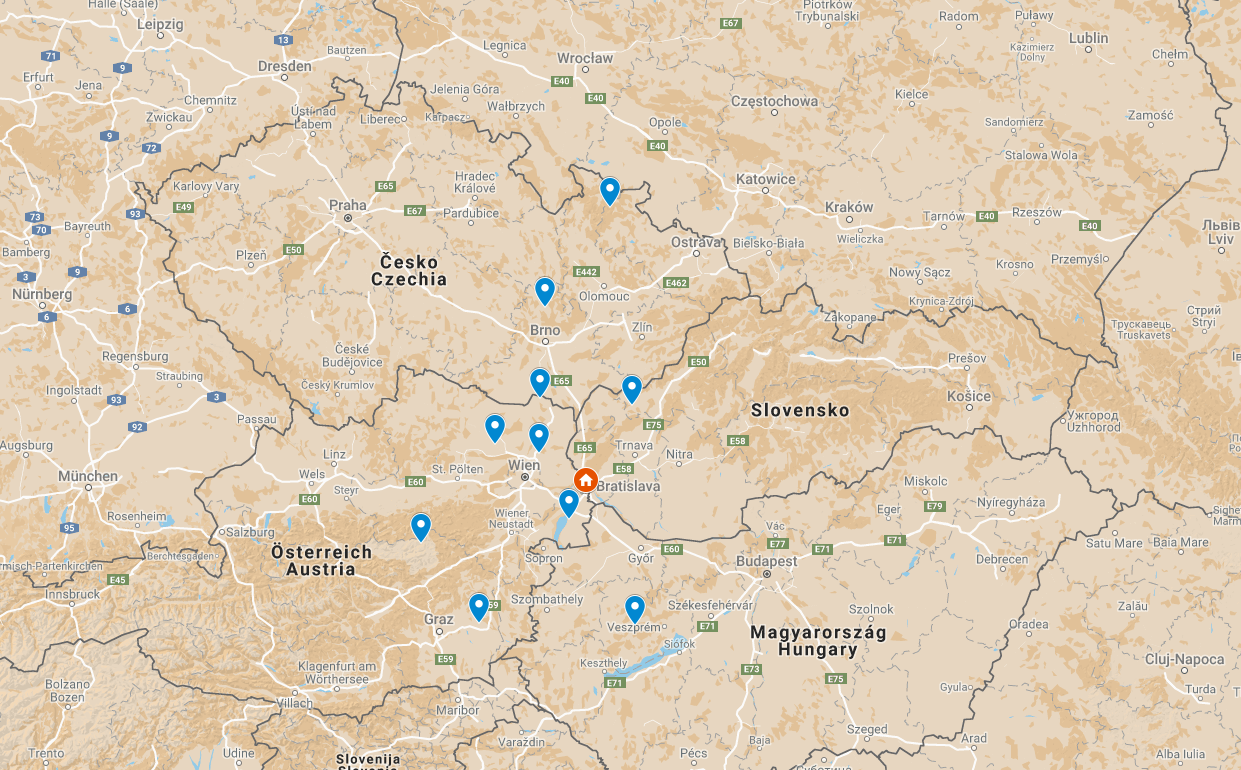
    At first I imported daylight data from my own place, got set of latitude/longitude pairs, entered them into custom map at google maps and here is how it looks. I started with my own place, as this is where I have the most of data

    The orange home icon is where the logger really was, the blue points are determined locations from LLG. I can see the latitude to be more dispersed than longitude, but otherwise half of the measurements got into 75km circle, average accuracy being around 100km.

    The logger on another side of my country was somehow worse, especially in determining the longitude. I assume that's because it was placed on window of tall building, casting shadows during phases of day, shifting the results.

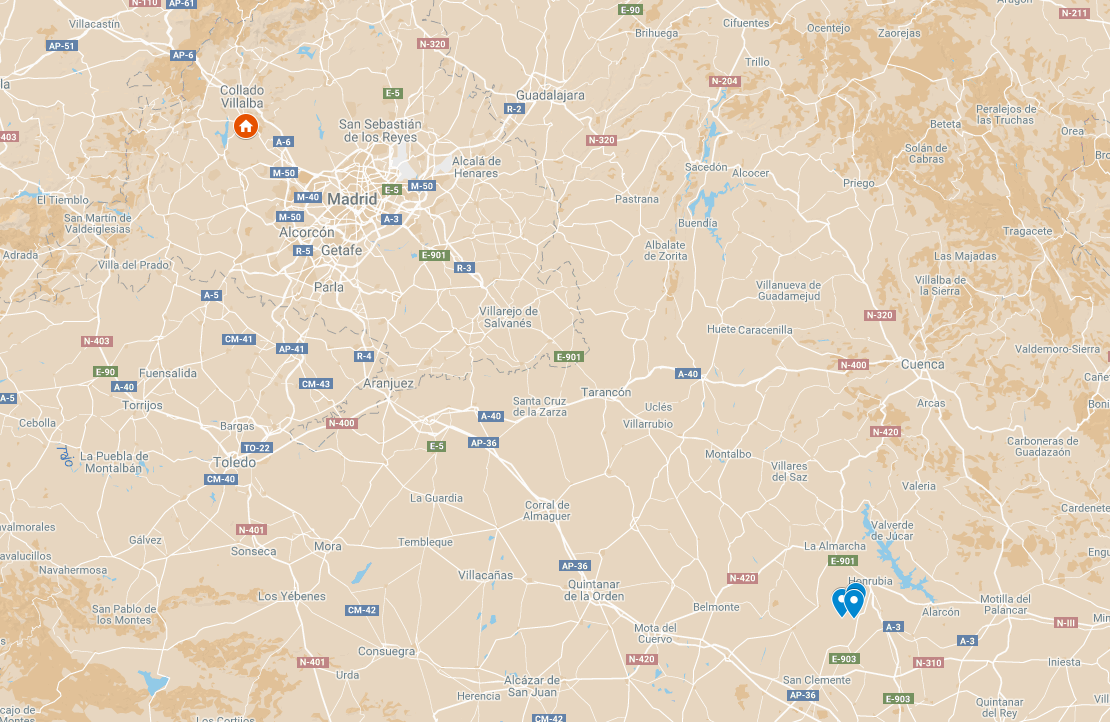
    Interesting is what happed to measurement from Spain.

    The three results are almost perfectly aligned, with differences within a few kilometers. Though all being shifted from real location - that is probably due to sunrise/sunset zenith angle being determined slightly wrong, but I didn't want to change the algorithm to fit the data, that would be cheating. The error in zenith angle didn't show in other examples, as those had much less repeatability due to suboptimal logger placement.

    The difference between the last result and the previous two is that measurement in Spain took place in minimal light smog, open view to sky; unlike the previous ones, with buildings, trees and other obstacles in view. Even worse were measurement made by valuable contributor @davedarko  in Germany

    Both longitudes and latitudes quite far away from original place, but consider conditions where the measurement was done:
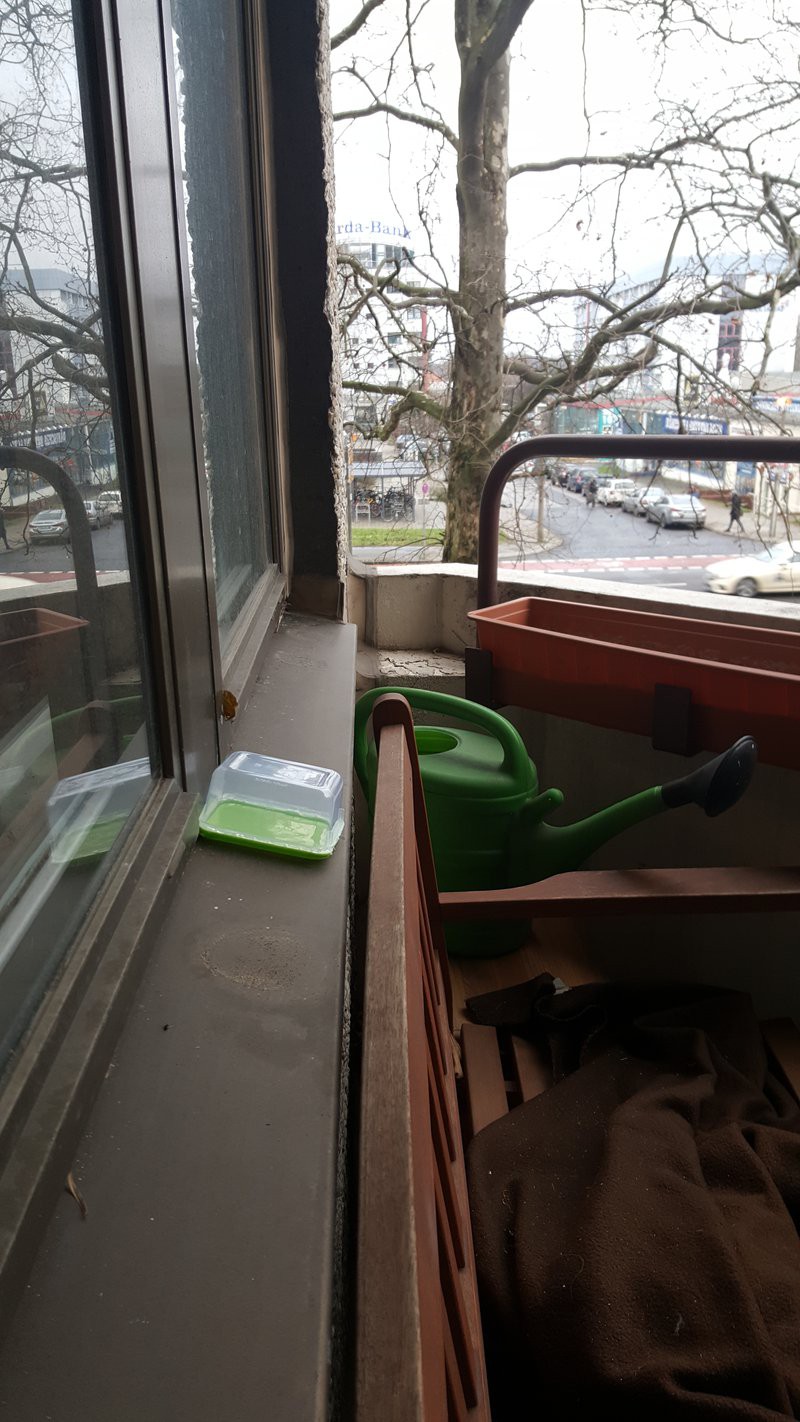
    Not much of clear view to sky, majority of sky obstructed, tree just in way to Sun, all being rough conditions for light level geolocation; yet none of the results are laying in Africa or so. That is very valuable result. I like the watering can, too.
    I believe I can...
    Read more »

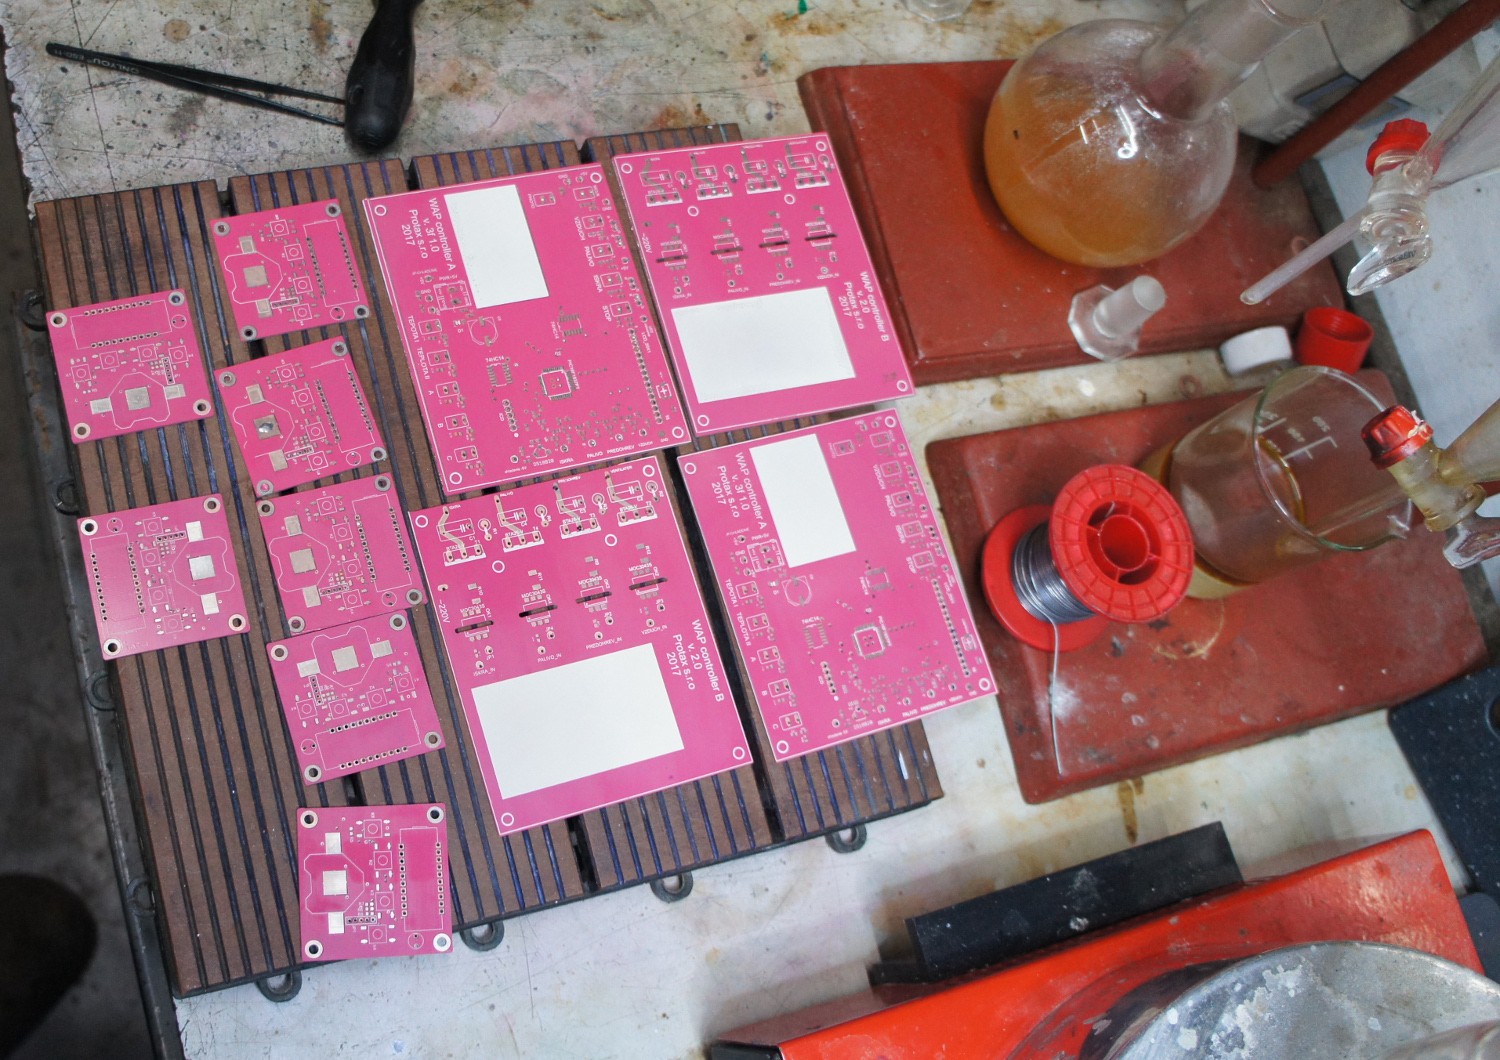
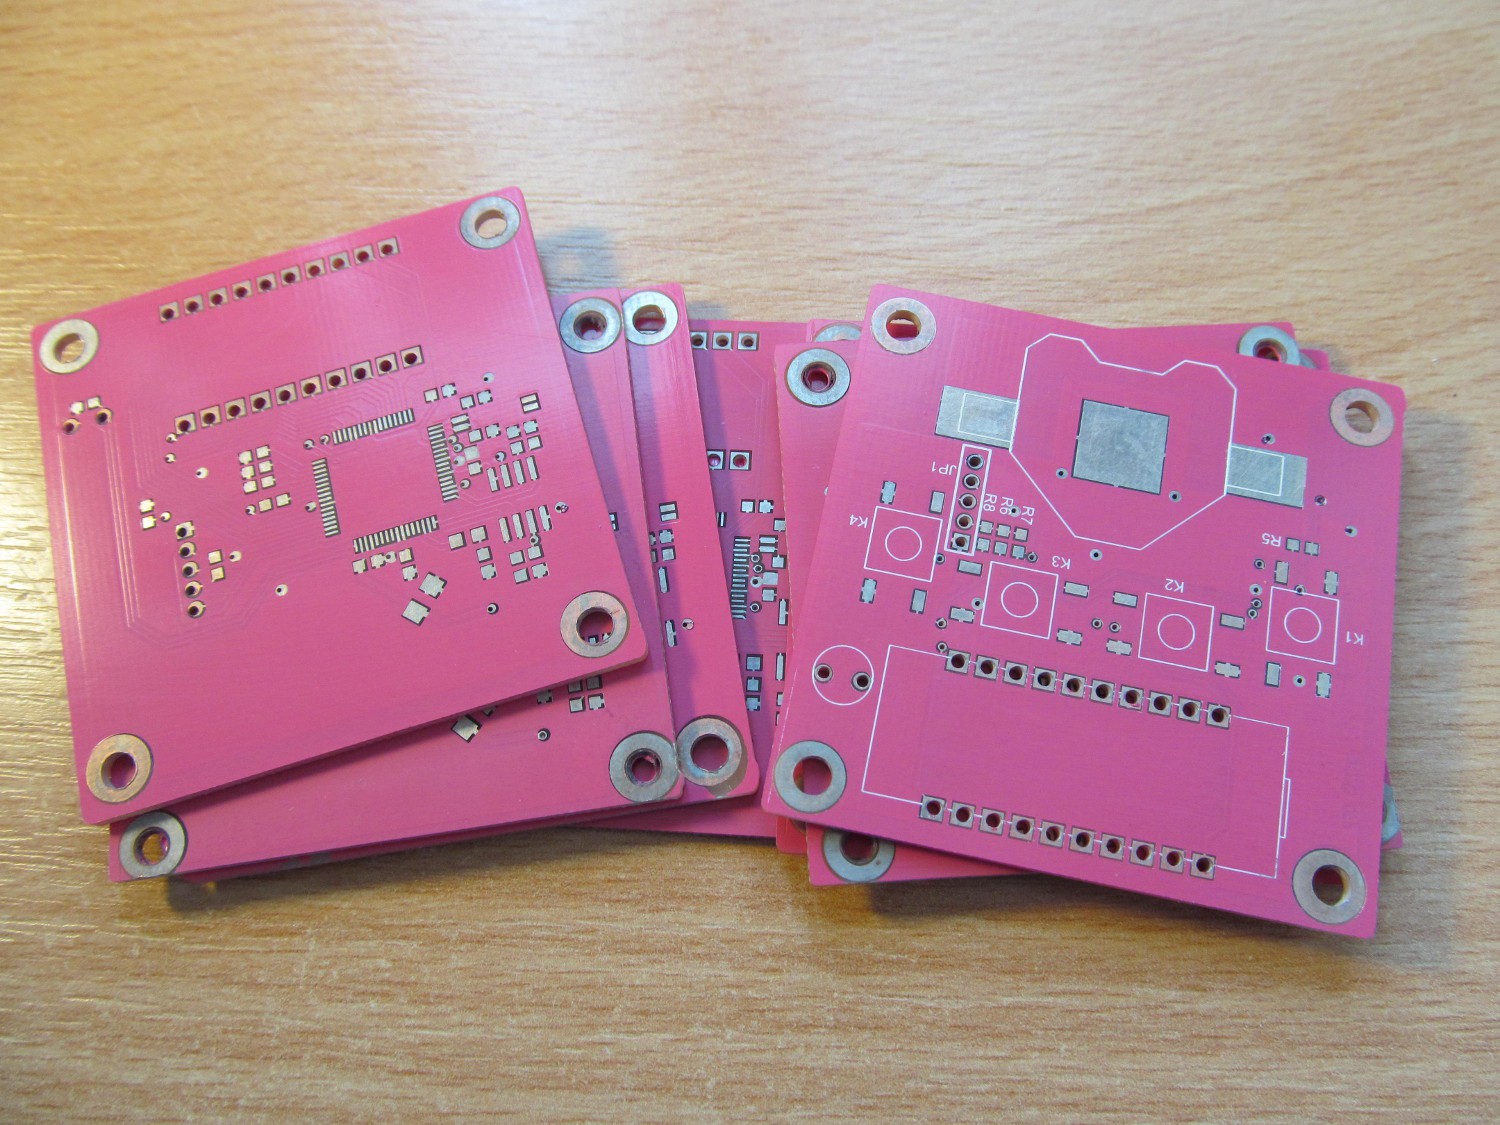
  • Perfect pink PCBs

    jaromir.sukuba01/02/2018 at 18:46 7 comments

    I hope @oshpark will not mind abusing their motto for the PCBs not made by them, but the color is a bit similar.

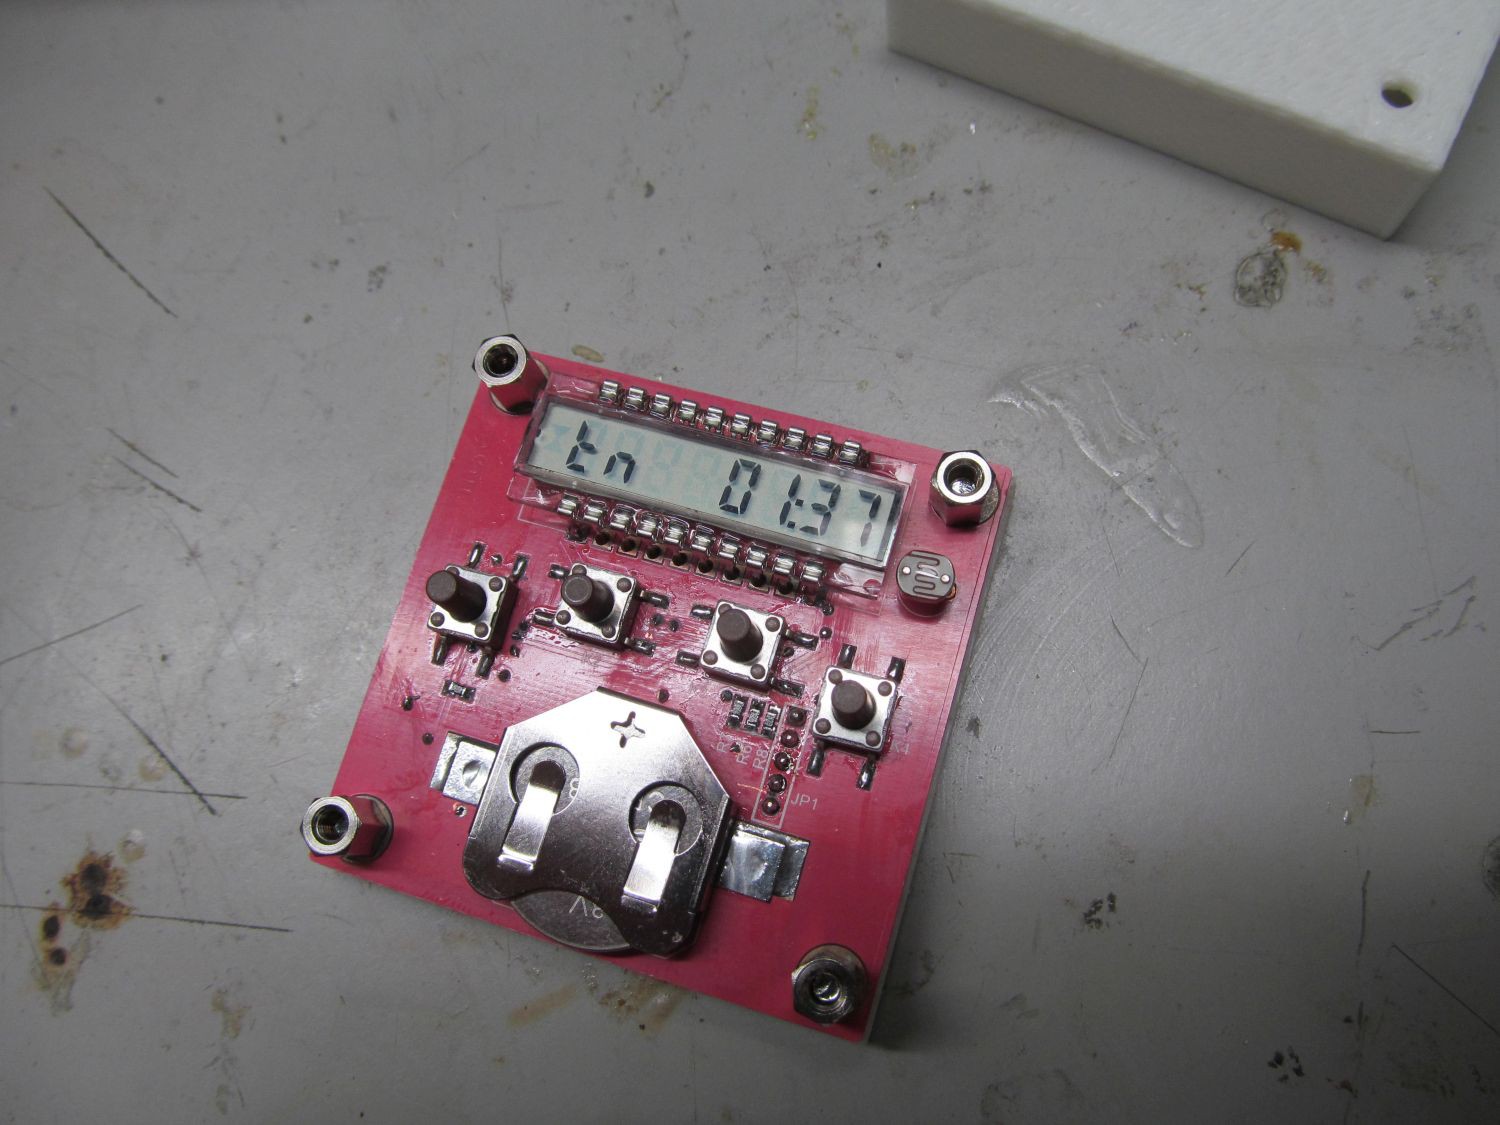
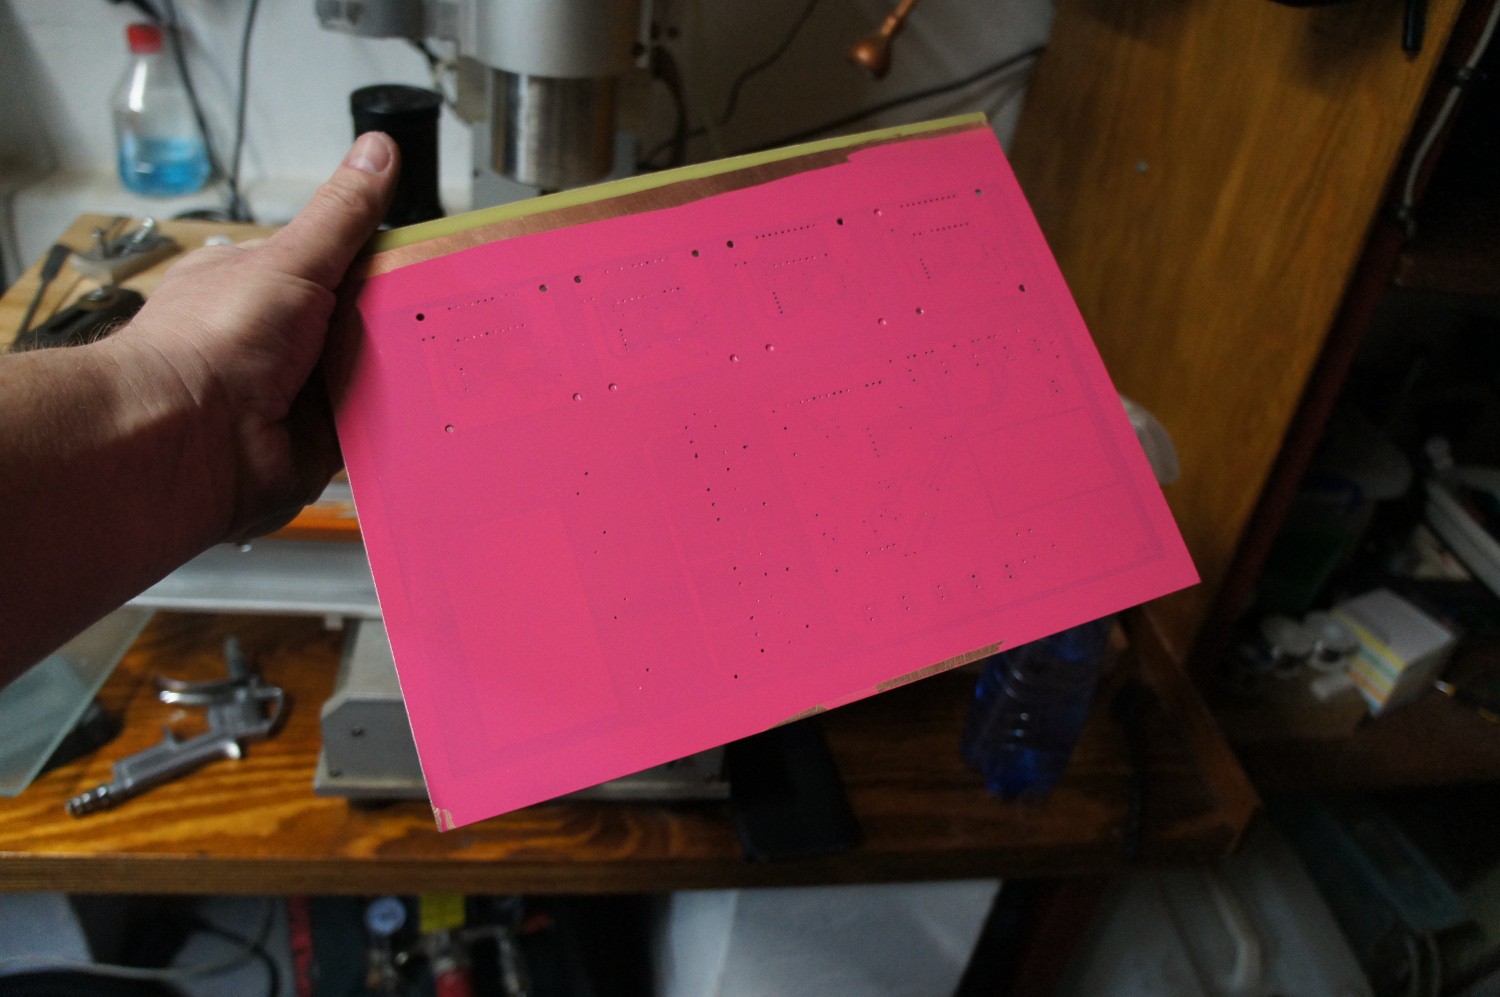
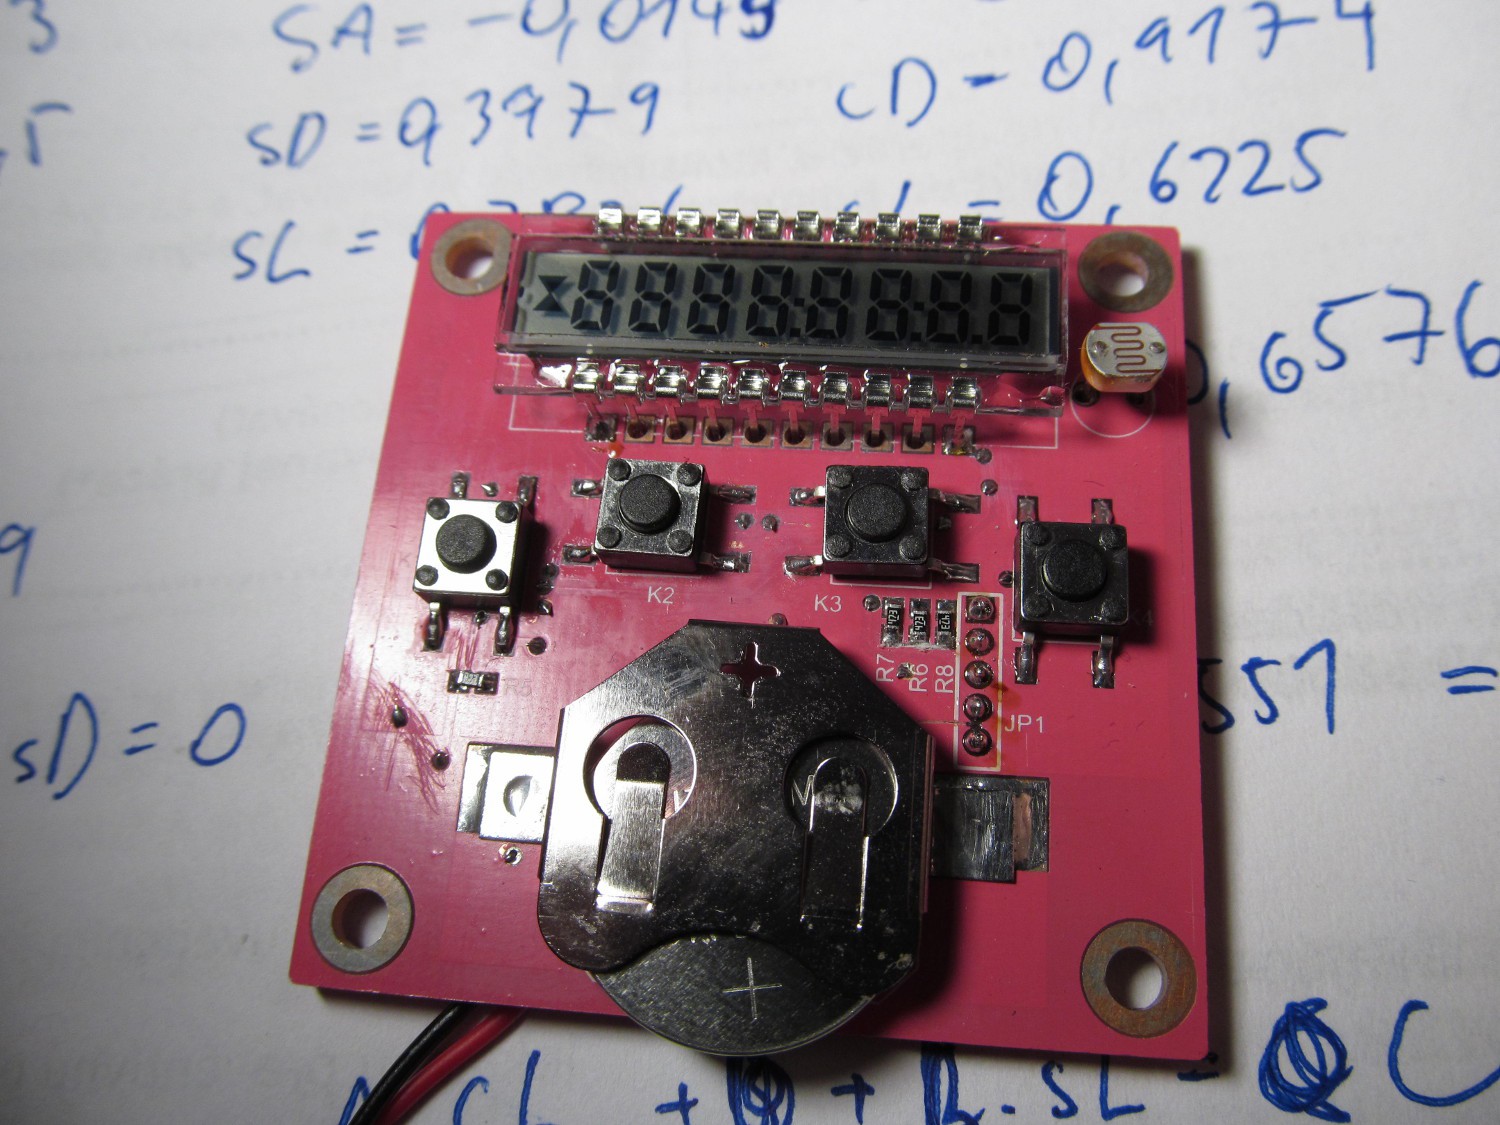
    I asked friend of mine to produce a few boards for me, as I know he is making some PCBs for himself, occasionally. He agreed and asked me what color of soldermask I want - I didn't care much, answering - "I don't know, let it be pink.". - "Say no more."

    Searching for proper shade of the pink color.

    Here it is:

    Already drilled and etched PCB is covered by pink soldermask

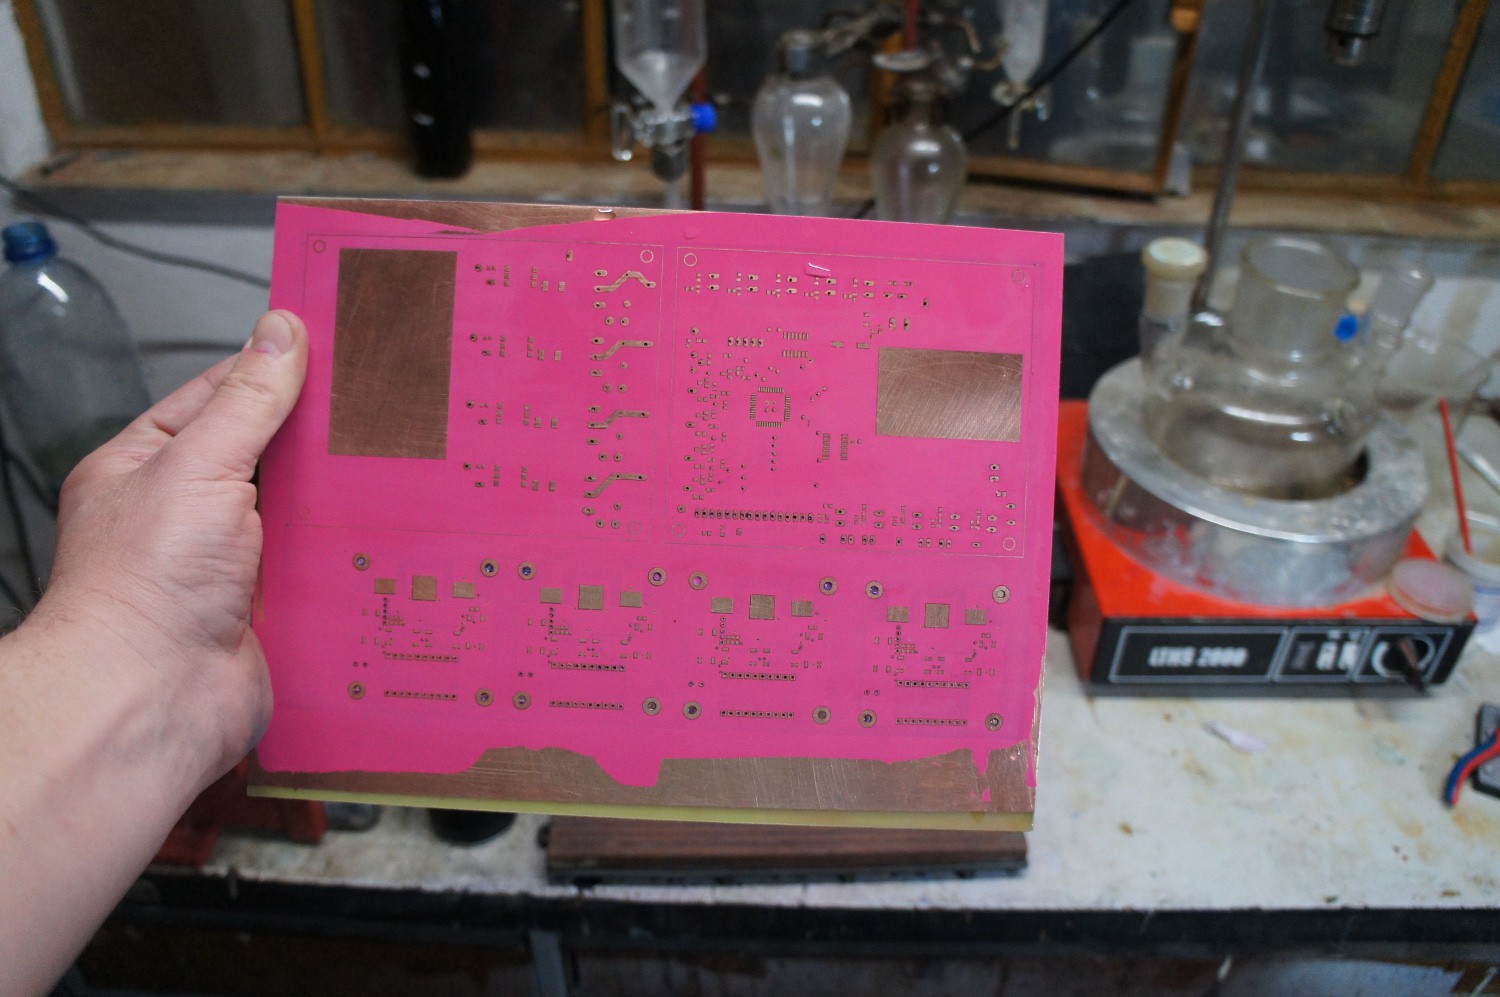
    Soldermask etched away

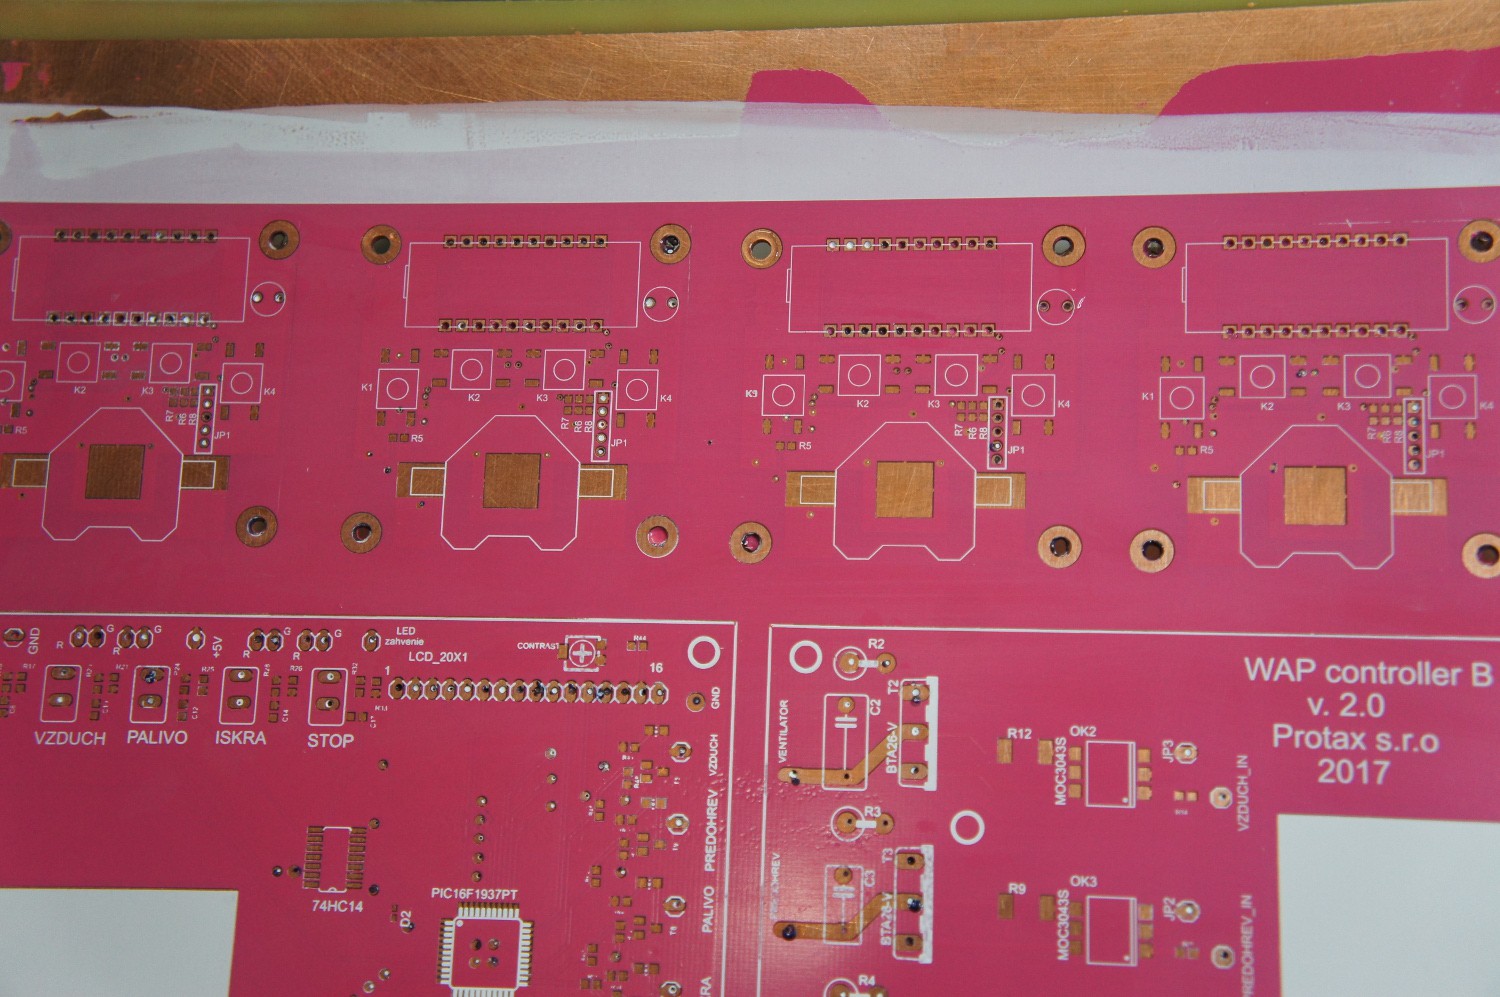
    White on pink, nice combo

    Separated forever

    And detail to my little PCBs

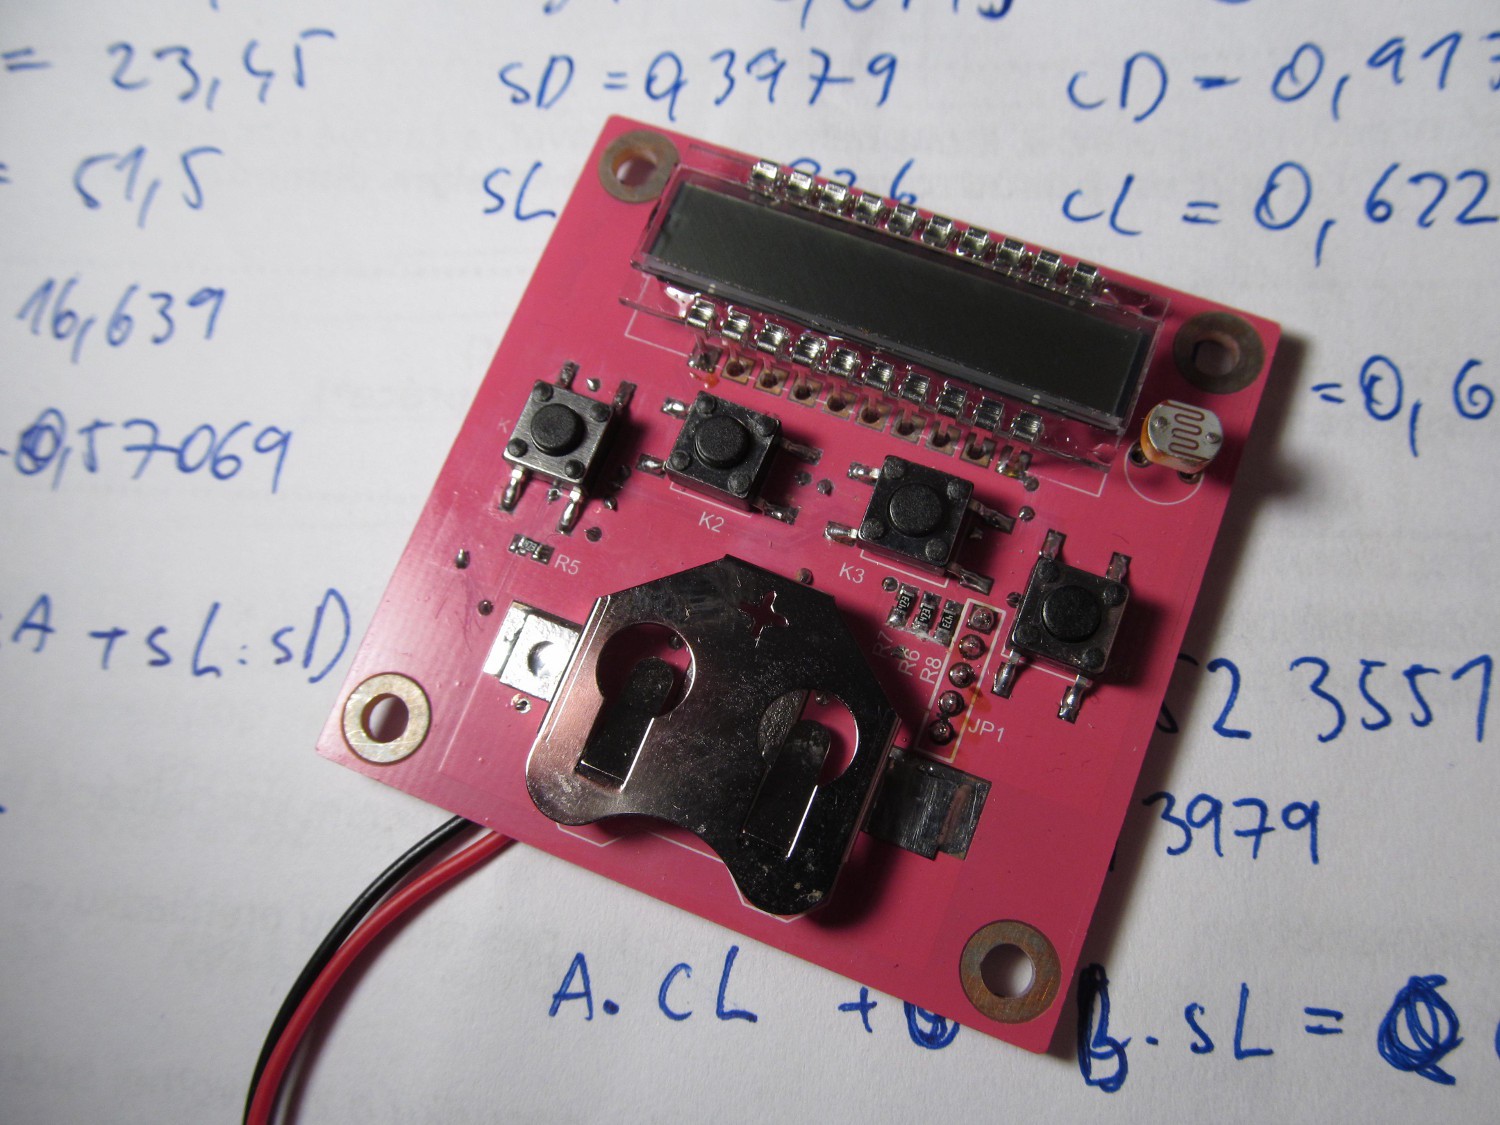
    One PCB populated

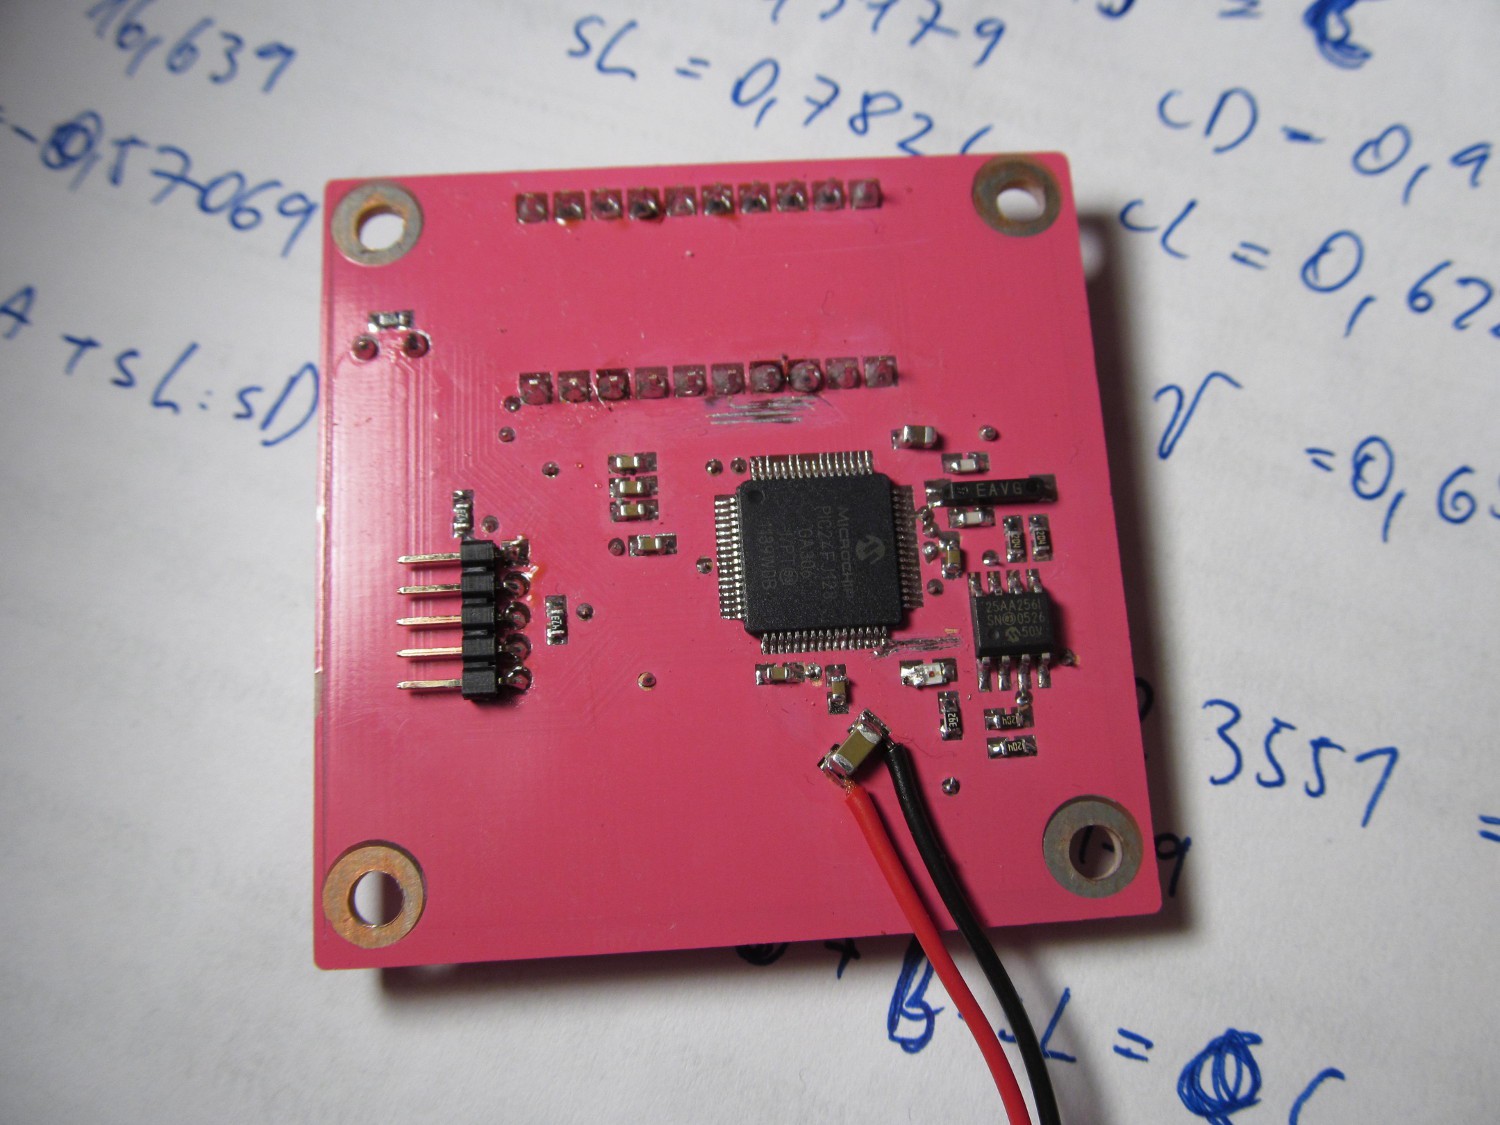
    Bottom side

    The red and black wires are for powering the board during development.

    LCD works!

    So far so good, now I'm going to transcribe the sunrise/sunset detection algorithms, as well as reverse sunrise equation for use with the MCU, do some minor tasks, like user interface and logging - and LLG is done!

  • Sunrise equation

    jaromir.sukuba01/01/2018 at 17:22 6 comments

    The key part of this project is determining location through known date/time and light levels.

    The equation

    Determining geographical longitude from light levels data is relatively straightforward. Take the time of solar noon and compare it to 12:00 of Greenwich time. If it's 12:00, then you are (approximately though) at Greenwich, if not, you are 15 degrees farther to East for each hour.

    Calculating the latitude is somehow different matter. The relation between day length (at particular solar zenith angle), solar declination and geographical latitude is called sunrise equation, in general form looking like this


    where A is solar zenith angle

    L is geographical latitude

    D is solar declination

    O is hour angle

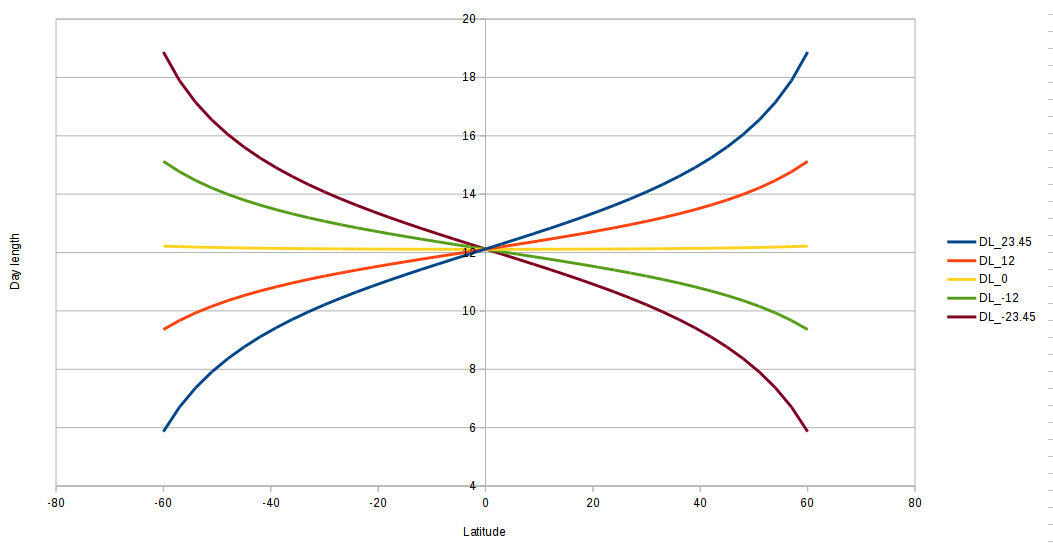
    I played with it a bit, discovering relations between the variables. At first I was curious how does look the relationship between latitude and day length at different solar declinations, as those are the the main variables that come into game.

    Expectedly, I can see strong relationship of day length and latitude when solar declination hits its extremes (winter and summer solstices) and very weak relationship at zero declination (spring/autumn equinoxes).

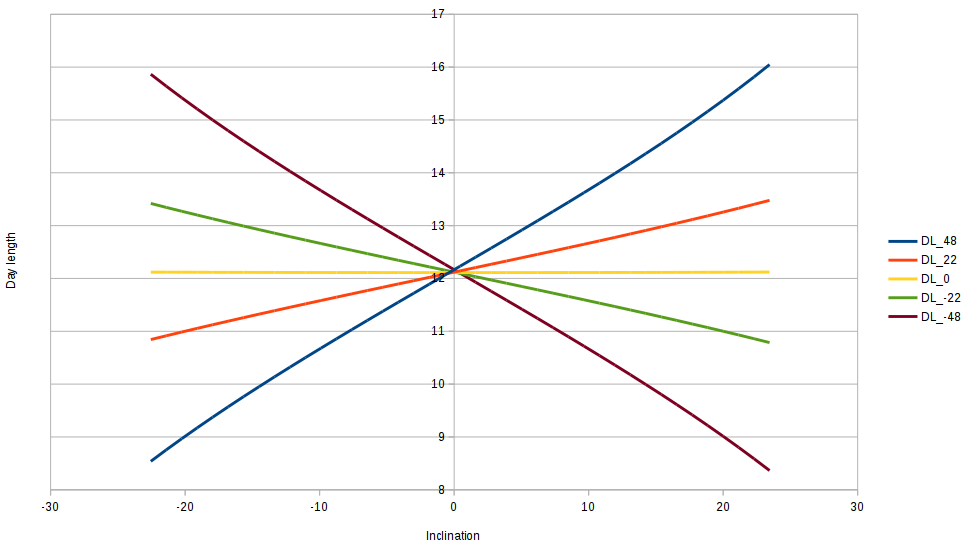
    Change of day length over the changes of solar declination (= throughout the year) is almost linear, for -48, -22, 0, 22 and 48 degrees of latitude.

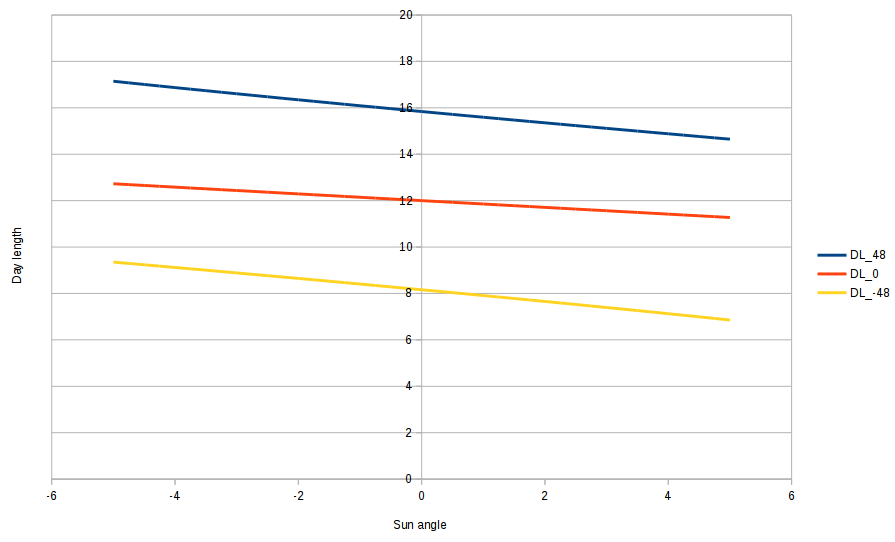
    I was interested also how much the day length is changing when taking into account different solar zenith angles; the previous ones being at -0,83 degrees; being standard for sunrise/sunset tables. Though my detection algorithm triggers at slightly different angle, shifting the measured day length to somehow longer times. Here are day lengths at different sun zenith angles, for three different latitudes (48, 0, -48 degrees)

    and here are just the differences

    The differences are almost linear, with change rate slightly being dependent on latitude.

    The problem

    My problem with this equation is it's reverse of what I need - it gives me length of day from latitude, while I have the day length known, with latitude unknown. It looks like there isn't analytical solution to this equation. For now I have plan of having huge precomputed tables in FLASH memory of MCU and doing lookup, but I can't say I'm happy with it, though it can be quite effective when it comes to power consumption.

  • Blue filters

    jaromir.sukuba12/30/2017 at 00:09 0 comments

    Today was really nice day with lots of sunshine, melting the snow - and freezing right now during the night, so walking on ice covered sidewalks will be fun game - so skies were clear blue. I know explanation why the sky is blue belongs to kids textbooks, but it's relevant here.

    Earth atmosphere does a lot of things to light incoming from outer space, one of them is dispersion. The shorter is the wavelength, the stronger is the dispersion and shortest of visible wavelength is blue light, so the blue light we see overhead is actually a dispersion happening everywhere in atmosphere around, especially when Sun is high above horizon. When it's low, sky is somehow more colorful.

    By Jessie Eastland - Own work, CC BY-SA 4.0, https://commons.wikimedia.org/w/index.php?curid=61912268
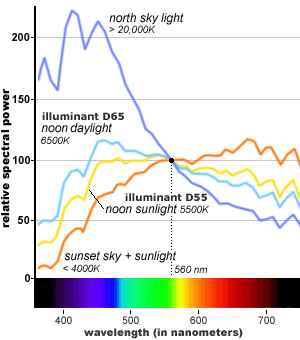
    During sunrise (and during sunset too, from the same reason), sun is low above horizon, light from Sun has to travel long distance through atmosphere, where a lot of diffraction happens (and people in "higher" timezones see this light as their blue sky), so Sun looks orange or red, as its light is stripped of shorter wavelenghts. As the solar elevation angle is getting higher, the path through atmosphere is getting shorter, lose of short wavelength is decreasing and sun appears more "white", see on picture taken from here:

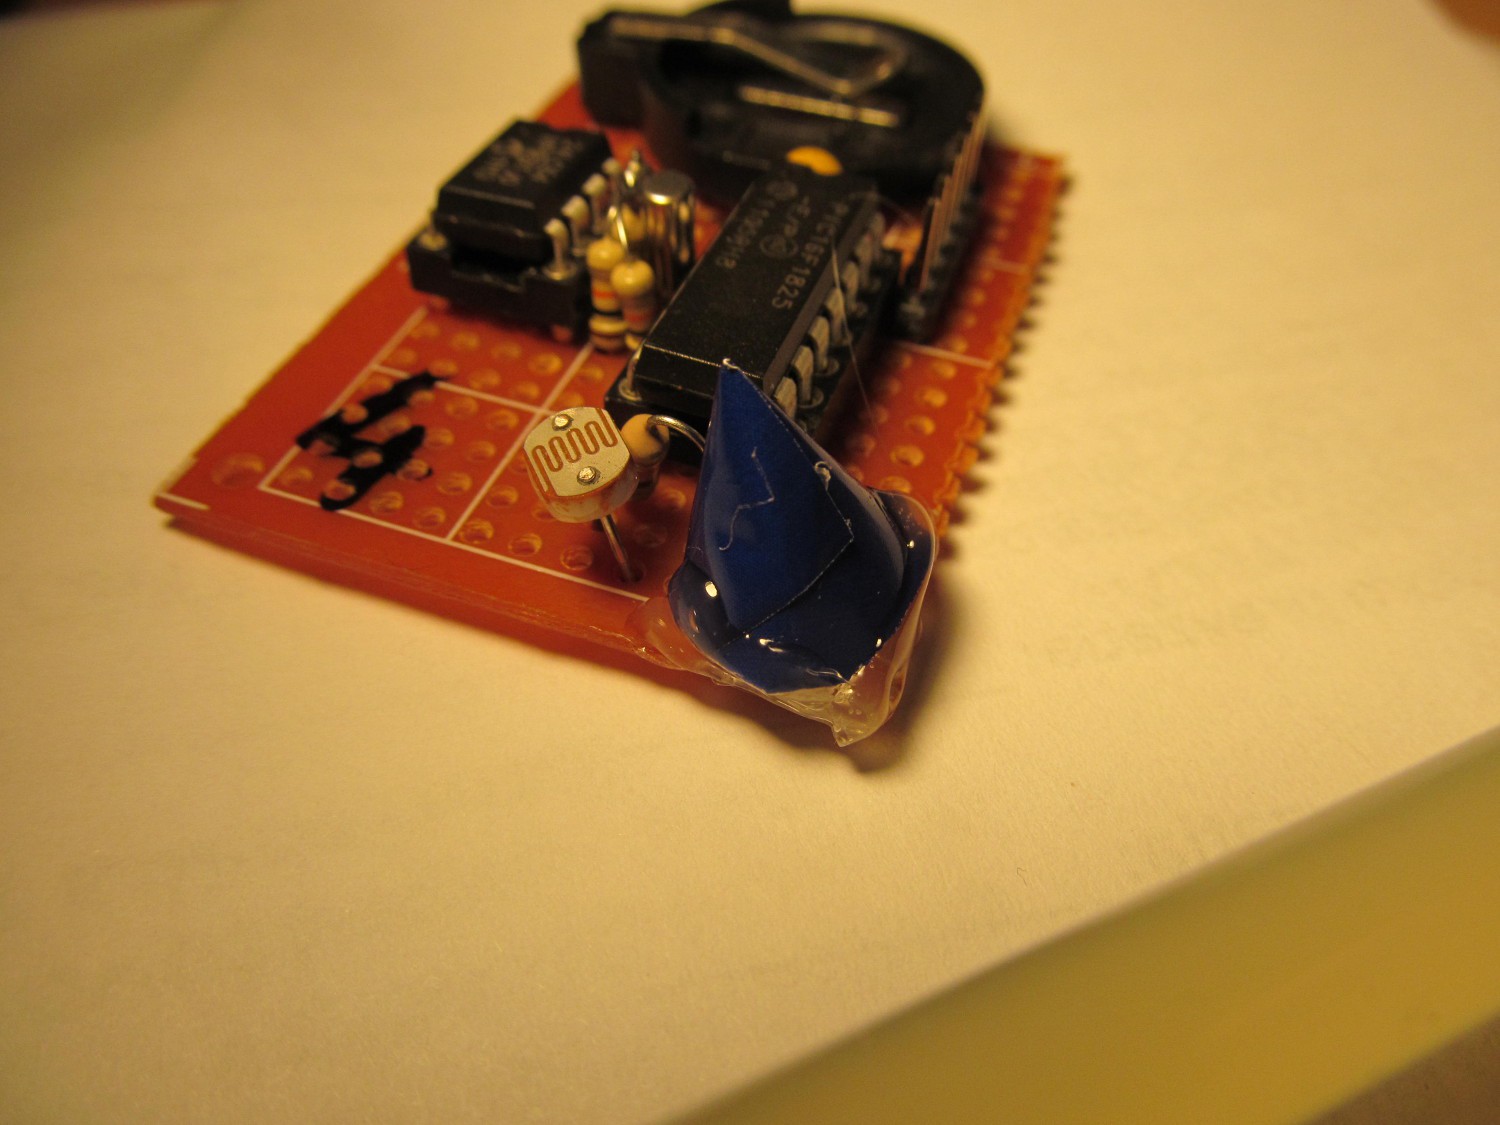
    I was curious about how much the measured light output will change with blue filter on LDR, so I removed photodiode, added another LDR
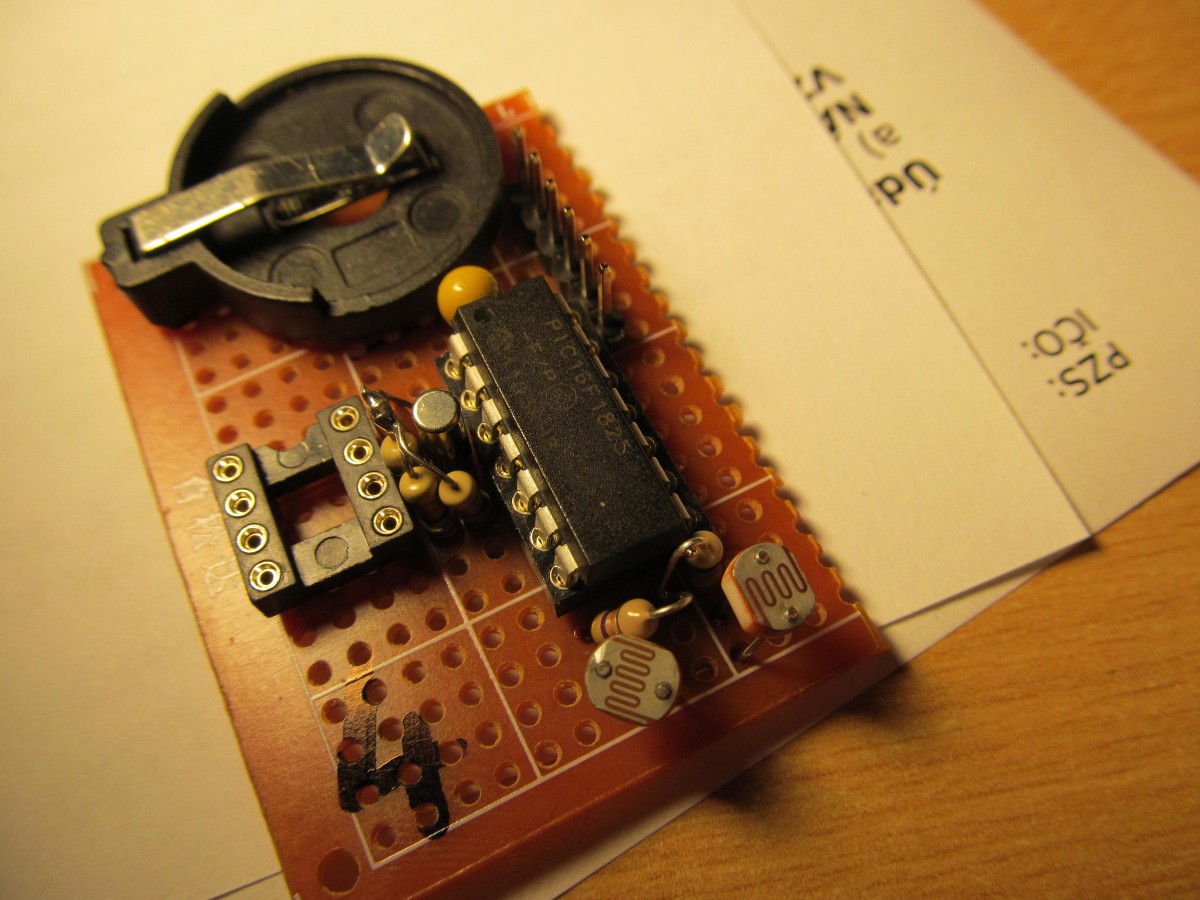
    and set cone made of blue plastic sheet on top of it, secured by obligatory hot melt glue

    and let run for a few days. Here is the logs look like
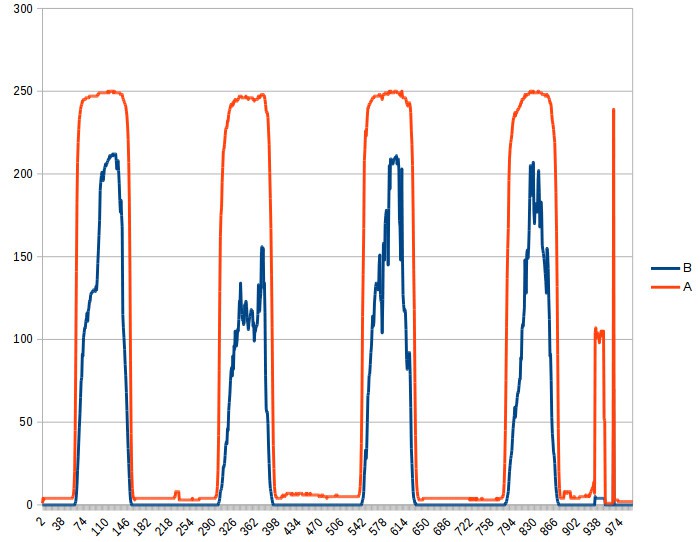
    A is unmodified channel, B is blue channel. The output from blue channel is much lower, probably due to thick and opaque filter.
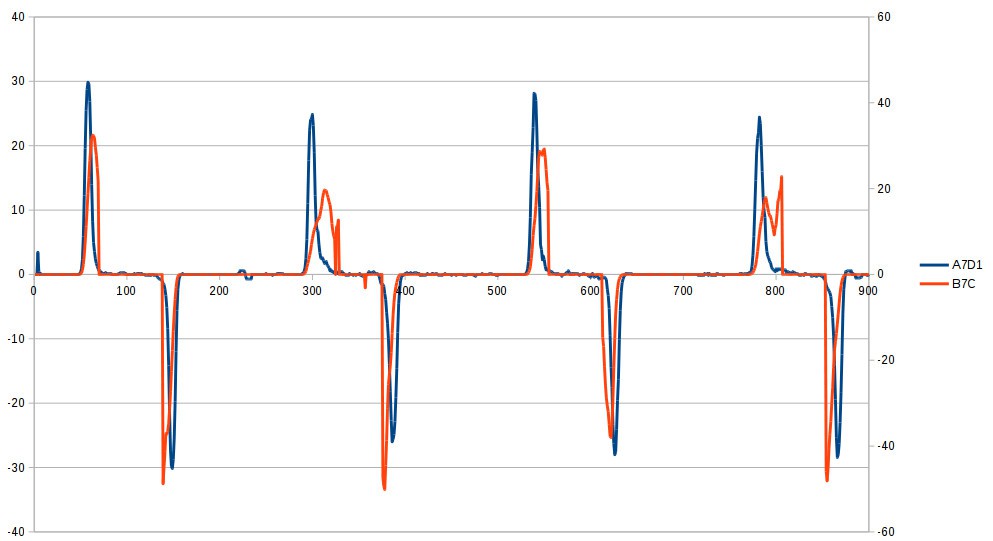
    I made also derivation of the output. Blue line is clean channel, red is derivative of filtered channel. It was quite noisy, so I cut down when intensity from filtered output is above 50%. The peaks, corresponding to highest change of blue filtered channel do happen later on sunset and earlier on sunrise as opposed to clean channel - that is, the same algorithm on blue filtered LDR outputs events on higher solar elevation angle than unfiltered. The result is quite noisy, though, due to the opaque filter.

    The advantage of detecting higher elevation angle may not be obvious, but it may help in increasing accuracy of geolocation by eliminating a lot of light level distortion due to obstacles in light path on horizon (mountains, trees, man-made objects) and partially weather.
    I'll rework the opaque filter and try it again, to get less noisy results.

  • First log data analysis

    jaromir.sukuba12/28/2017 at 00:40 6 comments

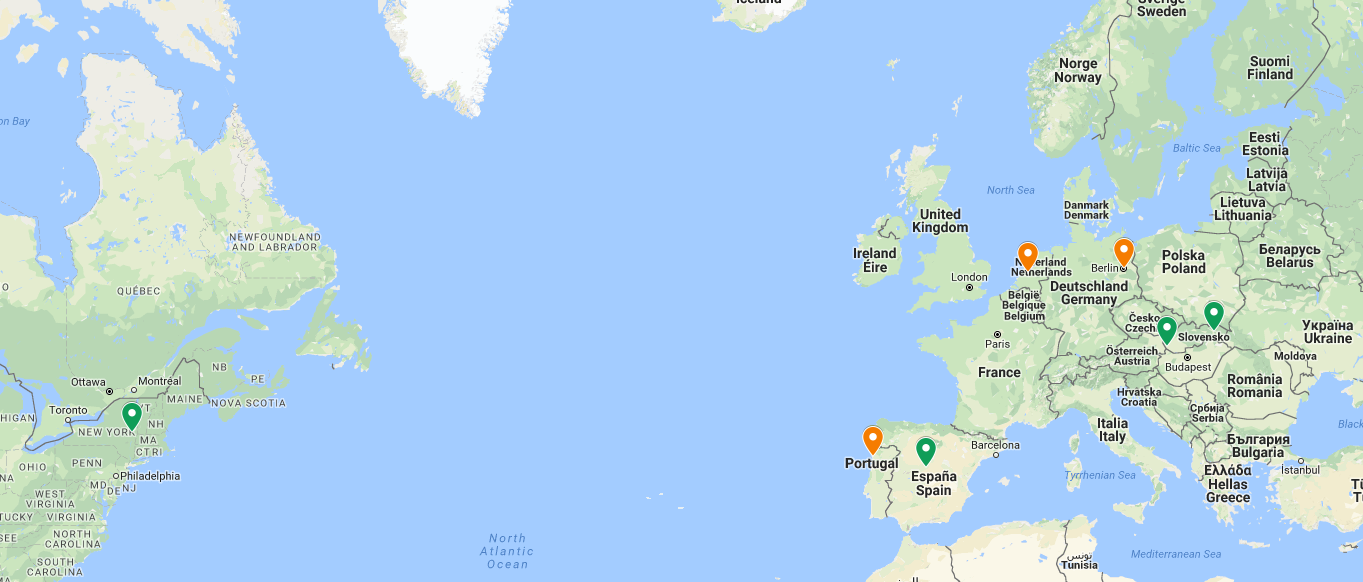
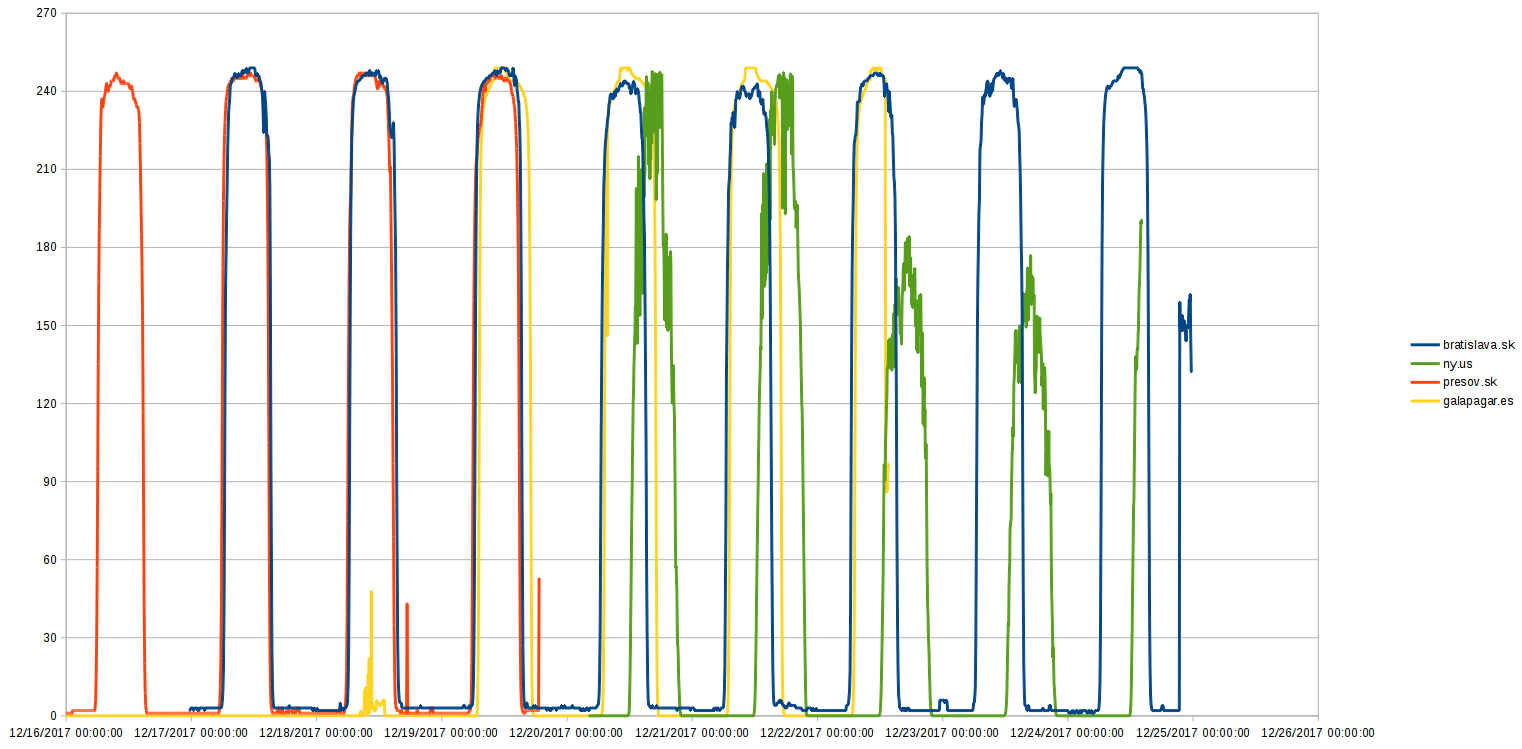
    By now I have measurement data from four places - two from Slovakia, one from Spain and one from US; those are the green ones. The orange points are from places where loggers finished their job, but I still haven't them at home.

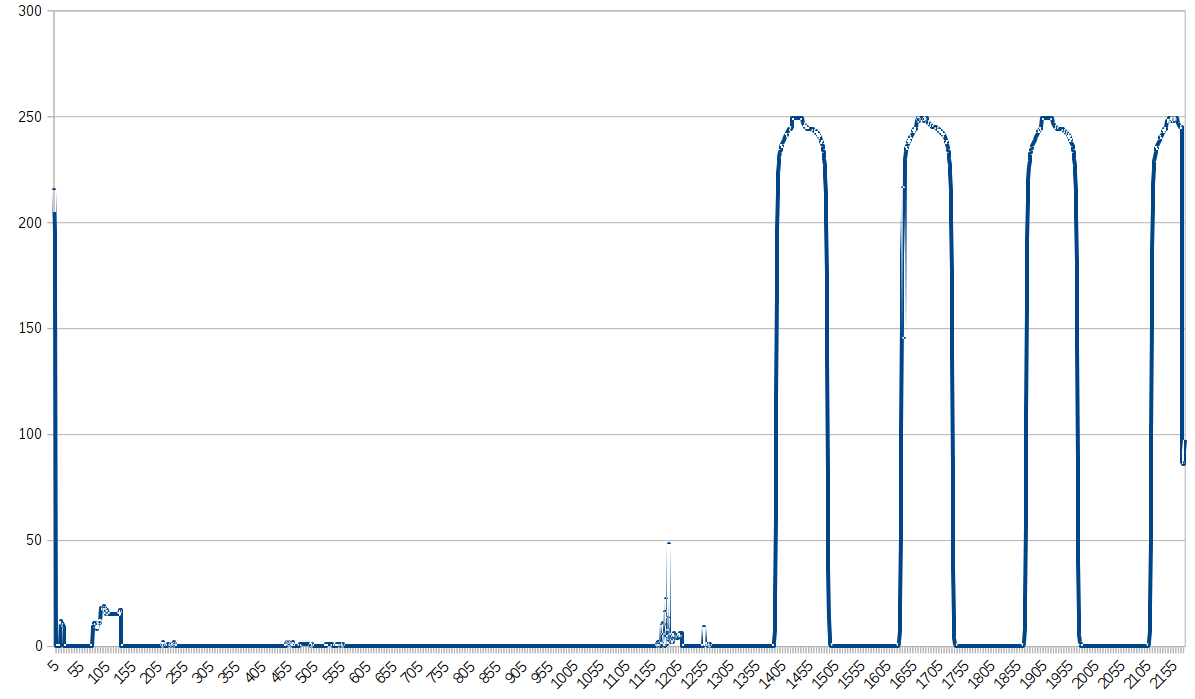
    The loggers doesn't have internal RTC, just timer set to 6 minutes to wake up and perform light measurement, so I had to note the time when the loggers were started before packing, in order to assign timestamps to measurements. Typical record from logger looks like this

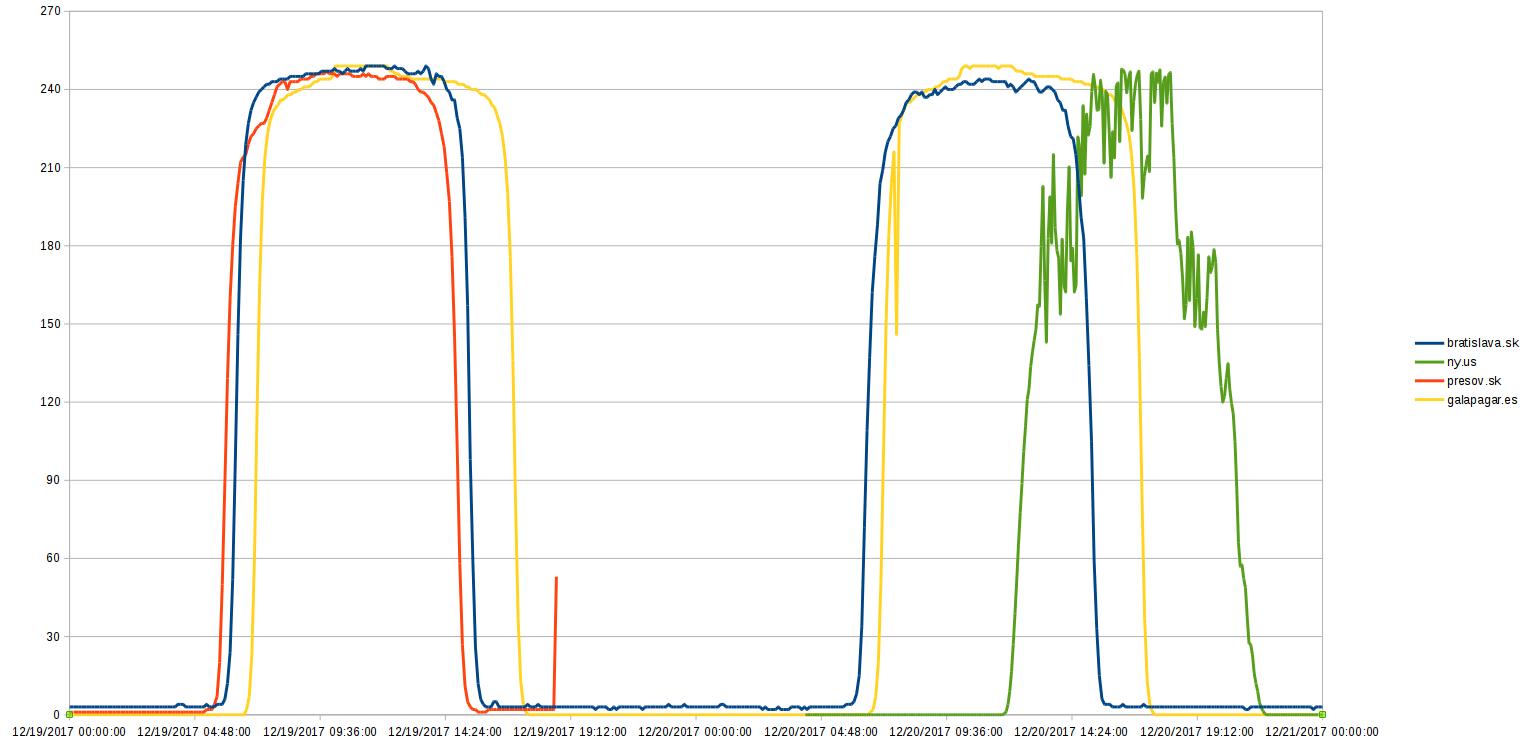
    This is raw ADC count from LDR channel. The peak at the beginning is light at my desktop in Bratislava when I packed it, the minor light levels measured around points 100, 230 470 and 560 is light leaking into paper envelope during transport, finally around point 1200 the package was open and manipulated; at point 1400 there is first sunrise in Galapagar, Spain. After adding timestamps I blended all available data into single graph, looking like this

    This is starting to look interestin. Firstly, the data look reasonable; the loggers were not extensively tested and all it could return with could be all zeroes or some other rubbish. This was not the case, so I could go on. I zoomed at 19th-20th of December:

    Comparing to blue line (my hometown), I can make following observations:

    1, The sun in Presov, Slovakia (red line) rises earlier and the day is a bit shorter. As it's located slightly northern and approximately 320km eastern, it's quite expected.

    2, Galapagar, Spain (yellow line ) has later sunrise and longer daylight. Again, that is not surprising, being ~1500km on west and ~900km southern compared to Bratislava.

    3, Clifton park in NY, US: daylight something between Spain and Slovakia, local noon shifted rather right (later), being roughly another 5200km more on west than Galapagar.

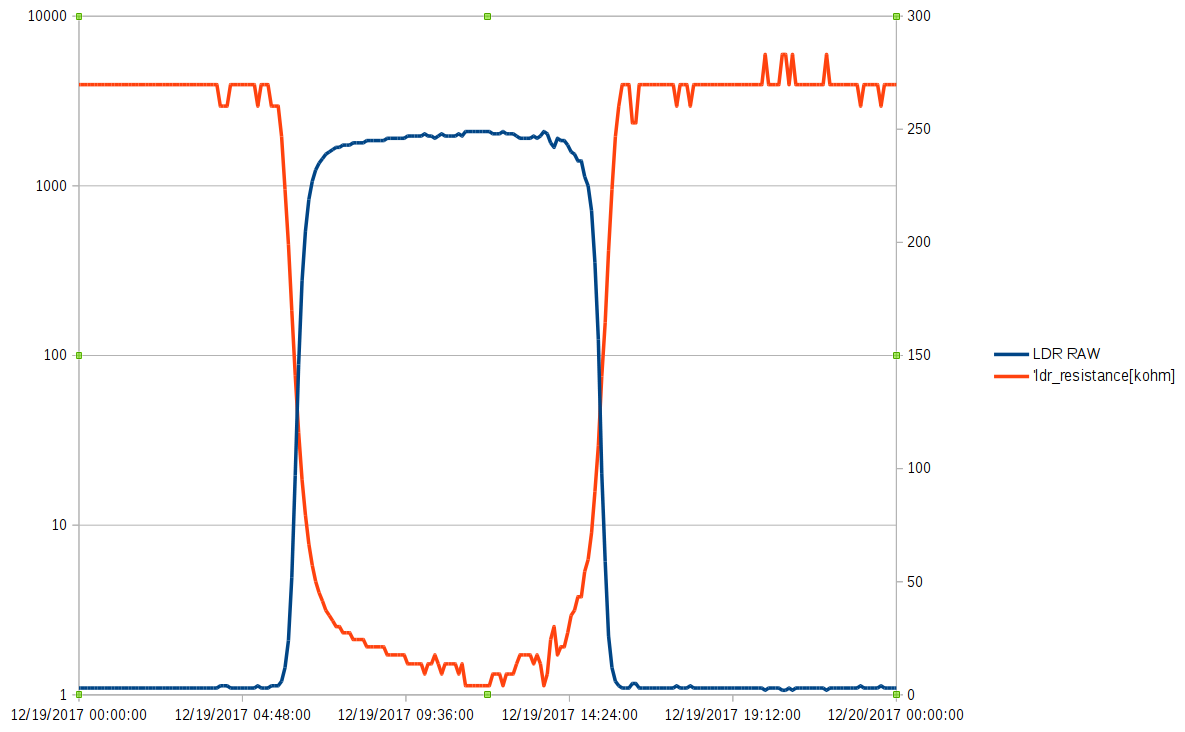
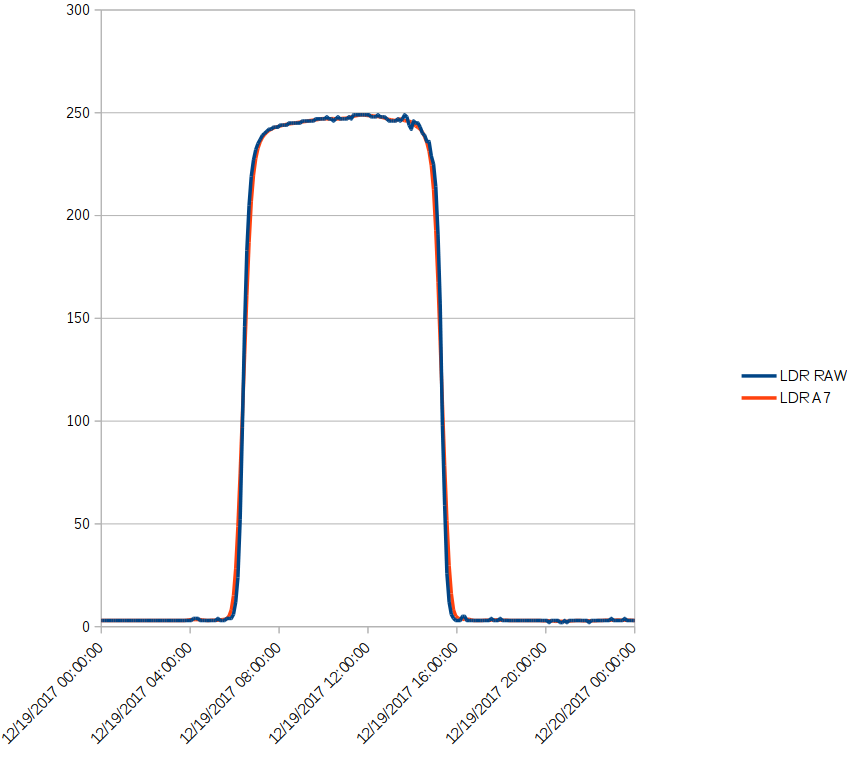
    So far, so good. Reality is checked, loggers seem to do the job correctly, Earth doesn't seem to be flat. Now I need to dissect the data some more, in order to obtain sunrise and sunset time. This is how single day looks like, blue line is raw value from ADC channel where LDR is connected (right axis), red line is resistance in kiloOhms (left axis, logarithmic scale):

    Interesting enough, illumination of LDR in lux is inversely proportional to log of its resistance, meaning the graph of illumination in logarithmic values would look very similar to the blue graph (raw ADC value), just with different scale. For now I won't bother with converting ADC values to resistance of LDR and then illumination, I assume I can use ADC values directly with good accuracy for the purpose of dusk/dawn identification. Because those events are easily identified as change in illumination due to particular place on Earth moving from/to its own shadow, it looks logical to me to search for major changes in illumination, that is performing numerical derivation.

    Though this may be nice exercise for machine learning and artificial neural networks, keep in mind I have to choose algorithms that are easy to perform on low-frequency clocked microcontroller.

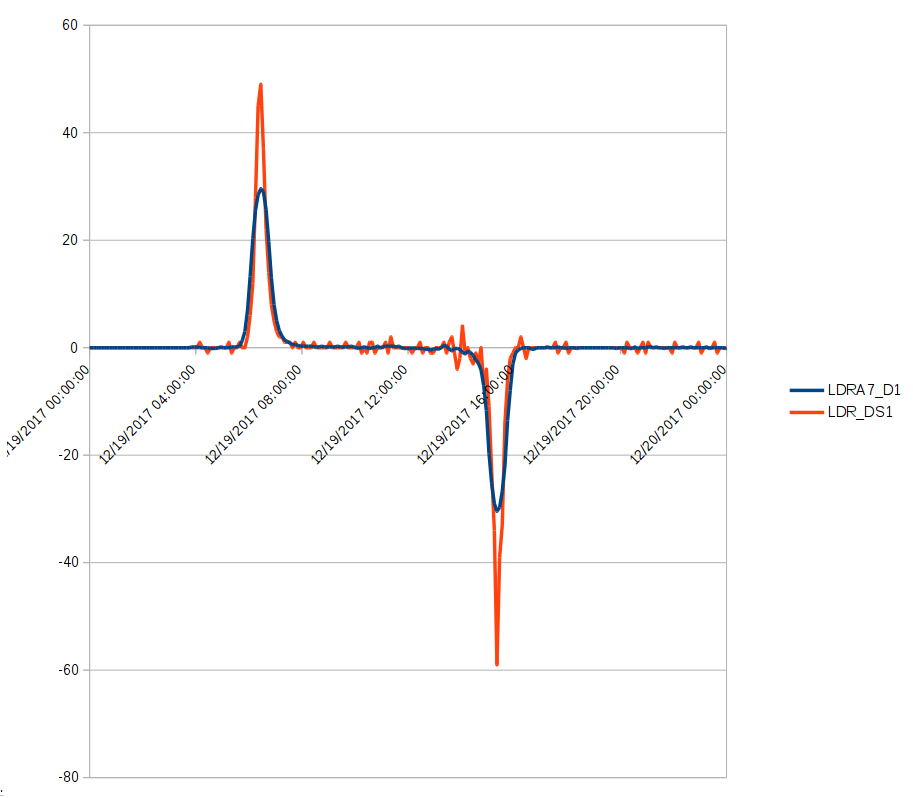
    At first I applied one of simplest FIR filters on input data - running average filter, with 7 samples around midpoint. The difference doesn't look very convincing at first

    Differences starts to appear as soon as differentiation is applied:

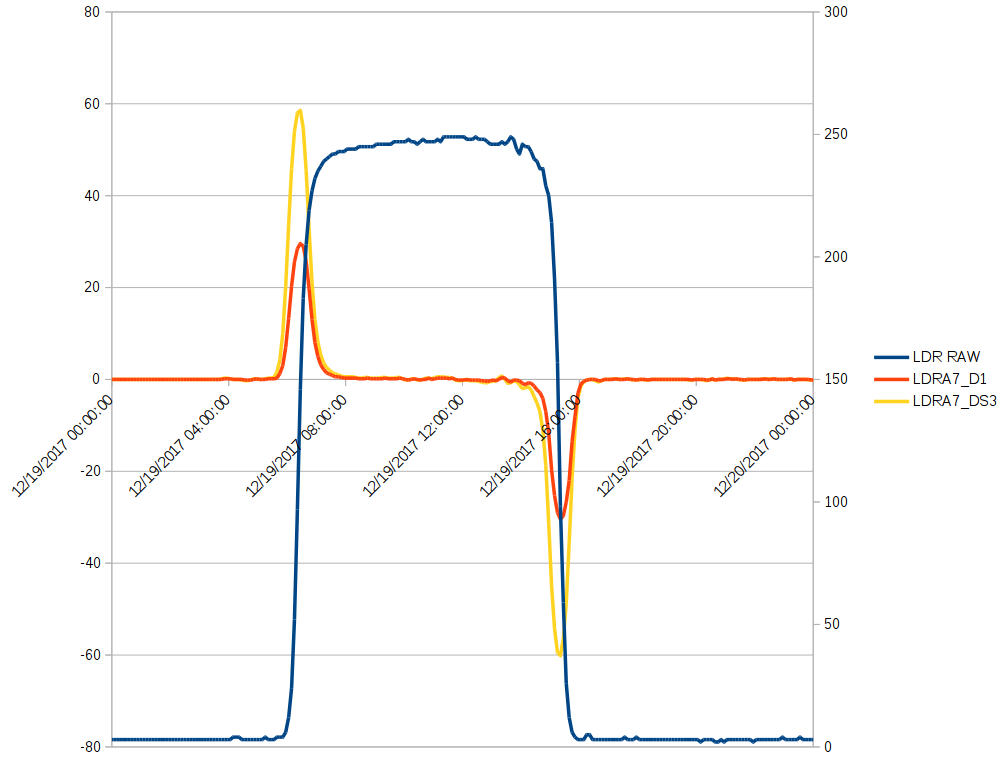
    The blue graph is from filtered data, providing much more stable identification of illumination changes. Previous data combined into single graph:

    Blue line is raw ADC count (right axis), red line is difference from previous sample (left axis). I also added "wide" difference, where N-th result is difference between N+1th and N-1th member of input data. I was curious whether this will make any impact on sunrise/sunset resolving accuracy.

    Then I "manually" identified all peaks from input data, calculated...

    Read more »

View all 15 project logs

Enjoy this project?

Share

Discussions

tovol37573 wrote 06/19/2021 at 06:33 point

Its very interesting to see this project that you shared here I am also working on a similar type of project you can see here lumenauthority website.

  Are you sure? yes | no

Mike Gore wrote 01/19/2018 at 21:13 point

Perhaps you could also measure the sunlight polarization angles - say use a few sensors with polarized filters. This would permit locating the sun even when overcast.

  Are you sure? yes | no

royvanlierop92 wrote 01/18/2018 at 14:13 point

Could you use the light incident angle to determine the position?

I was hoping to find some MEMS light incident angle sensors but having trouble finding them. 

  Are you sure? yes | no

jaromir.sukuba wrote 01/19/2018 at 08:01 point

That is interesting approach. It would require to keep the receiver in one position during the day, or at least measure its inclination to ground via accelerometer/compass and compensate the tilt/azimuth. The incident angle sensor could be probably improvised by linear CCD array and something to throw shadow on it.

  Are you sure? yes | no

pmb wrote 01/12/2018 at 15:17 point

Note that crystal oscillators are not really that accurate unless calibrated. As a rule of thumb you may be accurate to within 100 ppm, which in your longitude calculations would correspond to a drift of around 4 km/day. Approximately half of this can be calibrated as it is a constant whereas the rest is mainly due to temperature (but can also be calibrated to a high degree if you have temperature measurements as well).

EDIT: Just saw your comment about this in the text above as well... :-)

  Are you sure? yes | no

radimsejk wrote 01/09/2018 at 13:19 point

Great project! I am from Czech republic and I can help you too if you want this area to be covered..

  Are you sure? yes | no

Ted Yapo wrote 12/18/2017 at 23:24 point

Shipping to here is probably expensive, but if your circuit is generic PIC/LDR/phototransistors, I could probably breadboard one, and save you the cost.

https://www.google.com/maps/@42.8791931,-73.8244859,16z

  Are you sure? yes | no

jaromir.sukuba wrote 12/19/2017 at 08:16 point

Shipping is not only expensive (not that much of problem), but also slow (that is the problem). I'd be glad to guide you building the logger.

Circuit is here https://hackaday.io/project/28550-light-level-geolocator/log/71494-light-loggers

The sources of logger are not on github yet, but I'll take care of that.

It expects PIC18F1825, but it can be recompiled for something similar. The memory is 24LC64, but one can use anything from rnage 24xx16 to 24xx256. For memories smaller than '64 the log will wrap around (that can be adjusted and recompiled), memories bigger than '64 will be partially empty (again, this can be adjusted).

LDR is generic chinese LDR, with resistance ~15kOhm at room light level. The exact resistance doesn't matter much. Phototransistor is again some generic one, though I expect data from phototransistor will not be used and final LLG will employ only LDR.

Of course, you ca use different means of logging the resistance of LDR - those loggers were meant to be small, self contained and easy to ship. As usual, there is multiple ways to get to destination. You may also employ logging DMM, for example.

  Are you sure? yes | no

Ted Yapo wrote 12/19/2017 at 16:51 point

The easiest for me is probably to use an arduino nano to measure the LDR and report back over serial to my desktop (always on) for logging with a timestamp from the PC.  My office has a convenient window on the "dark side" of the house facing the woods - I can run a wire outside.  Is 10-bit ADC resolution OK?

I can also connect a VEML7700 board to record more-or-less calibrated lux values at the same time.  This might help in calibrating the LDR.

https://hackaday.io/project/12874-automated-ledlaser-diode-analysis-and-modeling/log/43545-sensor-board-software-leds-and-lasers

I can probably get things in place for dawn tomorrow.

  Are you sure? yes | no

jaromir.sukuba wrote 12/19/2017 at 23:14 point

@Ted Yapo   10-bit of resolution is plentiful. The PIC has 10-bit ADC too, but for sake of simplicity I'm using only 8 MSBs into the log. I think is fine to find slope in light level values (dawn/dusk) and fit line to it. Final LLG will have more precise data, but I believe even here 8-bit would be OK.

The only thing that can upset the measurement are strong artificial lights - especially those turned on/off at dawn/dusk.

The VEML sensor is nice to have, but not necessary. In fact, none of my sensors is calibrated in any way, and if the principle of LLG should work, calibration shouldn't be needed anyway. I want to make your work as simple and fast as possible can be; if you prepare logger just with arduino, one LDR and fixed resistor, throwing out raw ADC count one per minute, I'd be happy.

  Are you sure? yes | no

Ted Yapo wrote 12/18/2017 at 21:20 point

The inverse problem is also interesting: an LDR sundial which, once told where it is on the planet, figures out what day of year and time of day it is.

  Are you sure? yes | no

blkhawk wrote 01/09/2018 at 15:02 point

Indeed I might run with the idea - just instead of a LDR I would use a solar cell - use it as the sensor as well. during the day the lcd would stay on displaying the time/day.

  Are you sure? yes | no

Ted Yapo wrote 01/09/2018 at 15:16 point

You could use some sort of Kalman filter to integrate each day's new information with the RTC.

  Are you sure? yes | no

Ted Yapo wrote 12/18/2017 at 16:51 point

Do you think you will be able to calculate position on the uC, or is the math too complex?
 (trig functions, etc)

  Are you sure? yes | no

jaromir.sukuba wrote 12/18/2017 at 18:25 point

Calculating the position in MCU is my main goal. The simple loggers I shipped are just plain dumb light loggers, but the final LLG is expected to calculate its position.

  Are you sure? yes | no

Ted Yapo wrote 12/18/2017 at 18:52 point

Nice. I guess you have 24 hours of processing time to calculate each position if you need it :-)

  Are you sure? yes | no

jaromir.sukuba wrote 12/18/2017 at 18:57 point

@Ted Yapo very roughly 12 hours, actually. I can calculate the position twice per day.

  Are you sure? yes | no

jlbrian7 wrote 12/13/2017 at 04:30 point

I would be happy to volunteer as well, if you want more people.

  Are you sure? yes | no

Chrunchstick wrote 12/12/2017 at 22:53 point

Awesome idea! Can I volunteer to record data?

  Are you sure? yes | no

jaromir.sukuba wrote 12/12/2017 at 23:26 point

Oh, Netherlands, that is good! Thanks for volunteering, we can arrange it via messages.

My loggers are all "reserved", so I'm going to make new batch of loggers, as I have one more volunteer right now.

  Are you sure? yes | no

Similar Projects

Does this project spark your interest?

Become a member to follow this project and never miss any updates