-
Organizing the build in a single place
11/25/2019 at 18:59 • 0 commentsHello everyone,
I am trying to organize this build in a single place on my weblog and will be updating it regularly with more diagrams and eventually some Arduino/Teensy source code for data acquisition into the SD card.
Please let me know your thoughts on this post here: https://hefnawi.me/posts/custom-built-isothermal-calorimeter/
I would like to here your feedback as well as any suggestions you would like to know or read about this build.Thank you very much,
Ahmed Hefnawi =)
-
NaHCO3 Raw Readings
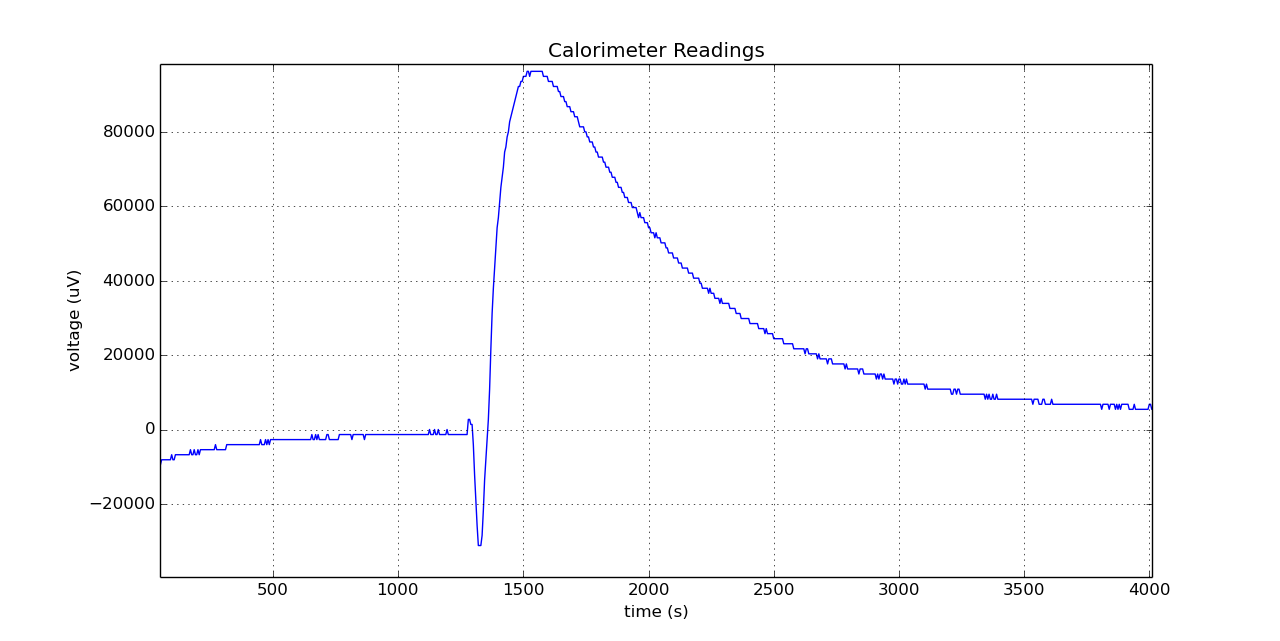
04/18/2015 at 20:04 • 0 commentsI added some NaHCO3 with water (exothermic reaction) into the sample vial and the reference vial contained sand at that time.
The following is a plot of the raw calorimeter readings in micro-Volts versus the time in seconds, the plot was created in Python using matplotlib.
![]()
I thought I should add the thermal power after conversion as well in milli-Watts,
![]()
-
Calibration Results + Heat Equations
04/18/2015 at 02:41 • 0 commentsCalibration Coefficient as well as baseline was calculated using the calibration procedure explained in the previous log.
Next, I'll start calculating the heat of hydration for a cement sample with the help of a PhD student at my University.
Where,
U: Calorimeter Output in Volts (V)
P: Thermal Power in Watts (W)
Q: Heat Produced in Joules (J) or J/g
mc: Cement Weight in grams (g)
The duration of the experiment will be 3 days.
Also the calorimeter readings are logged every 5 seconds onto the microSD card.
-
Calibrating the Calorimeter
04/08/2015 at 16:07 • 0 commentsIt's time for calibrating the calorimeter! There are two parameters I'm interested in for the cement hydration process, which are:
- Calibration Coefficient
- Baseline
Calibration Process
- Measuring The Calibration Coefficient
- I'm using the following items
- A pair of 1/4W and 0.1% accuracy 120Ω precision resistors, they will act as the heaters during the calibration process. One is placed inside the sample vial and the other is an external resistor placed in series with the one inside the vial to be able to measure the current going through the resistor (to eliminate errors from resistor leads).
- An external power supply to go through the resistors is a 12V DC coming from an ATX computer power supply or a 9V DC battery.
- A Multimeter to measure the voltage across the external resistor.
- The Procedure
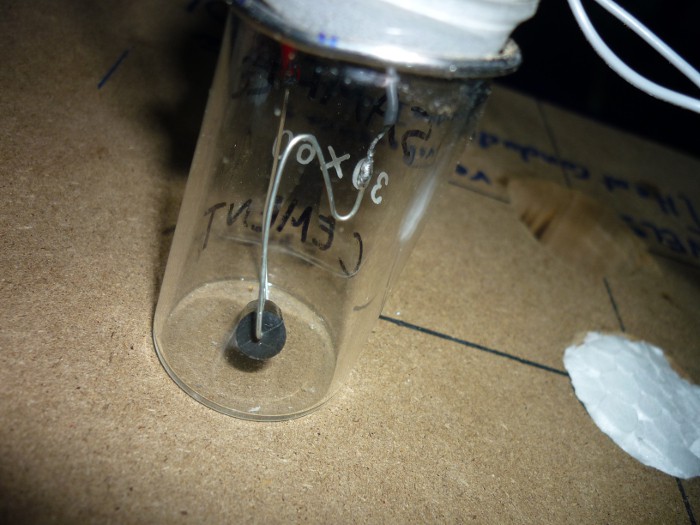
- I put one of the resistors inside the sample vial and secured it with tape (a more reliable method is to use glue or paraffin oil as suggested in the original paper for thermal conductivity). This resistor would be (R h).
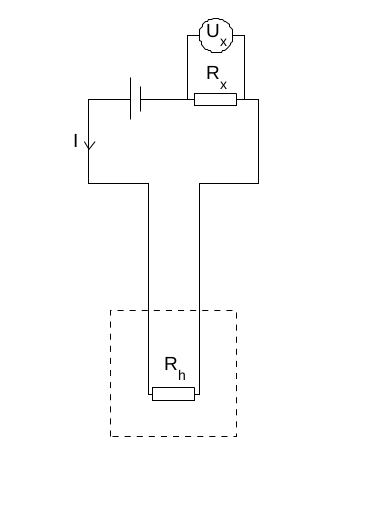
- Afterwards, I connected the external battery with the external resister as well as the resistor inside the sample vial all in a series connection. Then connect the multimeter over the external resistor. Don't switch on the external battery yet!
- Switch on the calorimeter circuit which will start recording data to the SD card and if you are using the serial monitor on Arduino IDE you will see the data in real-time as well.
- Now record the initial baseline reading (U1) as soon as the signal is stable.
- Turn on the external battery now, which will produce heat as it goes through the resistor. Write down the voltage over the external resistor using the multimeter (Ux).
- Leave the external battery ON until a stable signal is reached again, this will be our (U2).
- Now disconnect the external battery.
- Leave the calorimeter data logger recording until we reach a final reading baseline (U3).
- Stop the calorimeter data logger.
- Now the current through the resistor is,
- The thermal power produced in the resistor is,
- The output signal is,
- Finally the calibration coefficient is,
- The Schematic below (credit: Original Paper) shows the calibration configuration.
![Calibration Setup (Credit: Original paper)]()
- I'm using the following items
- Obtaining The Baseline
The original paper suggests doing a baseline calibration even if it was recorded during the calibration coefficient procedure, by doing so we eliminate any baseline drifts caused by a non-perfect balance between reference and sample vials. So we charge both vials with inert sample (in my case, Sand) and we measure a reading over a week or something.
I'll post results once I finish the procedure by next week.
-
Battery Power + PCB for Teensy 2.0
04/01/2015 at 22:02 • 1 commentI'm busy at college so didn't have the chance to update the log much further.
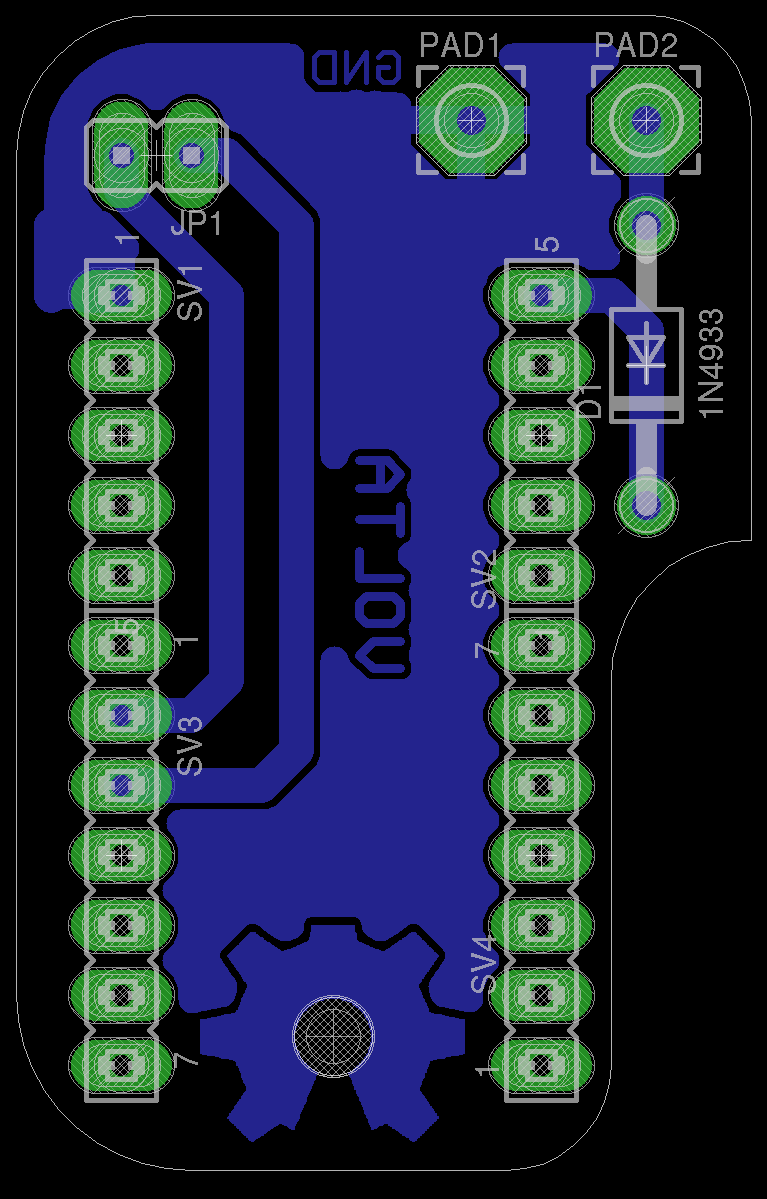
I created a PCB to plug-in the Teensy 2.0 board and handle external power using a single cell 3.7V LiPo 4000mAh, running the Teensy at 3V instead of 5V will consume less power and give the battery roughly 6-8 days of continuous data logging to the SD card. During the experiment we experienced periodic loss of power so that's why we are adding external power source.
Also, I believe the battery powered device will reduce lots of the noise from the AC adapters.
![]()
I'll be adding more photos after I finish etching the board and soldering the components.
-
Initial Prototype
03/17/2015 at 10:25 • 0 commentsThe prototype is complete now, I calibrated my sensors with water in the reference vial so this calibration coefficient will work with solution but I will have to re-calibrate it for cement.
The calibration for cement will require filling the reference (inert) vial with Sand or NaCl. Because the specific heat capacity for water is 4182 J/kg while Concrete is 880 J/kg which matches that of Salt and NaCl of 880 J/kg. Sand will be accessible in our Lab, and its specific heat capacity is 830 J/kg.
A PhD student at my faculty is using the device now to perform the heat of hydration of cement experiment over an interval of 7 days. The data is being logged to a micro SD card into a CSV file every 5 seconds (which can be opened via libreOffice Calc or any spreadsheet program).
I'll be adding more specific details about the build and the calibration process.
Isothermal Calorimeter
This project is a Heat Conduction Isothermal Calorimeter based on the designs of Dr Lars Wadsö, Sweden.
 Ahmed Hefnawi (Volta)