-
Breathing gas analysis and respiration rate
09/26/2015 at 20:13 • 0 commentsJust two examples: If your breath has an acetone-like odor, it's a warning sign for diabetes and if your breath has an ammonia-like odor, it's a warning sign for chronic kidney failure.
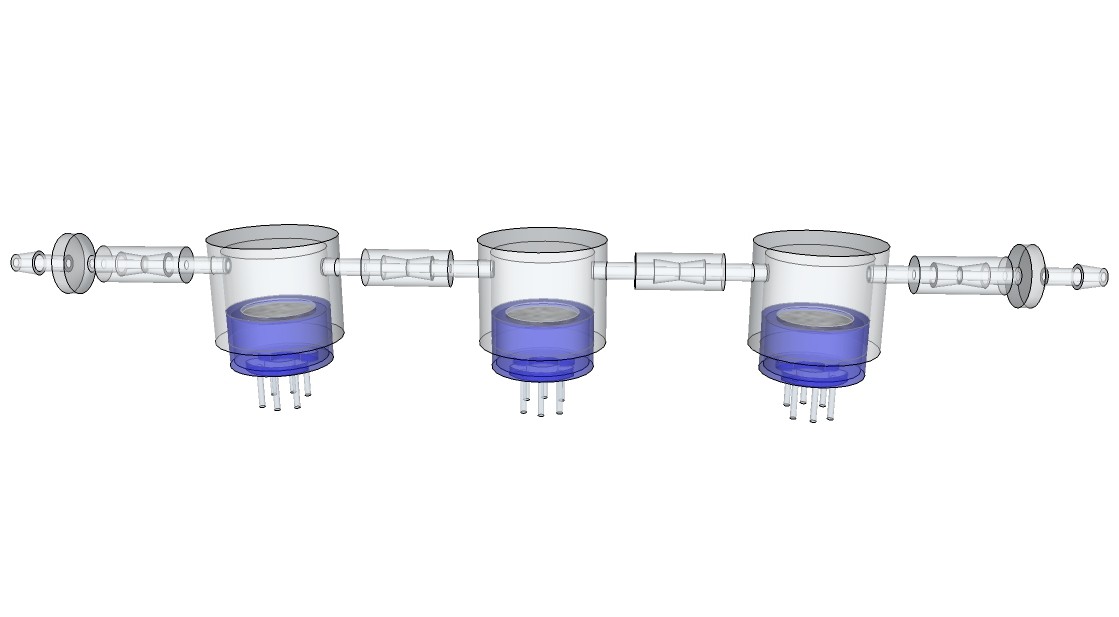
Target gases of the FIGARO TGS 2620 sensor are amongst other substances: ammonia, propionic acid, acetic acid, acetone, benzene and ethanol, which makes this gas sensor with a heater current of only 42 mA and a standard TO-5 package suitable for simple breathing gas analysis.
Fig. 1
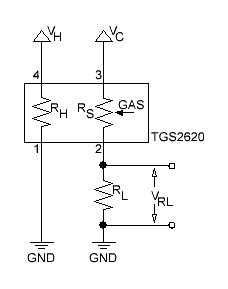
The basic measuring circuit for the TGS 2620 is shown below:
Fig. 2
The formula to determine RS is given by:
The value of RL should be determined to make the output voltage half of VC at the most critical value in the sensor application, because then the output voltage of the voltage divider is most sensitive to the gas concentration.
The relationship between sensor resistance and the concentration of deoxidizing gas can be expressed by the following equation over a certain range of gas concentration:
where
RS = Sensor element resistance
A = Constant for this particular gar sensor
C = Gas concentration
α = Slope of the RS curve on a log/log plot.
The equation for the minimum value of the load resistance RL to limit power to the sensor element resistance RS is given by:
VC = 5 V and PMAX = 15 mW = 0.015 V·A, thus
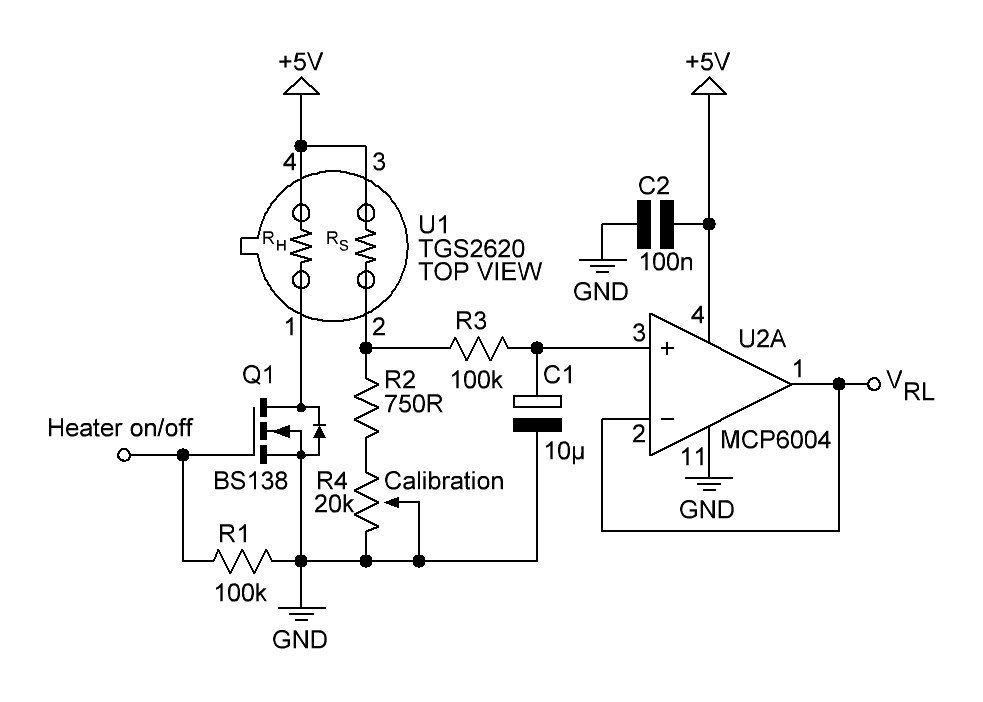
A little bit more advanced gas sensing circuit is shown in next figure:
Fig. 3
Q1 turns the heating element of the gas sensor on or off. R2 and R4 acting as a variable load resistor. The R3/C1 circuit provides a low-pas filter with a cut-off frequency of
The op-amp U2A is connected to an unity buffer amplifier circuit.
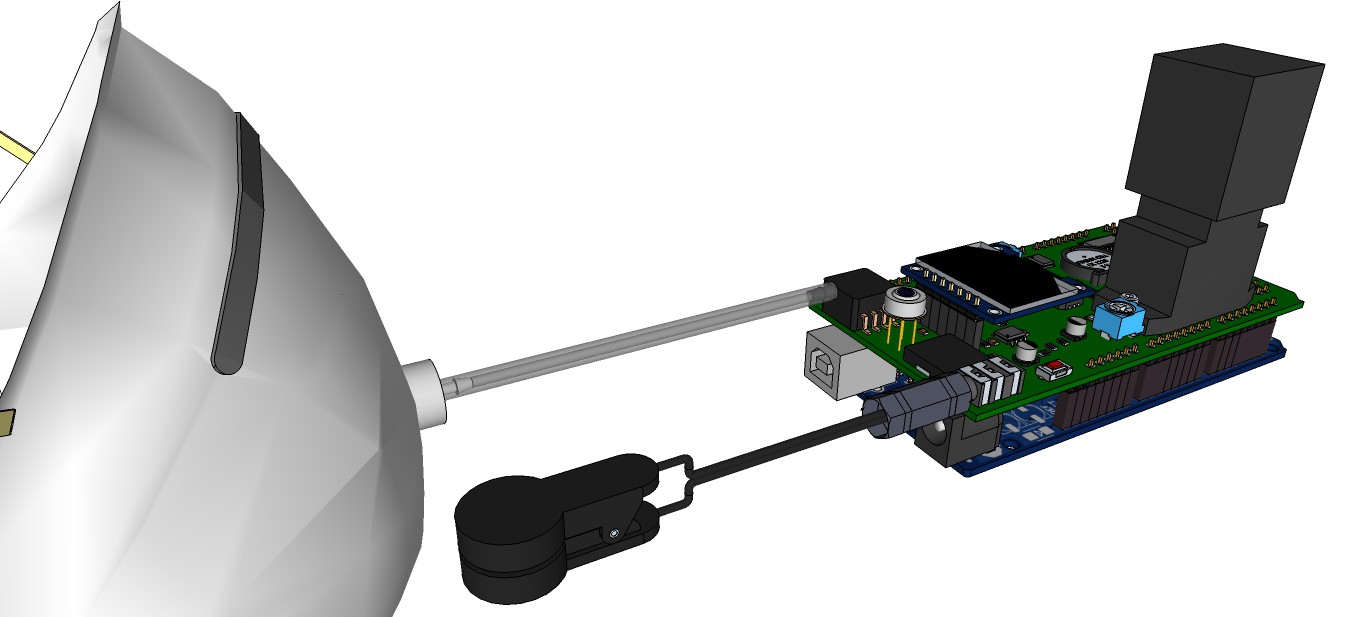
Breathing gas analysis and respiration rate system overview:
Fig. 4
If the patient breathes out, breathing gas enters the system and must overcome the small resistance of the check valve. The resulting pressure increase will be recognized by the pressure sensor. The breathing gas flows then to the gas sensor, where it will be analyzed. When the patient breathes in, the check valve closes and no false air intake can take place.
Pressure sensor will be a MPXV5004GC6U from Freescale with a pressure range of 0-3.92 kPa (0-400 mm H₂O).
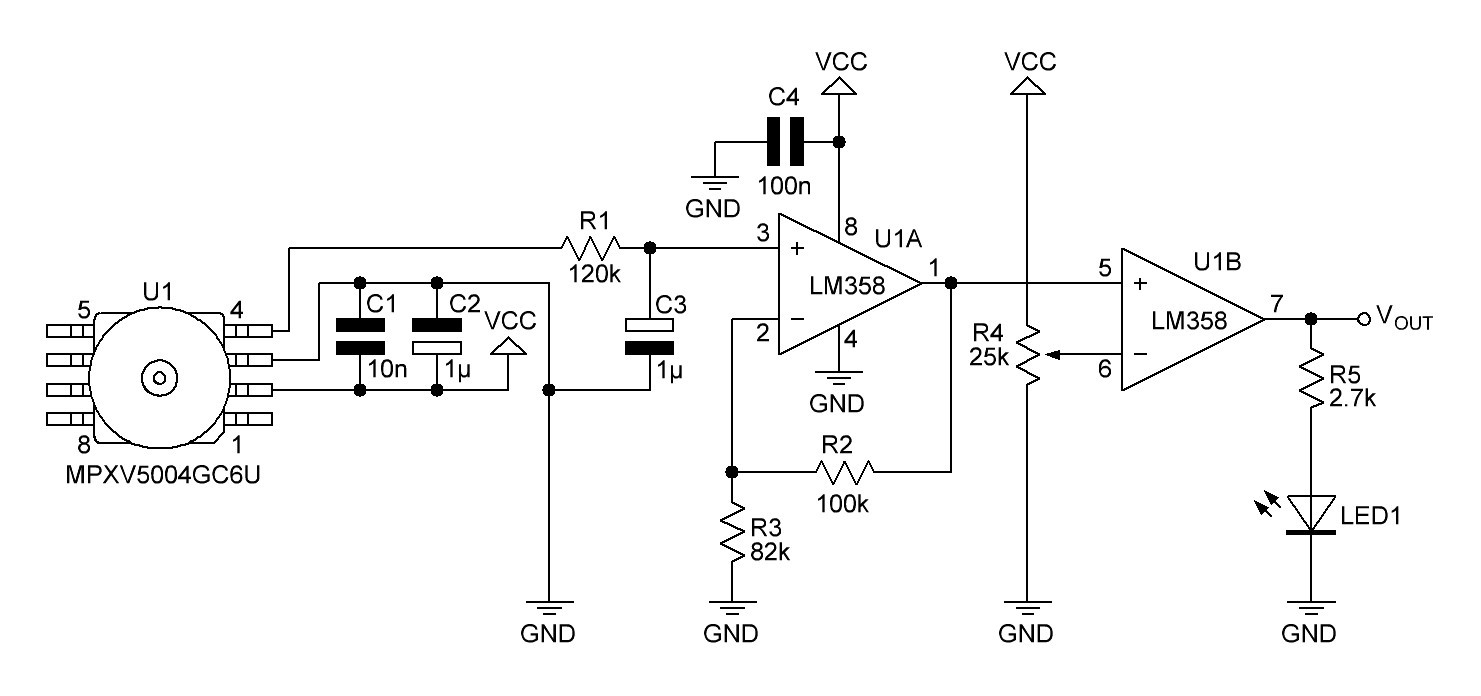
The gauge pressure is quite small when breathing out, so the output voltage of the pressure sensor must be amplified. This is done by a non-inverting amplifier:
Fig. 5
C5 and C6 are recommended decoupling capacitors. R9/C7 are connected to a low-pass RC filter with a cut-off frequency of
The output voltage of the non-inverting amplifier (and input voltage VIN of the non inverted Schmitt trigger) is given by
Assuming a single power supply of the op-amp and a rail-to-rail output, high threshold voltage VH, low threshold voltage VL and hysteresis H are computed as follows:
After experimenting with several setups I decided to use a non inverting comparator and a low pass filter with a cut-off frequency of 1.6 Hz instead of the Schmitt trigger.
References:
Technical Information on Usage of TGS Sensors for Toxic and Explosive Gas Leak Detectors
Noise Considerations for Integrated Pressure SensorsNon-Inverting Schmitt Trigger Calculator
LM358 datasheet -
Pulse oximeter
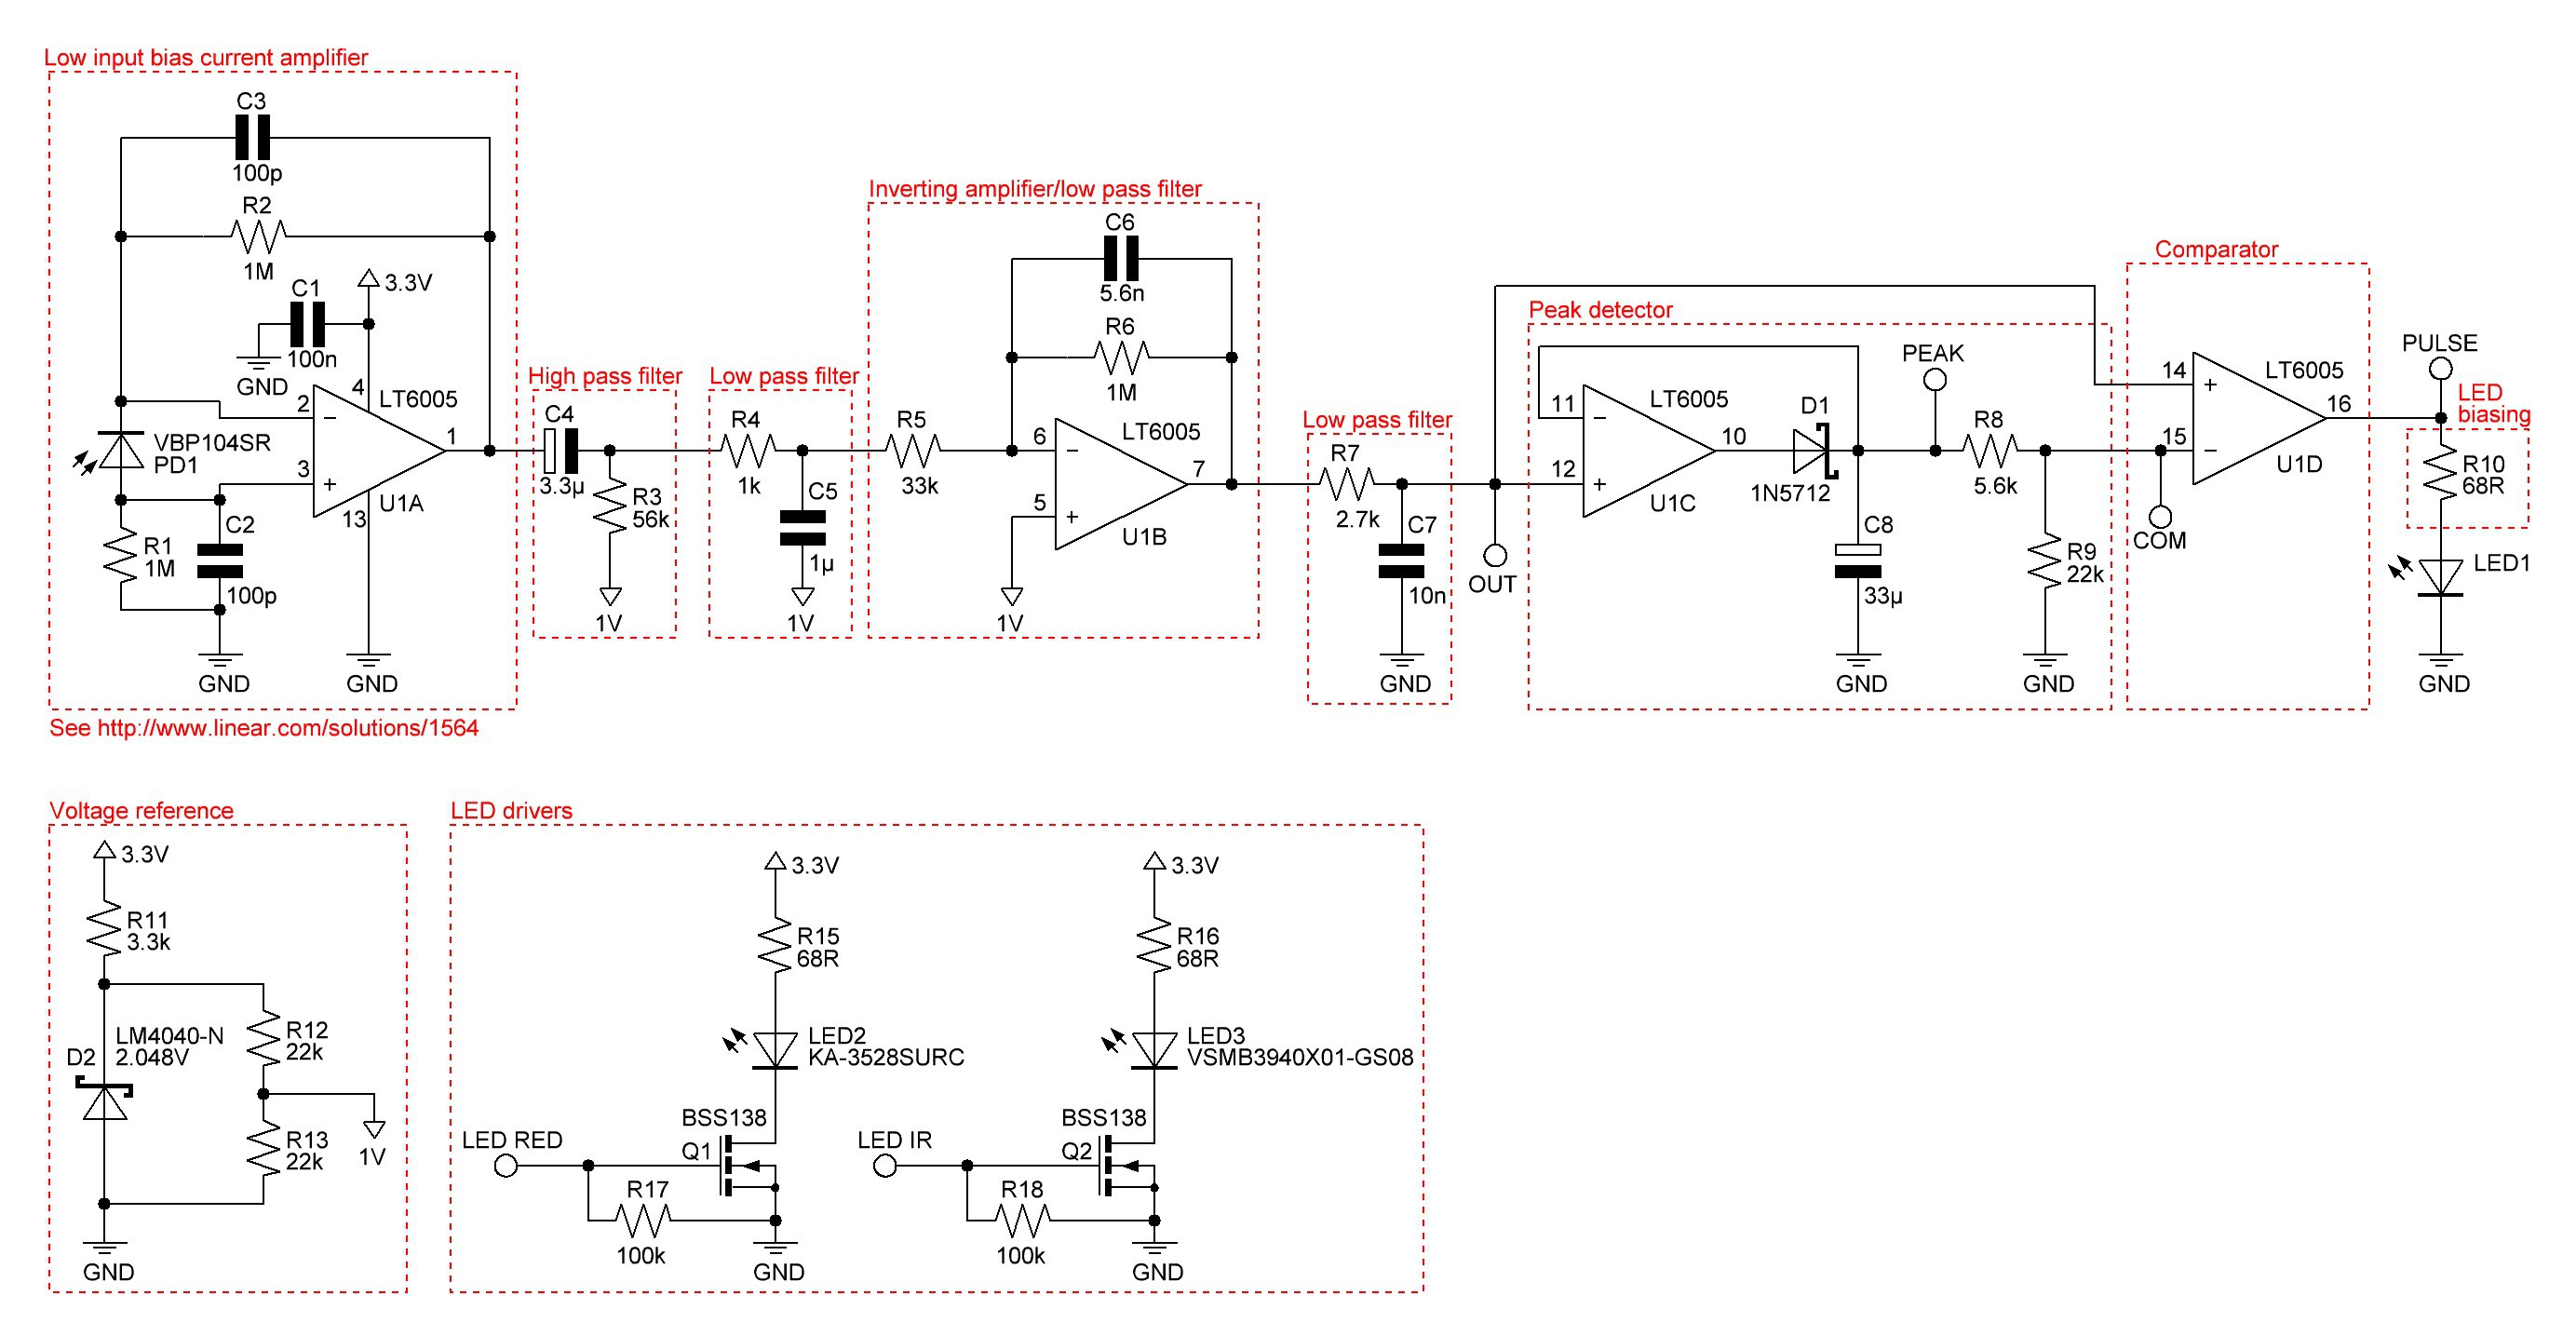
09/15/2015 at 17:17 • 1 commentThe current heart beat monitor works quite well, but a pulse oximeter would be better to get the pulse rate and the saturation of peripheral oxygen SpO2.
After a lot of research I found this promising reflective pulse oximeter design. The circuit outputs amongst other things directly the peak IR and red light voltages. The simple equation
is used, and S represents the value of StO2 in a calibration table.
I will use a commercially available pulse oximeter to approximate a function of the saturation of peripheral oxygen depending on S.
Redrawn and slightly modified schematic:
Next step will be to build a prototype and see how it works.
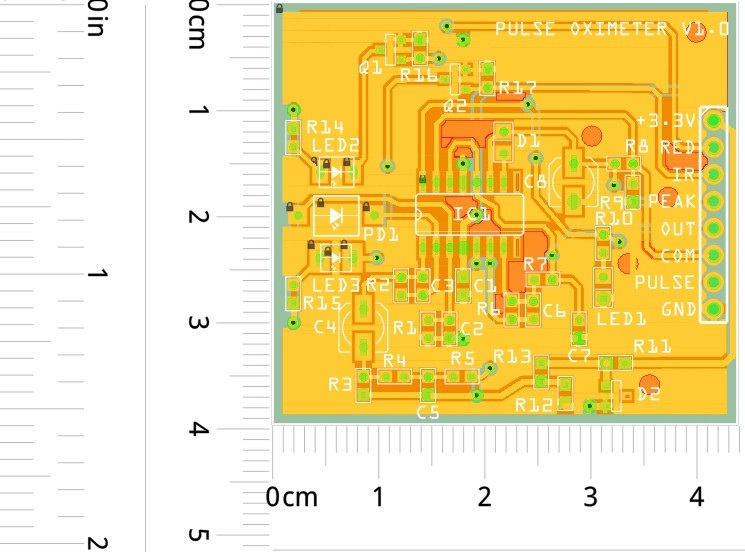
PCB layout of the prototype:
![]()
-
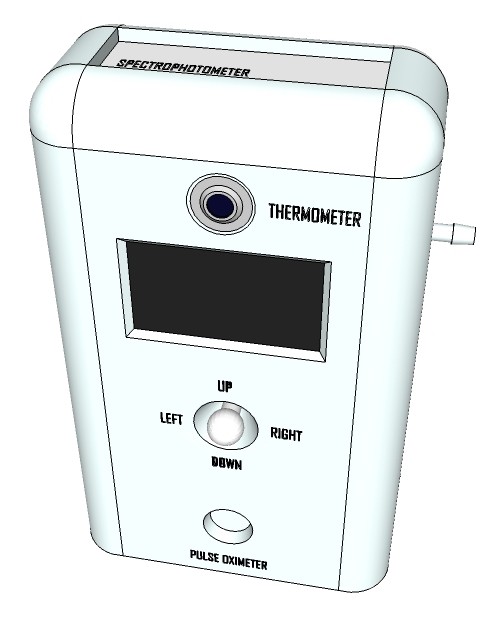
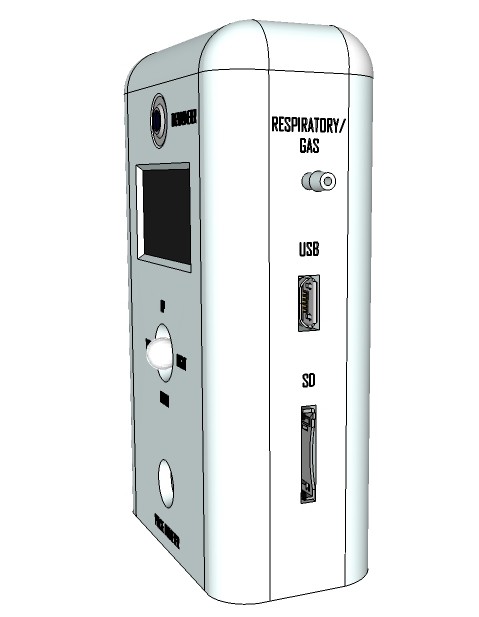
Artist’s rendition of the 'productized' design
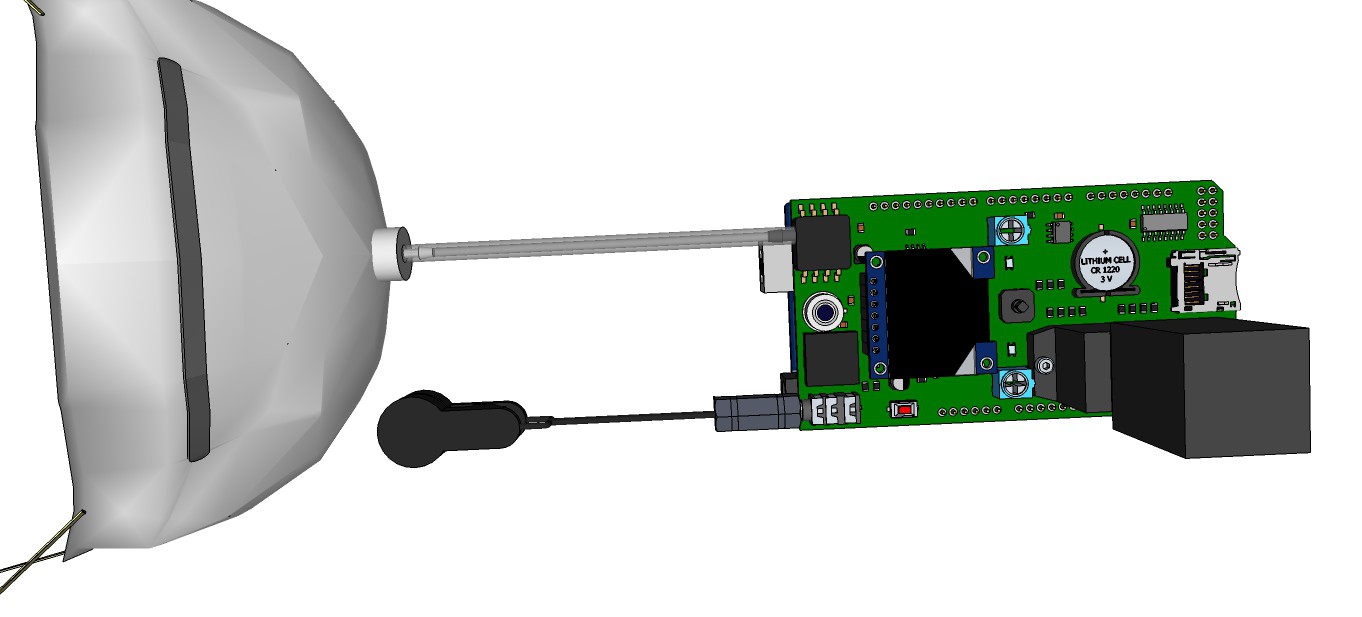
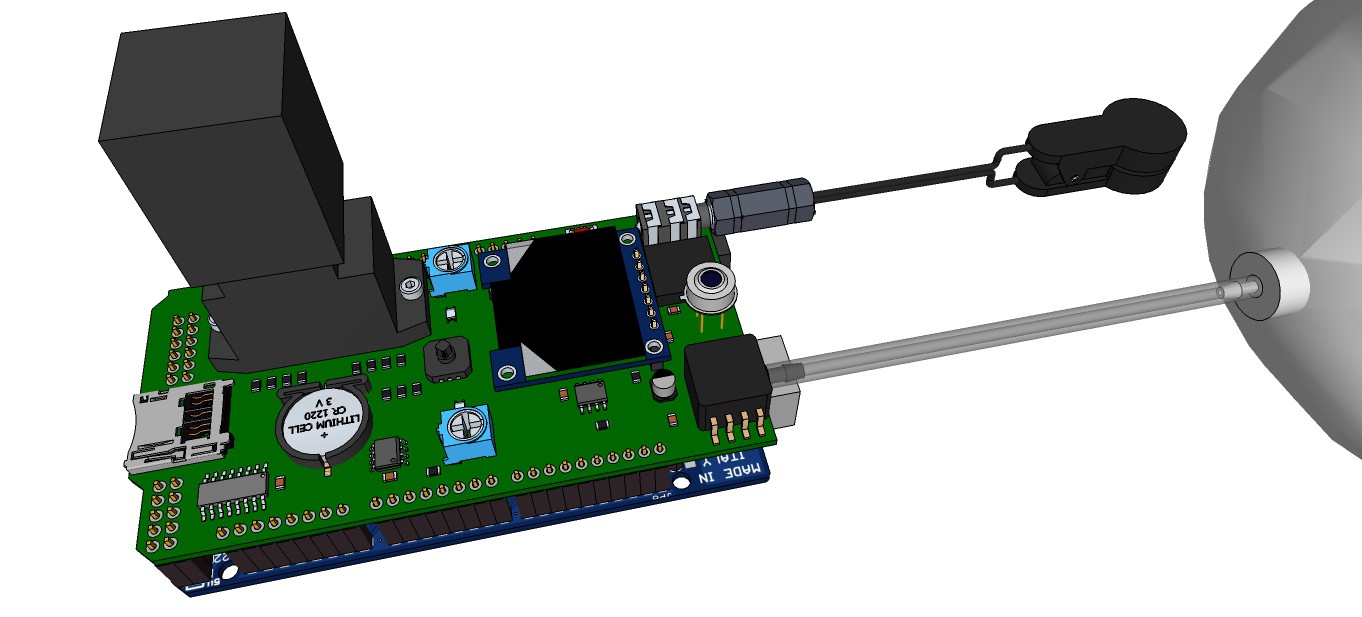
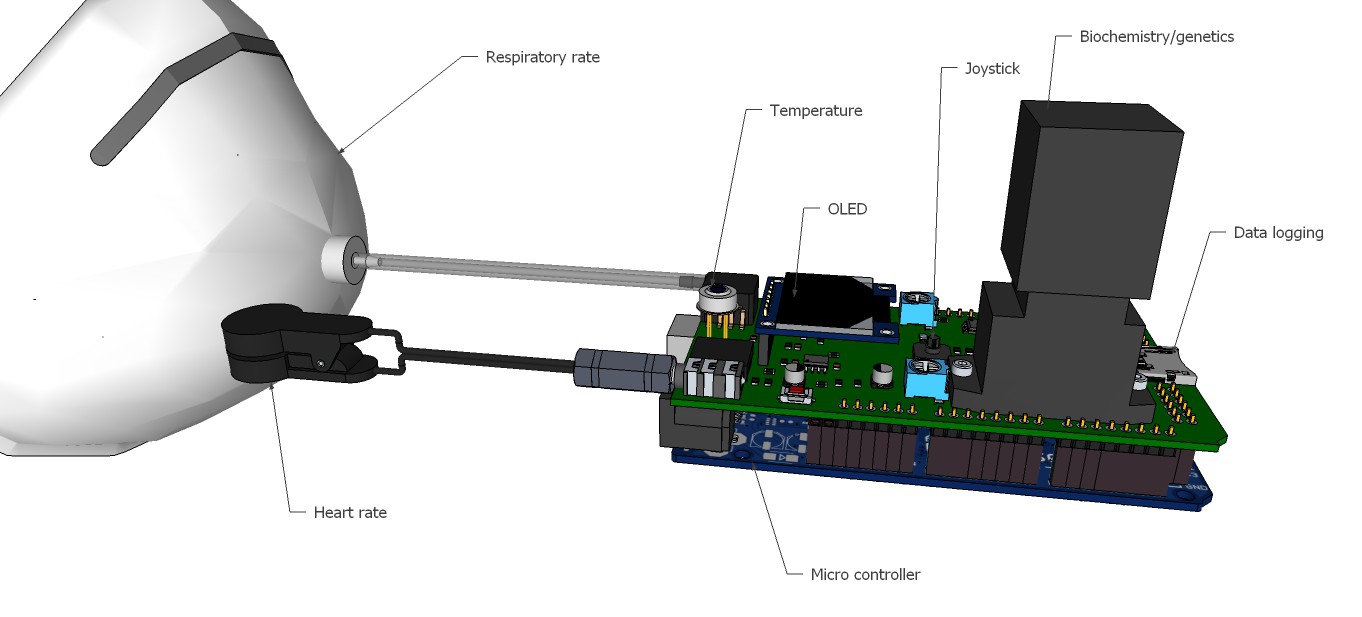
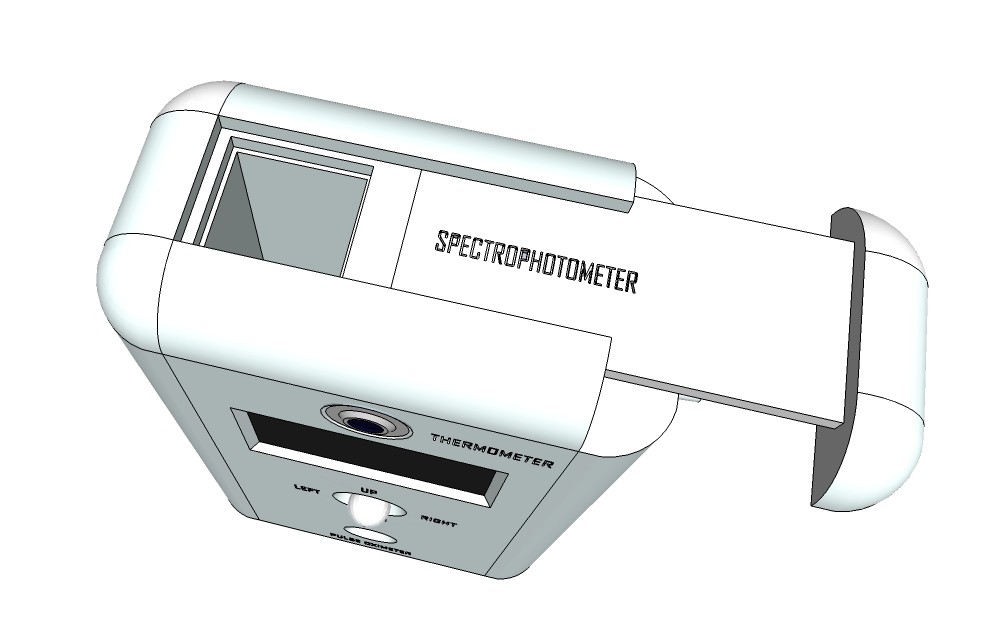
09/13/2015 at 13:00 • 0 commentsRendering research apparatus (current stage):
![]()
![]()
![]()
![]()
Rendering finalized product:
![]()
![]()
![]()
-
More analytical reactions for spectrophotometry
09/01/2015 at 17:54 • 0 commentsI am quite busy to develop other analytical reactions for spectrophotometry these days. It is not always easy to get all the required chemicals as we have many restrictions in Germany regarding chemicals.
First, I want to develop a pH test using a double indicator system comprising methyl red and bromothymol blue to cover the complete pH range. I need to do a couple of experiments to determinate the optimal mixture of both solutions. Methyl red is also used to detect E. coli bacterium.
Second, I want to develop a nitrite test. Some of the gram negative bacteria species that most commonly cause urinary tract infections have enzymes that reduce the nitrate present in urine to nitrite. I will probably use Griess Reagent for nitrite determination. 1-Naphthylamine will be replaced by N-(1-naphthyl)ethylenediamine dihydrochloride because 1-Naphthylamine is carcinogenic. The required phosphoric acid is on the other hand not a problem to get as it is used in Germany as a rust remover.
To get pure Potassium nitrite or Sodium nitrite as a private person is a problem in Germany because both are toxic. I think I need to extract it from curing salt.
Preparing Griess Reagent
To get 50 ml 5% phosphoric acid from commercially available 85% phosphoric acid, we compute:
Means we need 5 parts 85% phosphoric acid and 80 parts deionized water.
To obtain 50 ml of 5% phosphoric acid we therefor need:
More information will follow as soon as I make progress. -
My friend Lutz
08/17/2015 at 17:08 • 1 commentI had a friend named Lutz. For some times we discussed the concept of a medical tricorder. He was sure, that medical tricorders will save lives in the future like defibrillators do now.
Lutz passed away exactly 3 months ago in San Fransisco, probably on a heart attack at night in his hotel room. I was too late. Too late...
RIP my friend, I'll never forget you.
-
Medical tricorder Rev. 3
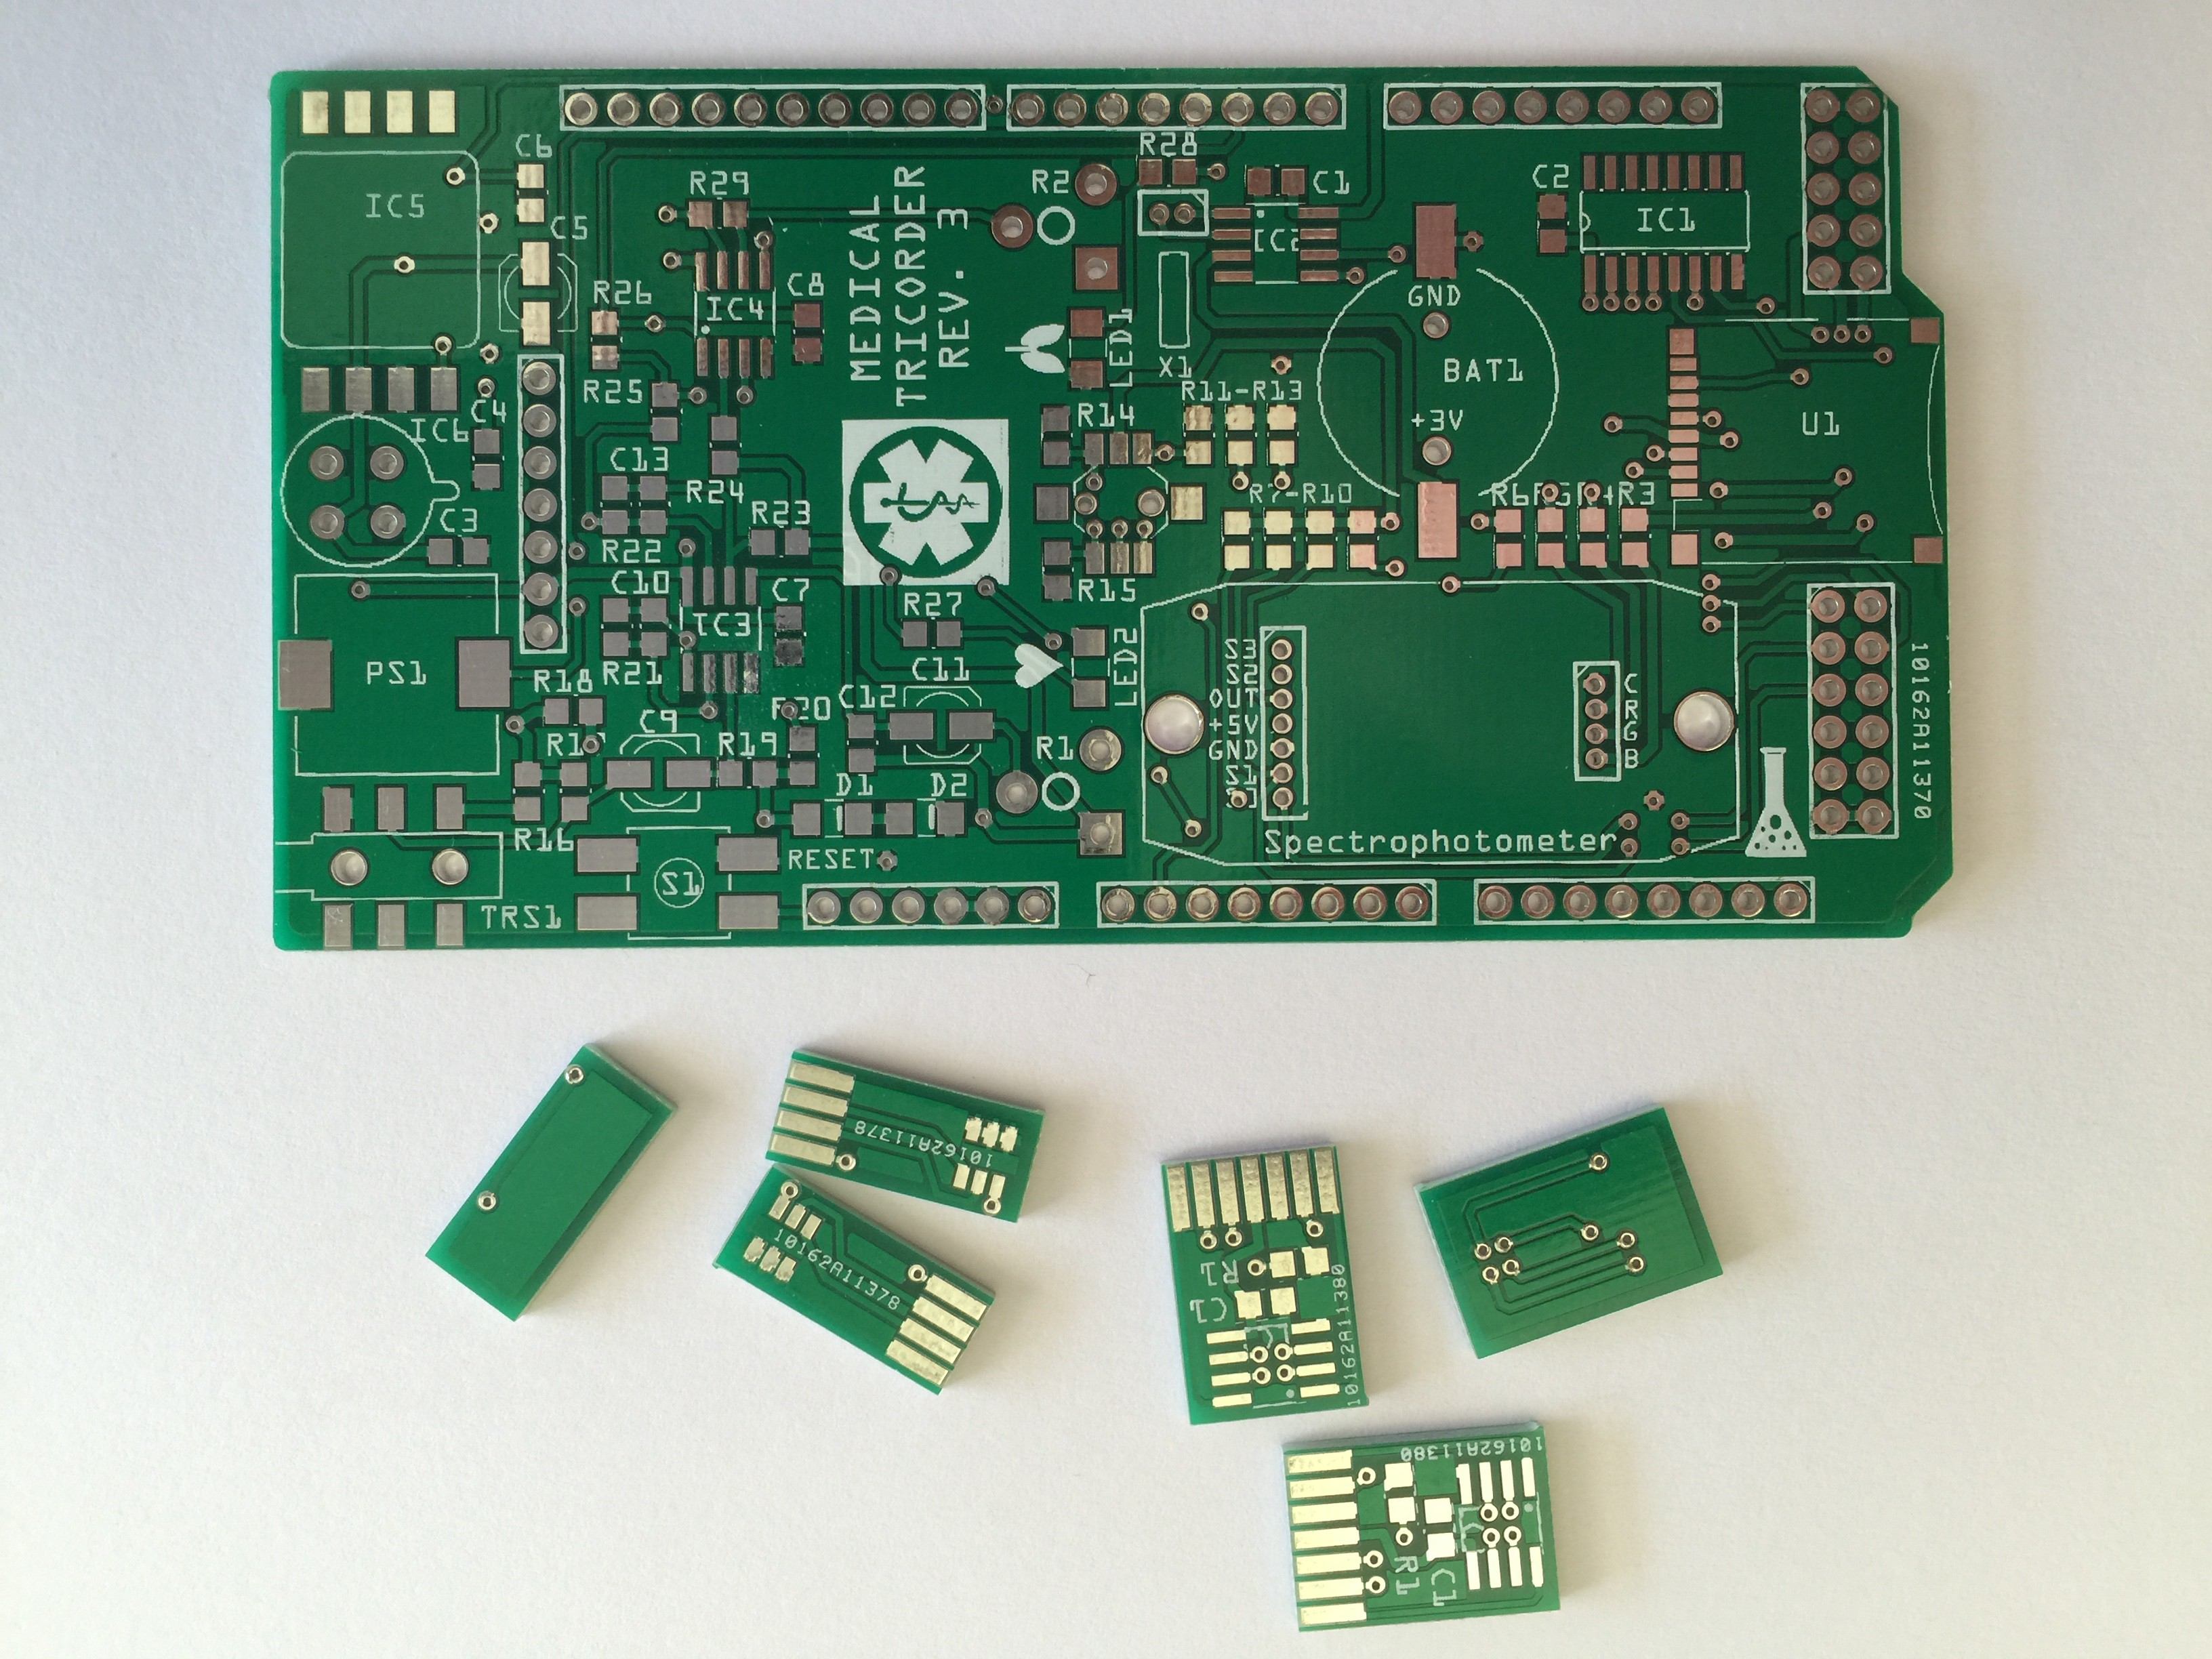
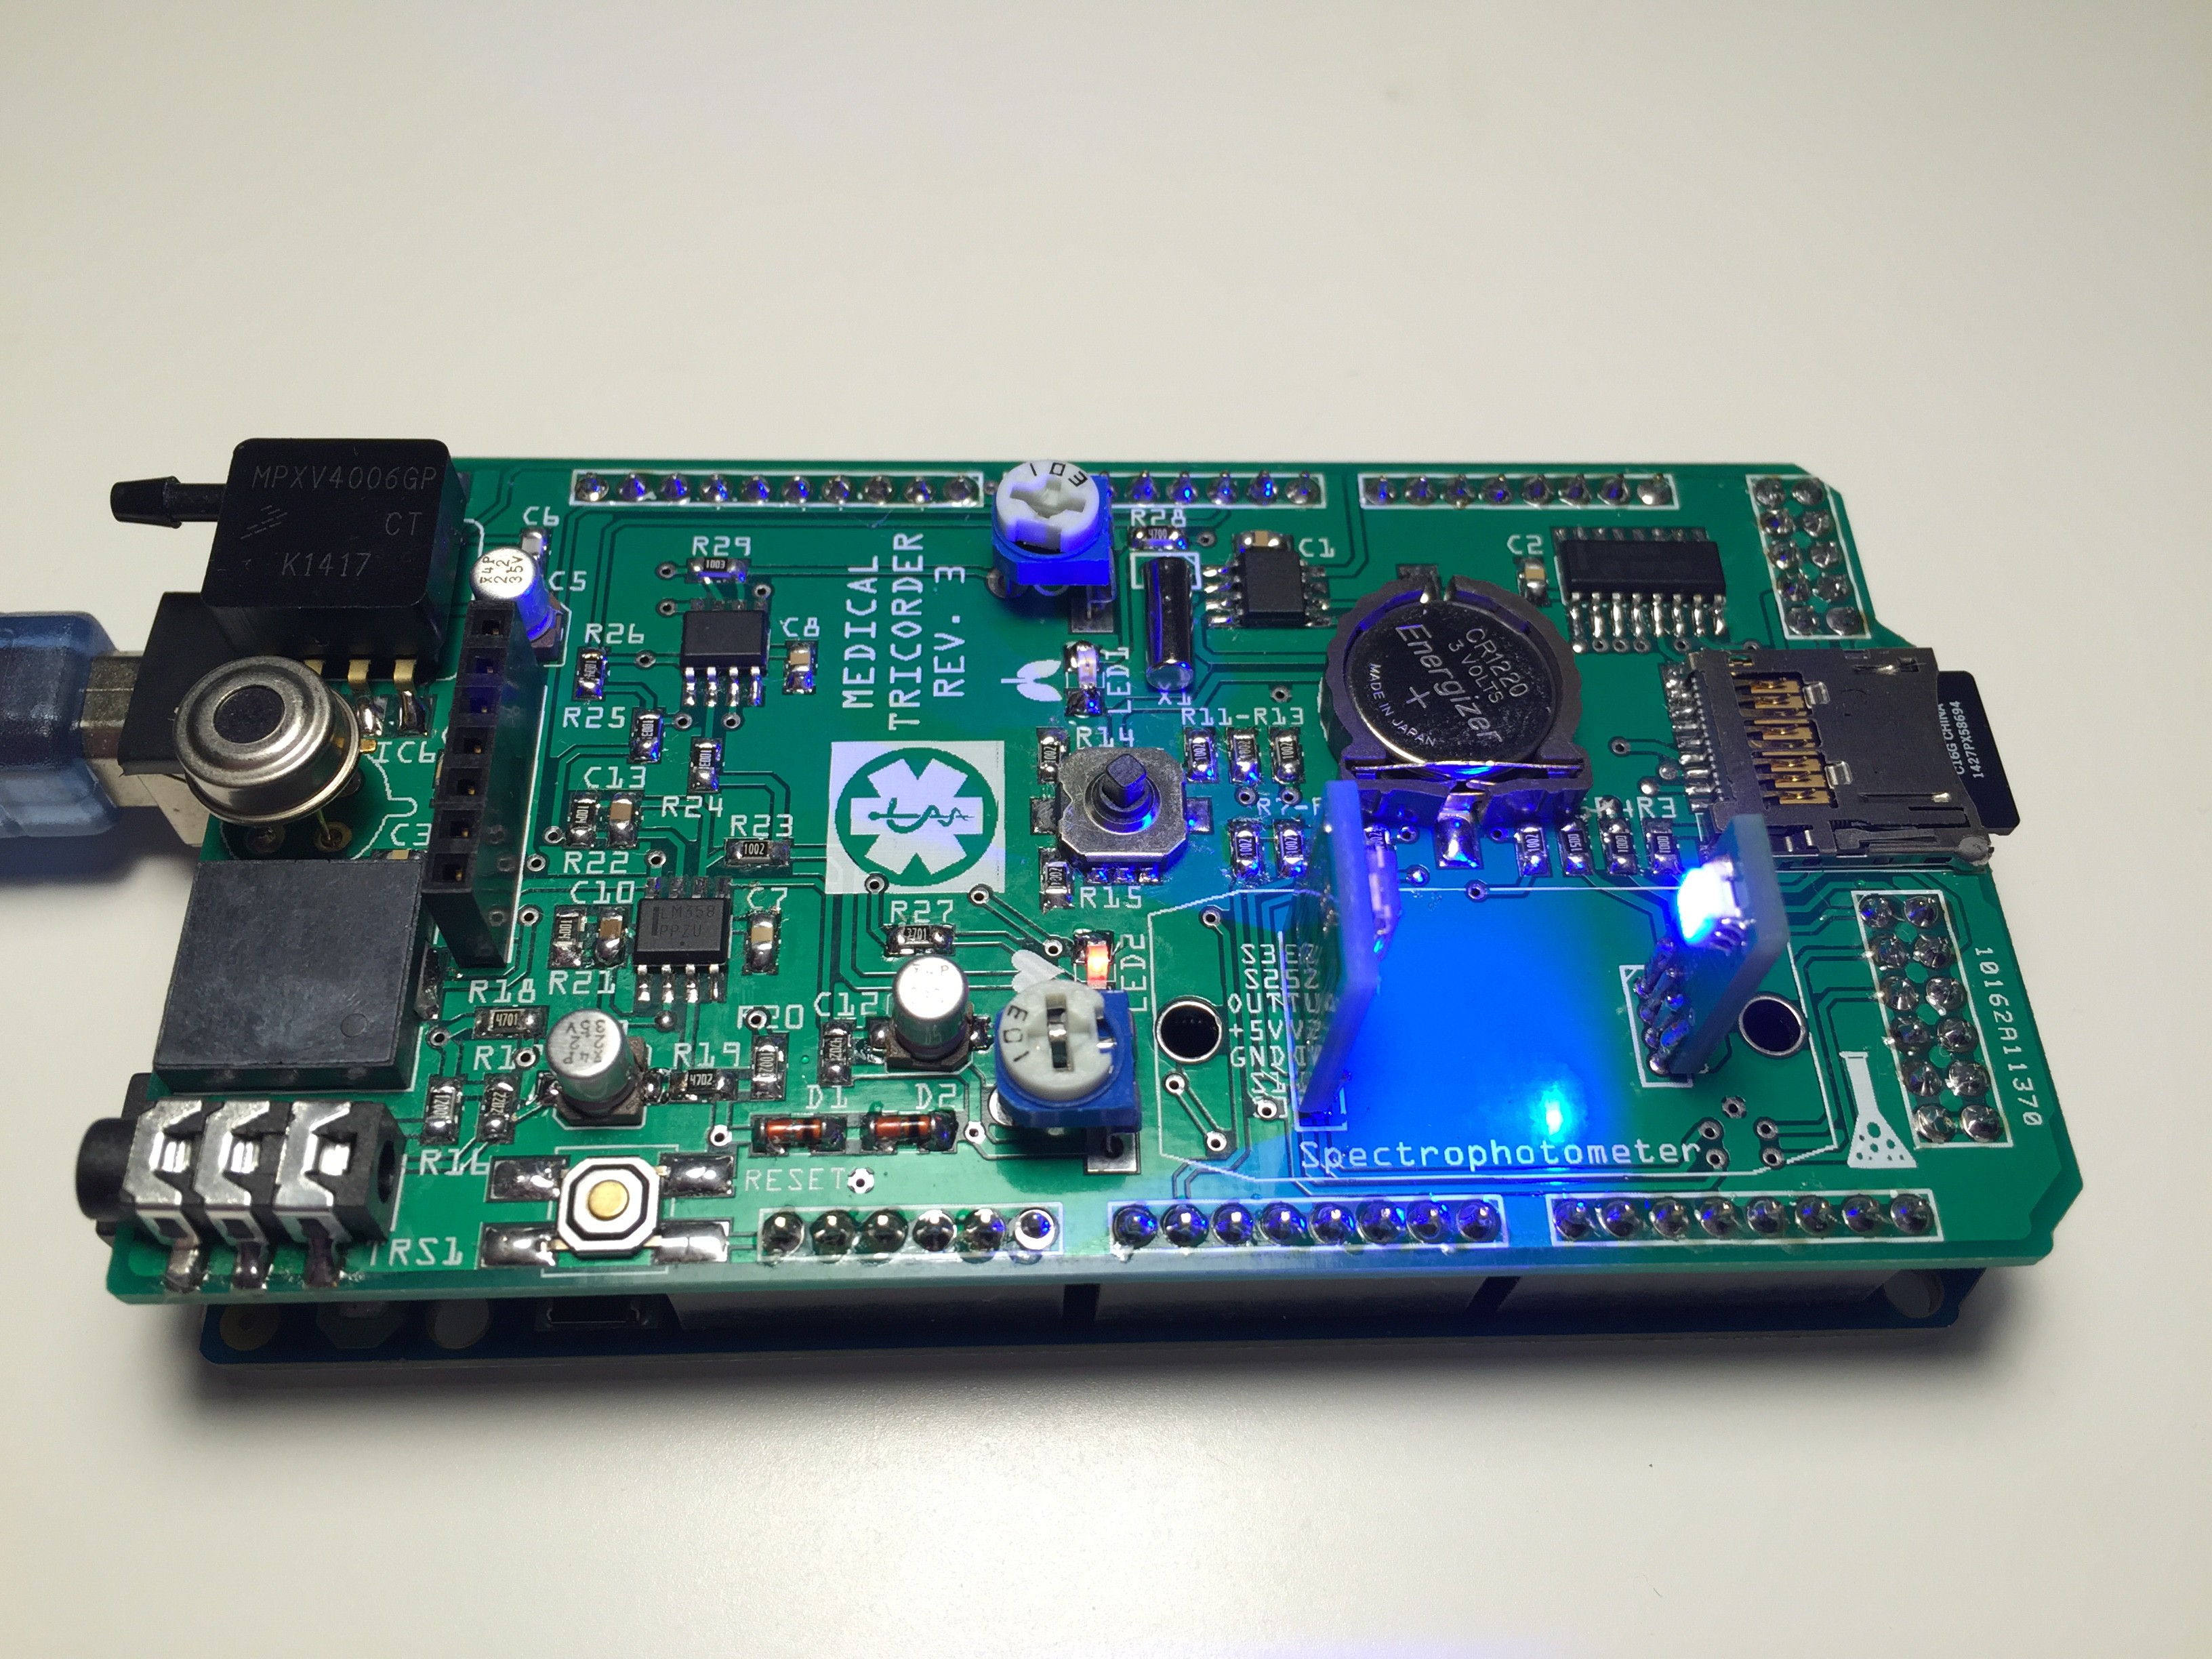
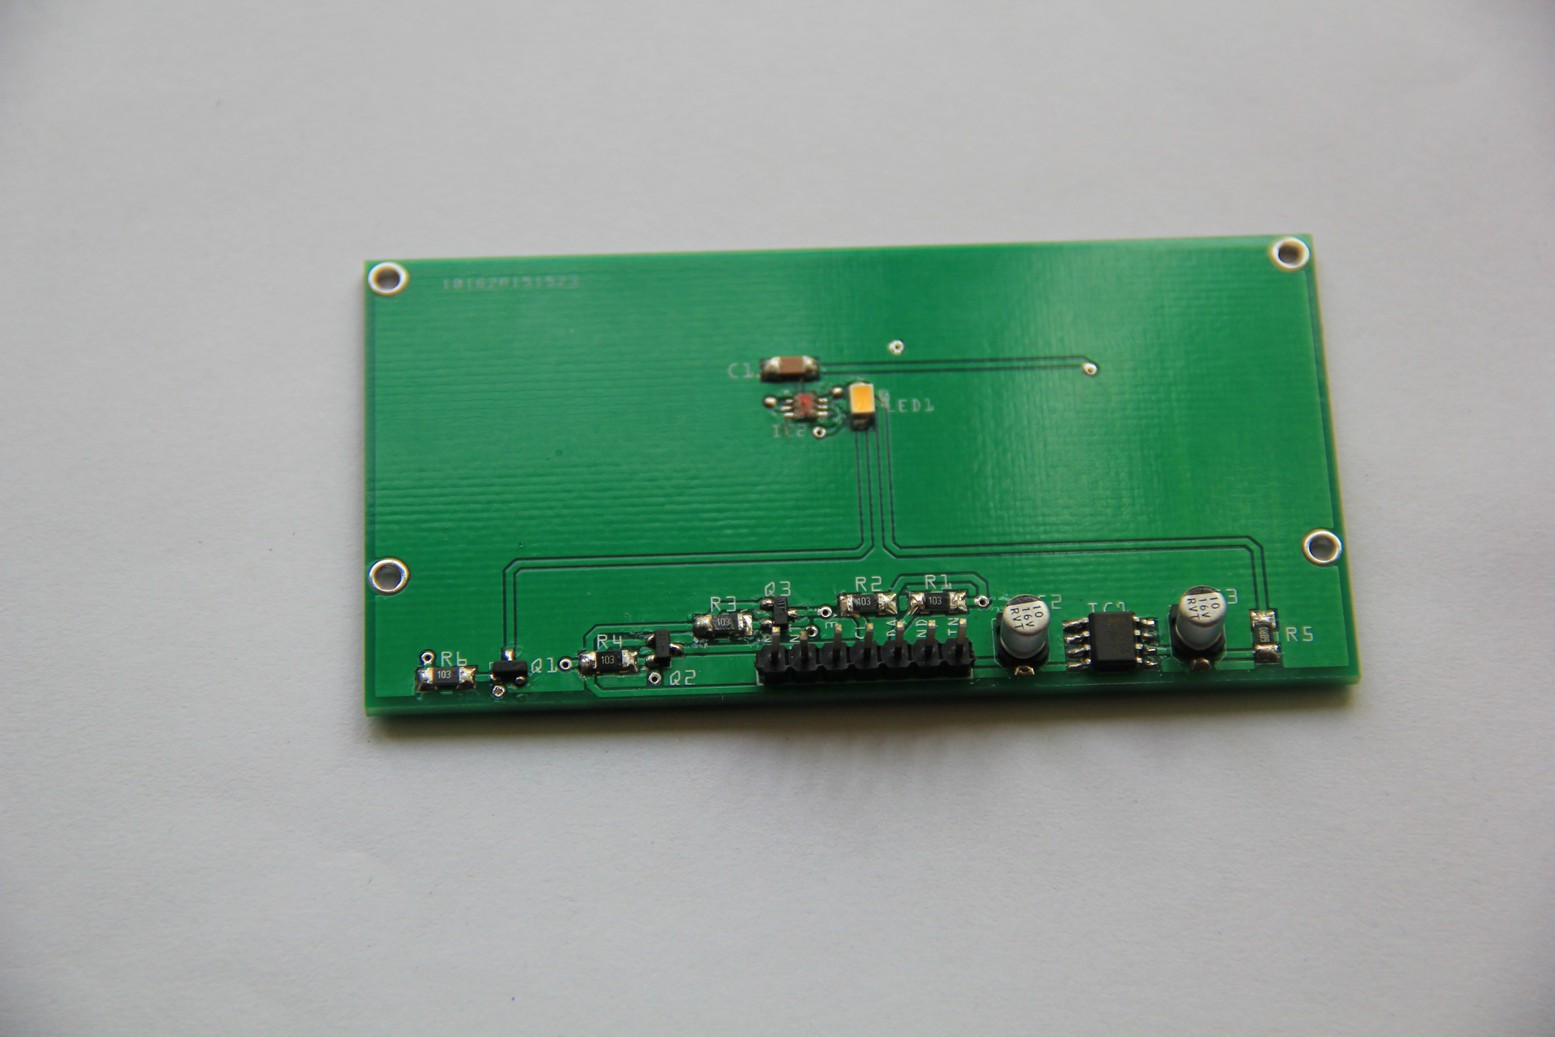
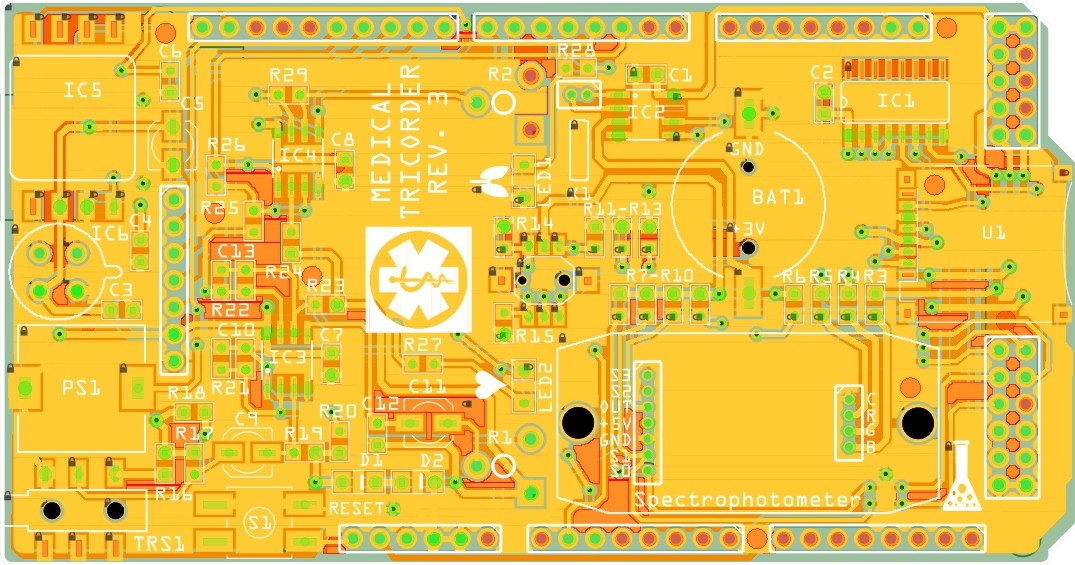
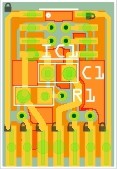
07/22/2015 at 18:16 • 0 commentsI have started working on the third revision of the medical tricorder. So far I have routed the new shield and the two PCB's which will carry the color sensor and RGB LED for the spectrophotometer.
![]()
![]()
![]()
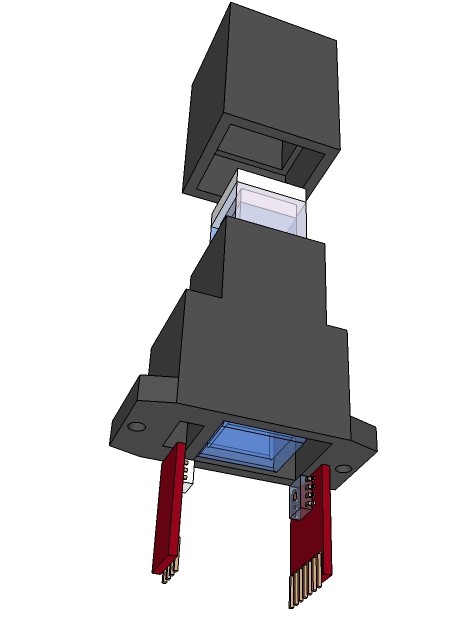
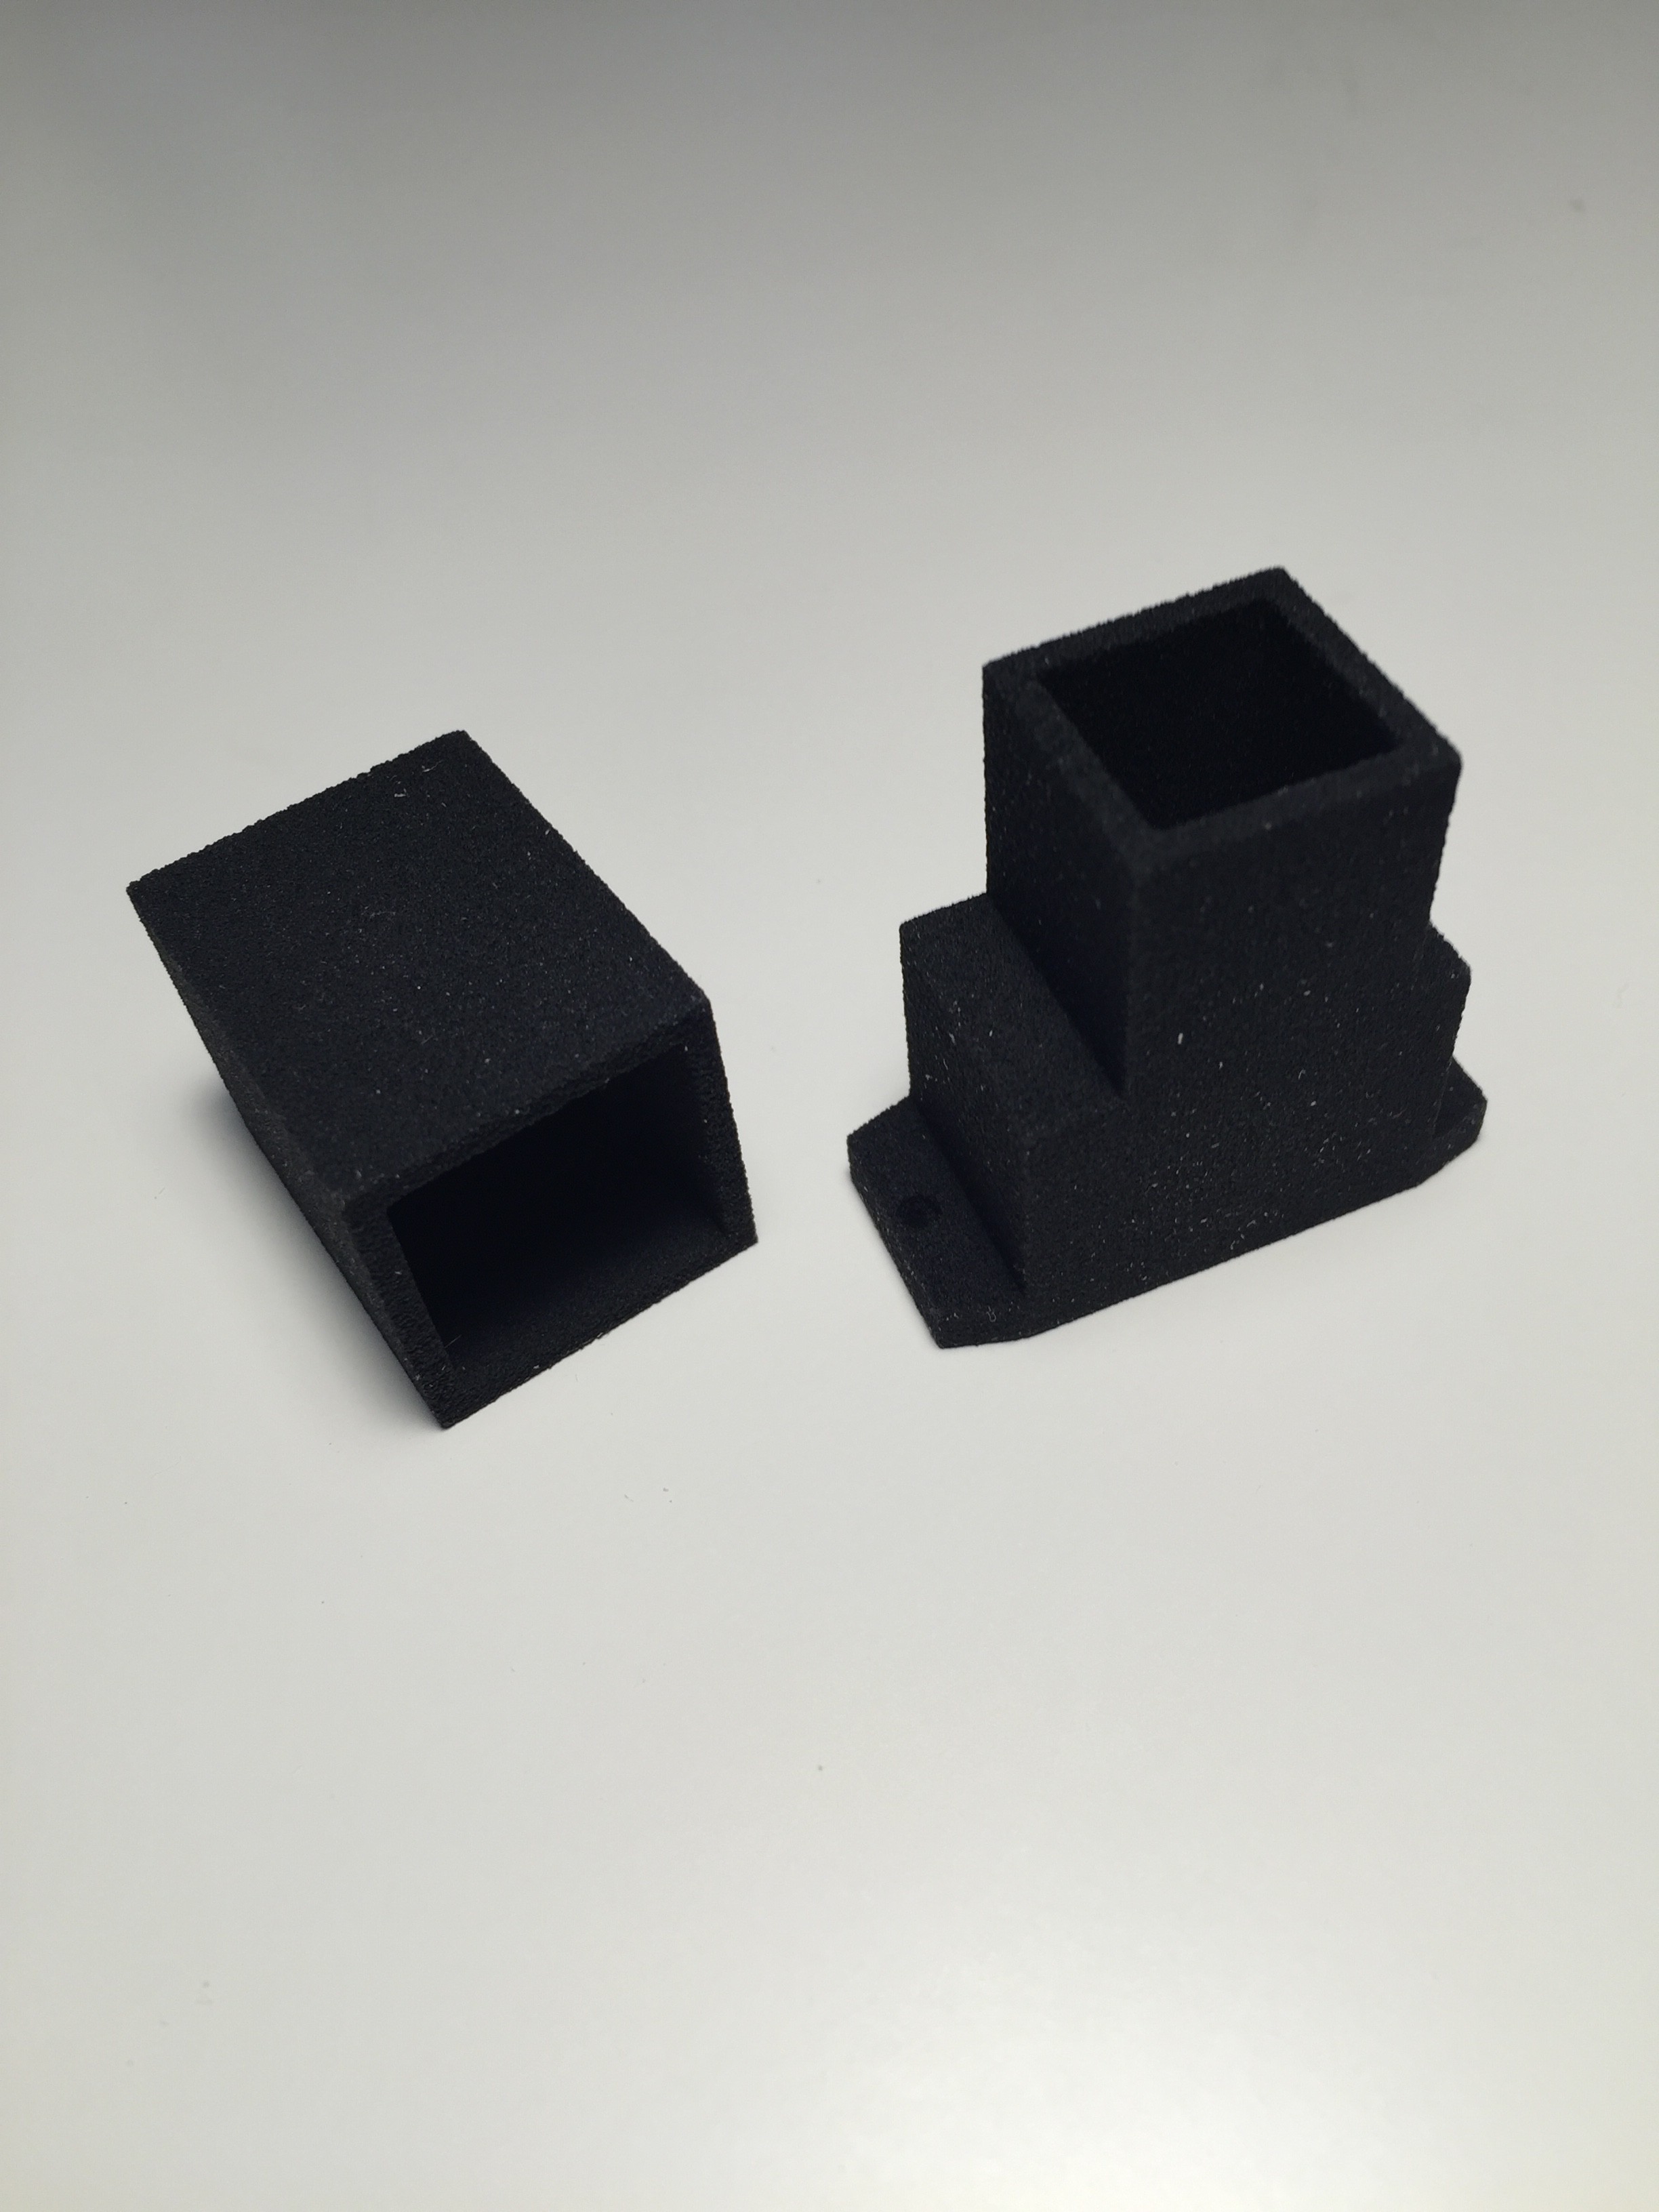
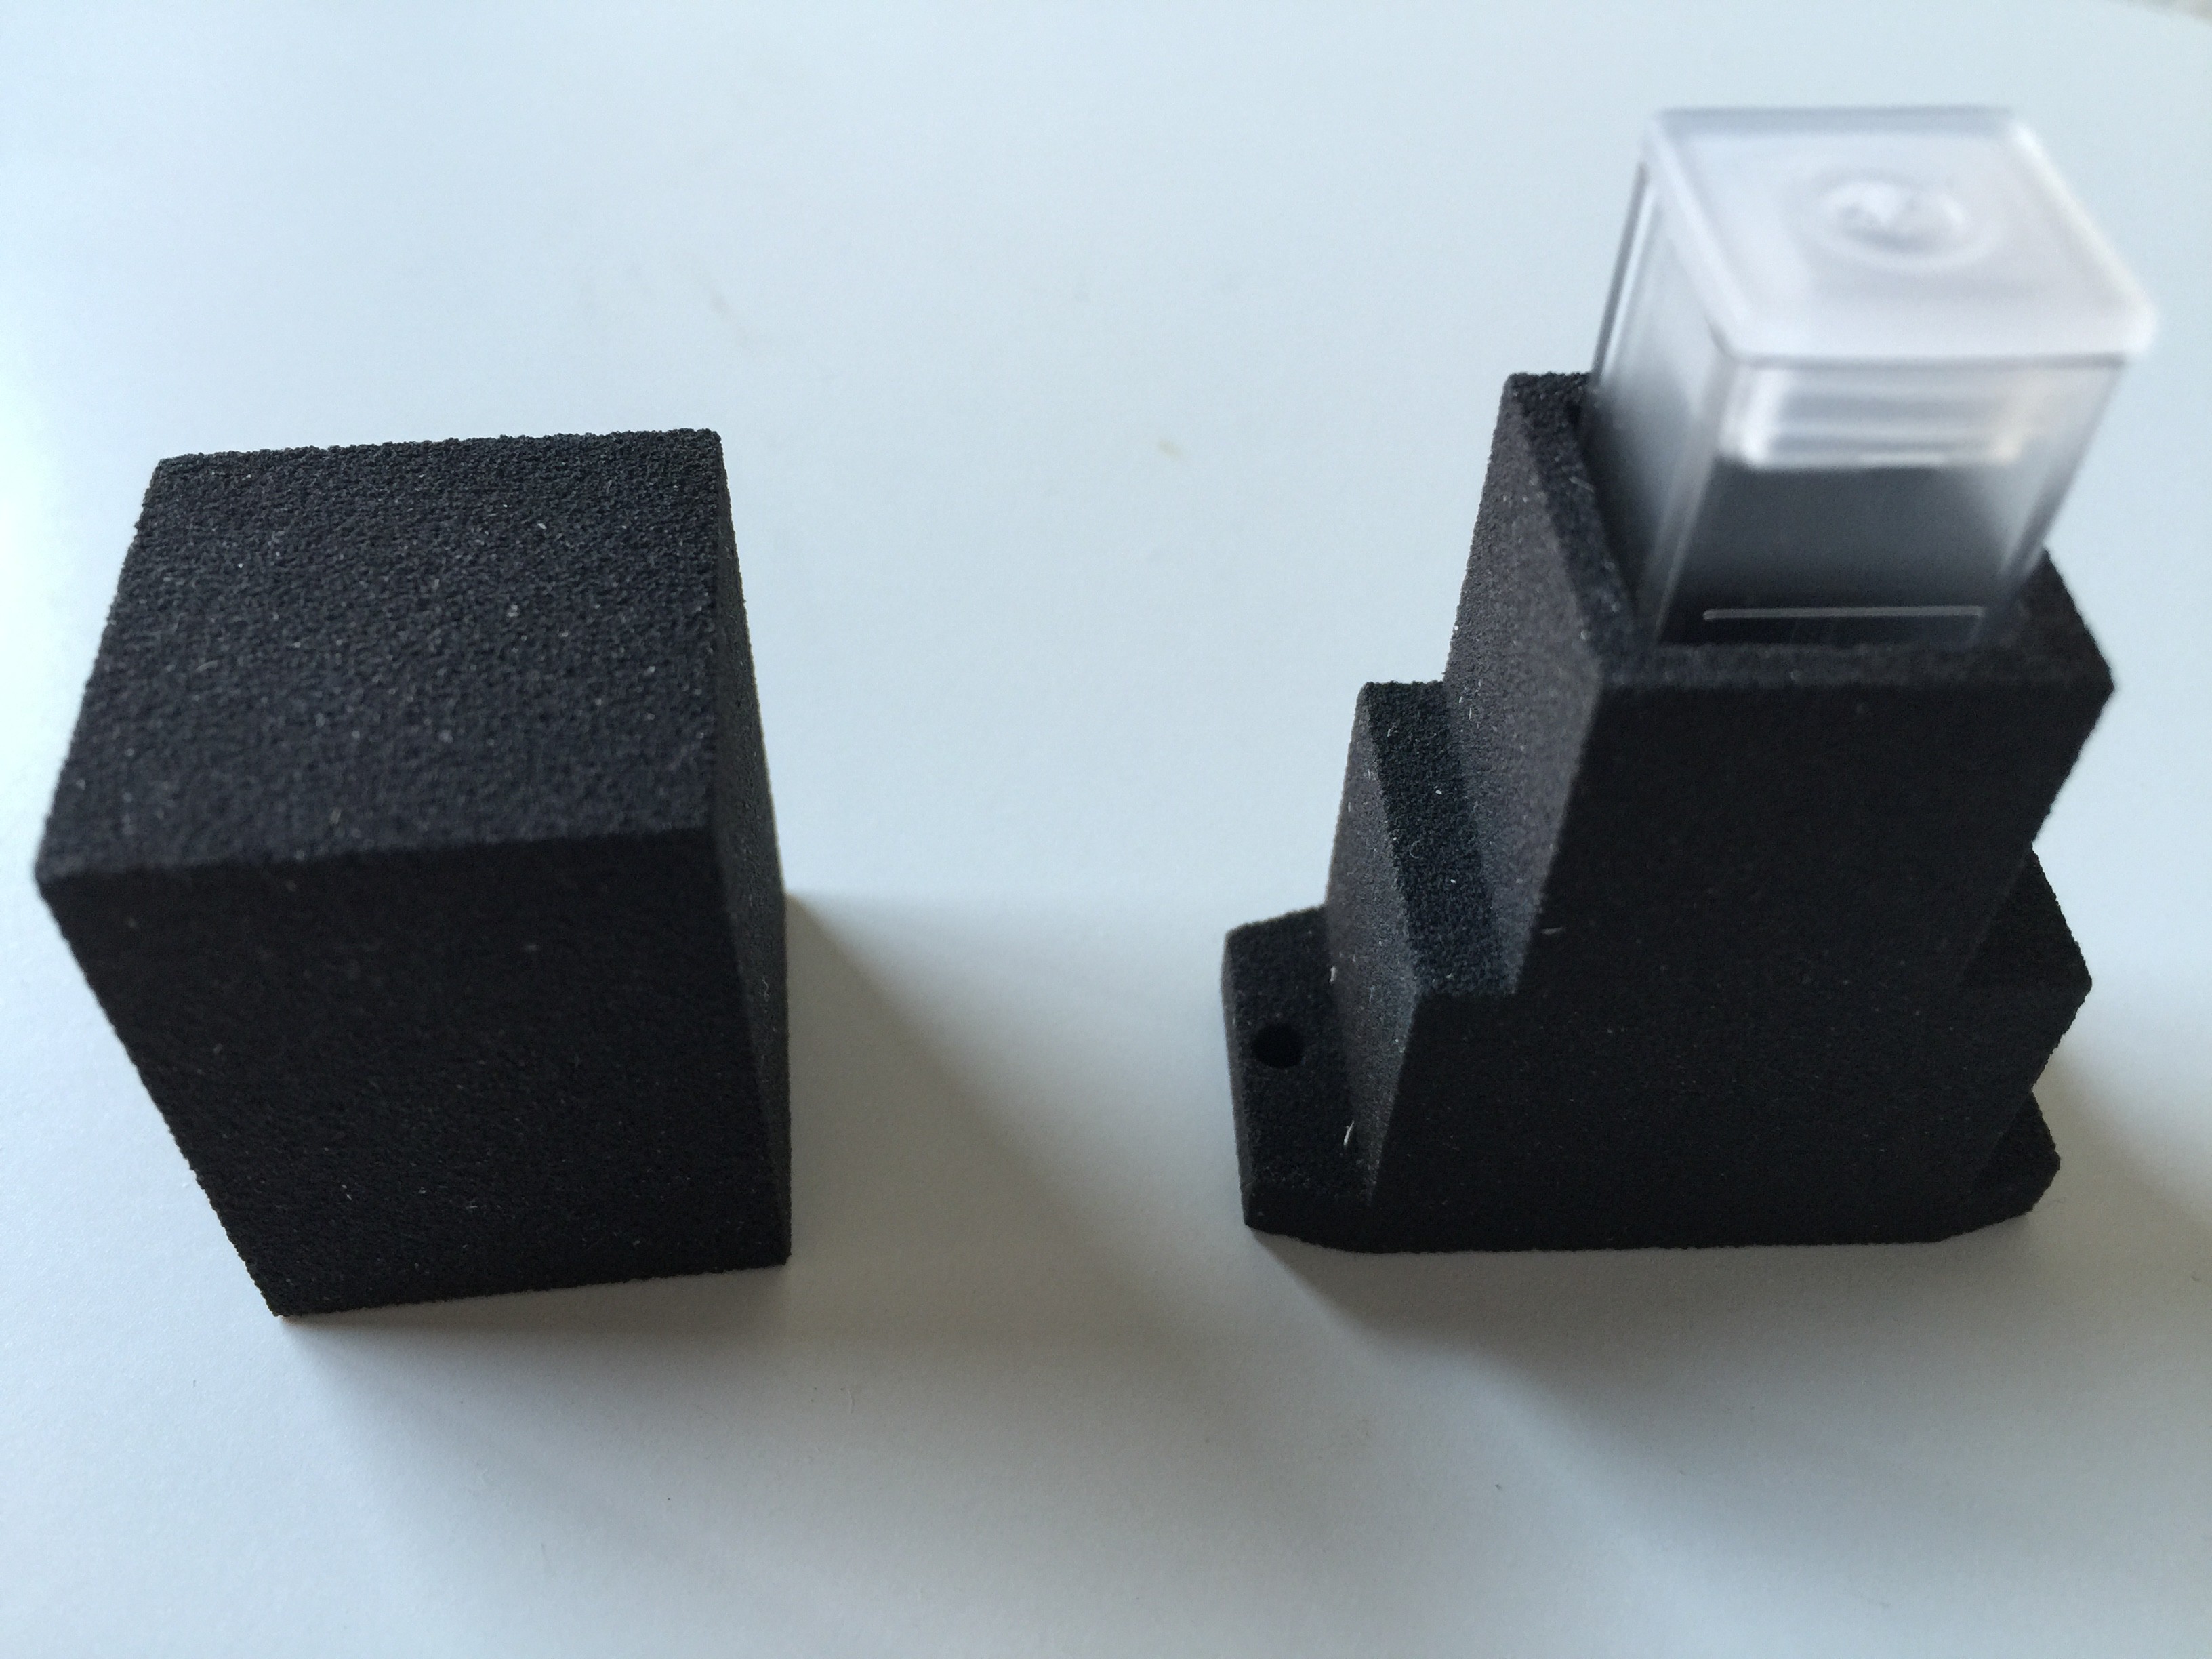
The housing for the spectrophotometer was produced by applying a particle material (PMMA Polymethylmethacrylate) in layers, which is bonded together with a binding agent.
Finally the cuvettes arrived:
PCB's:
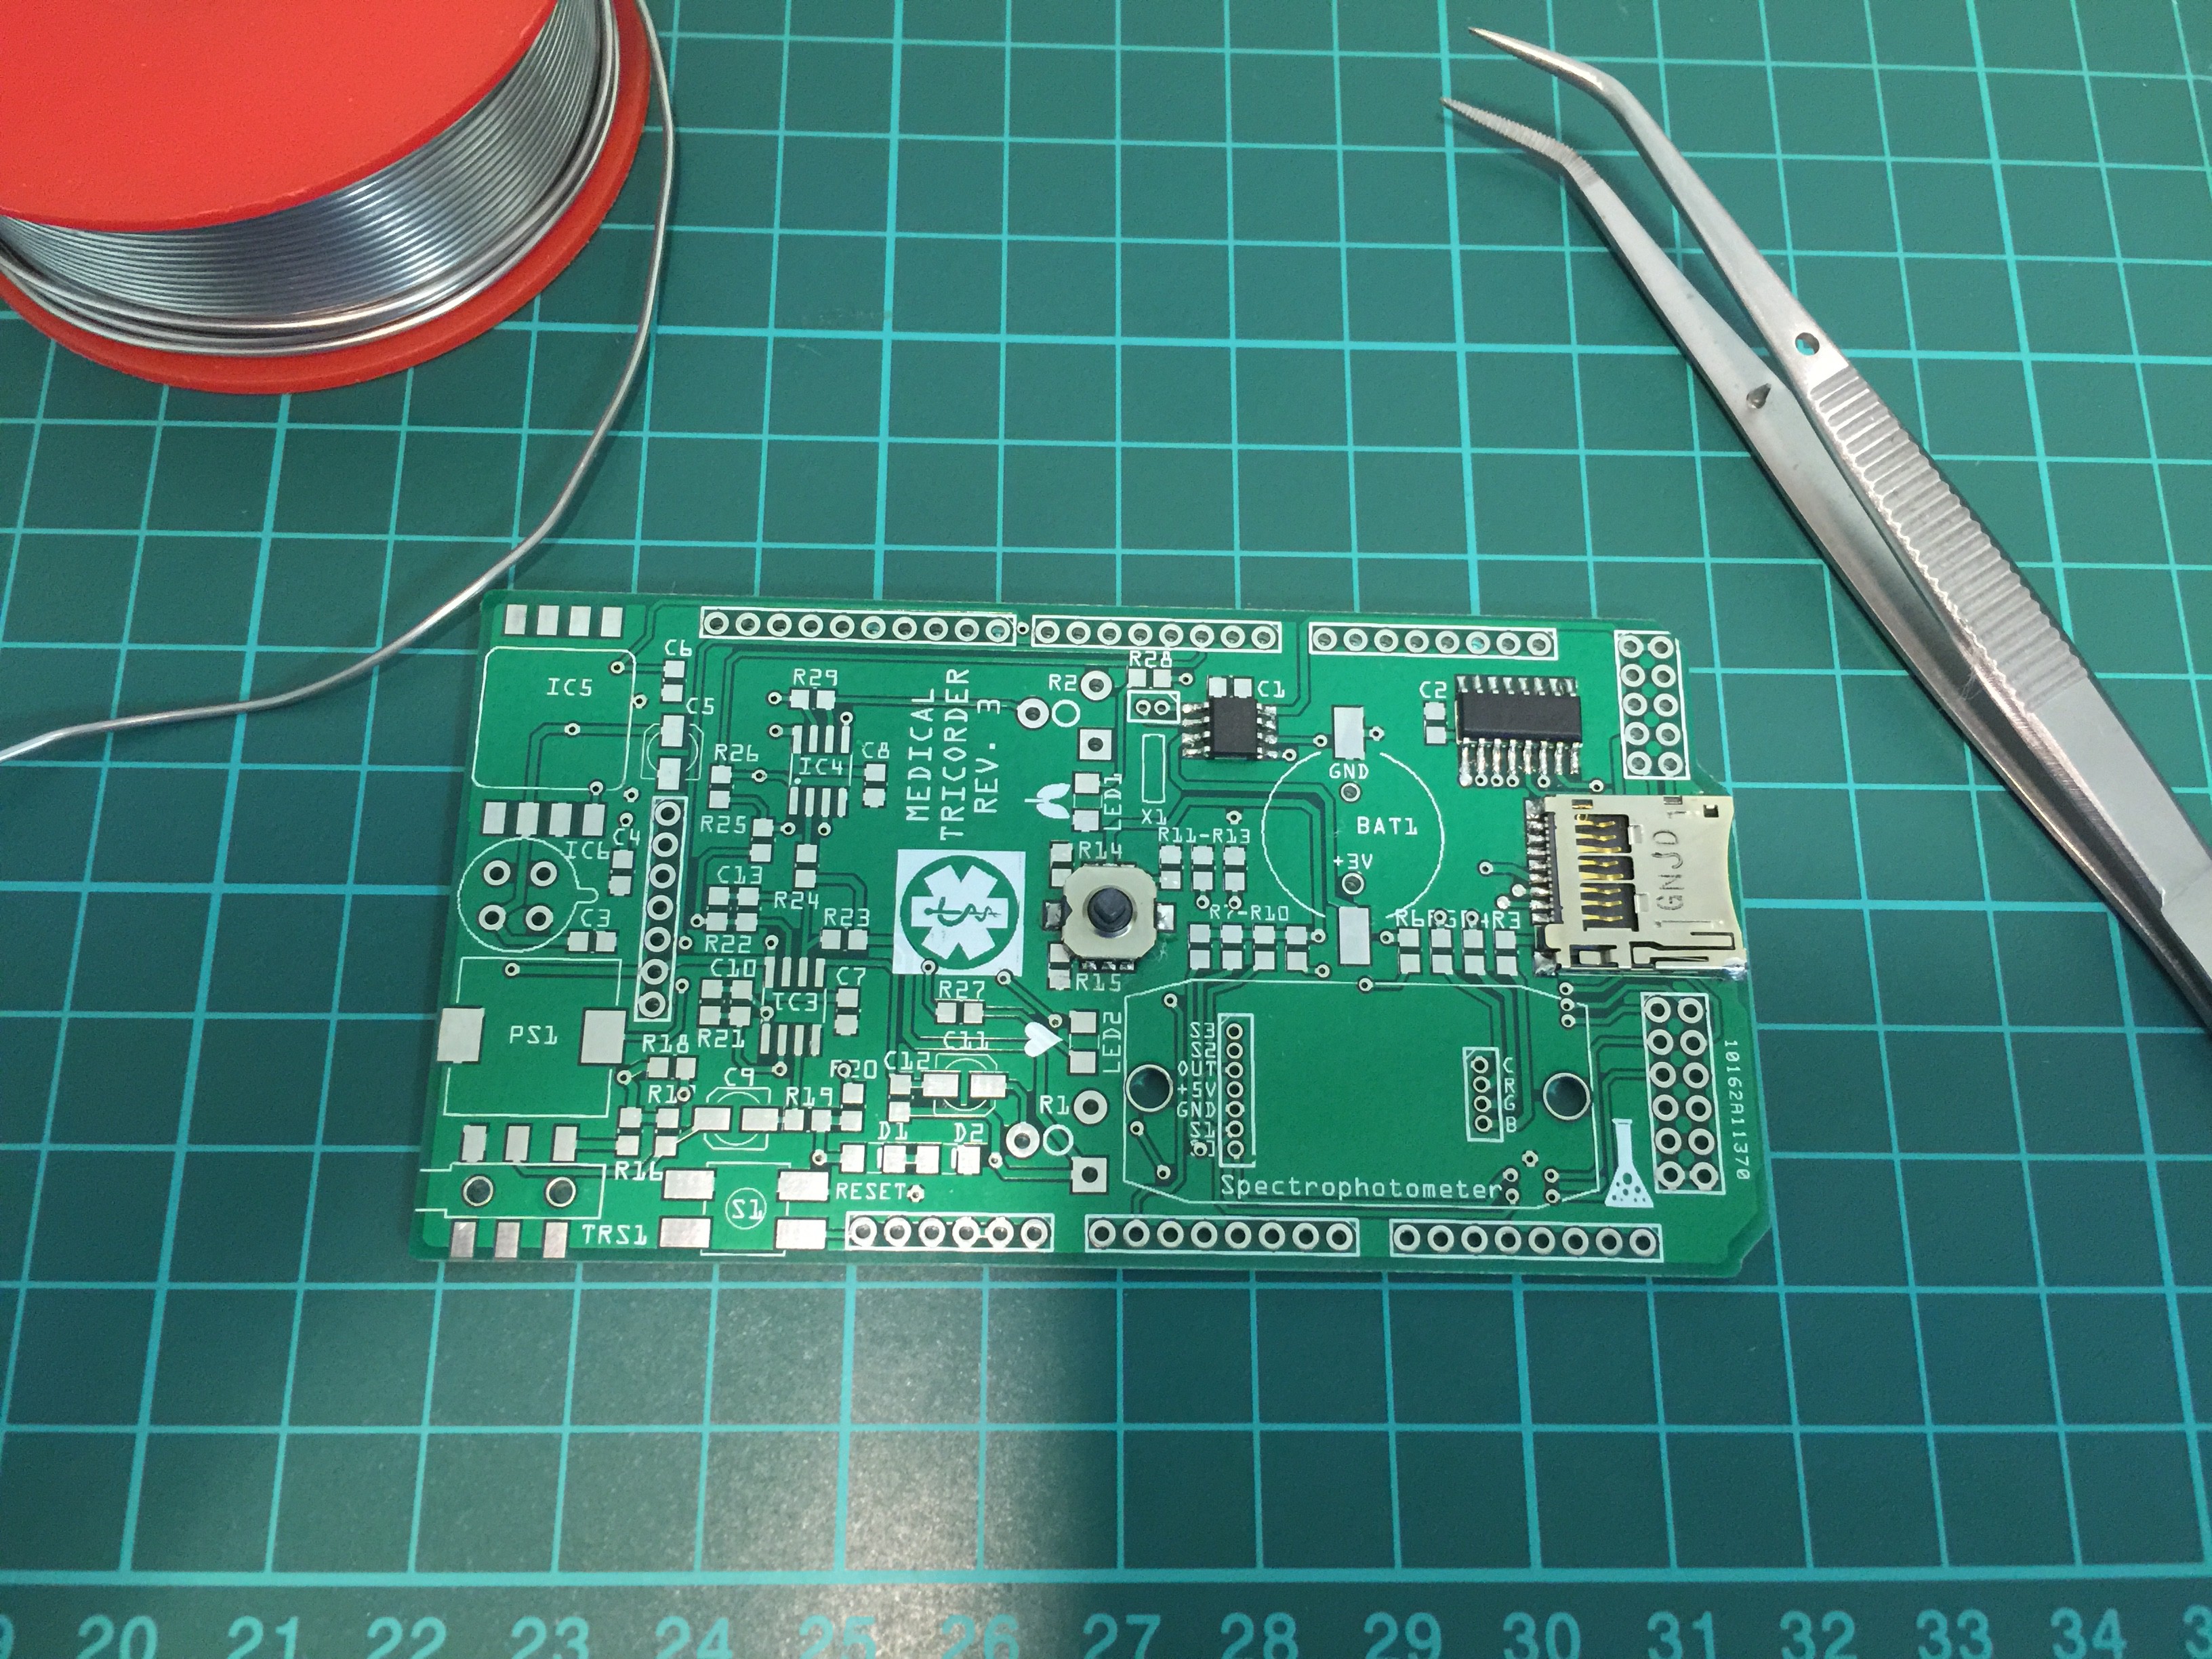
Partly populated:
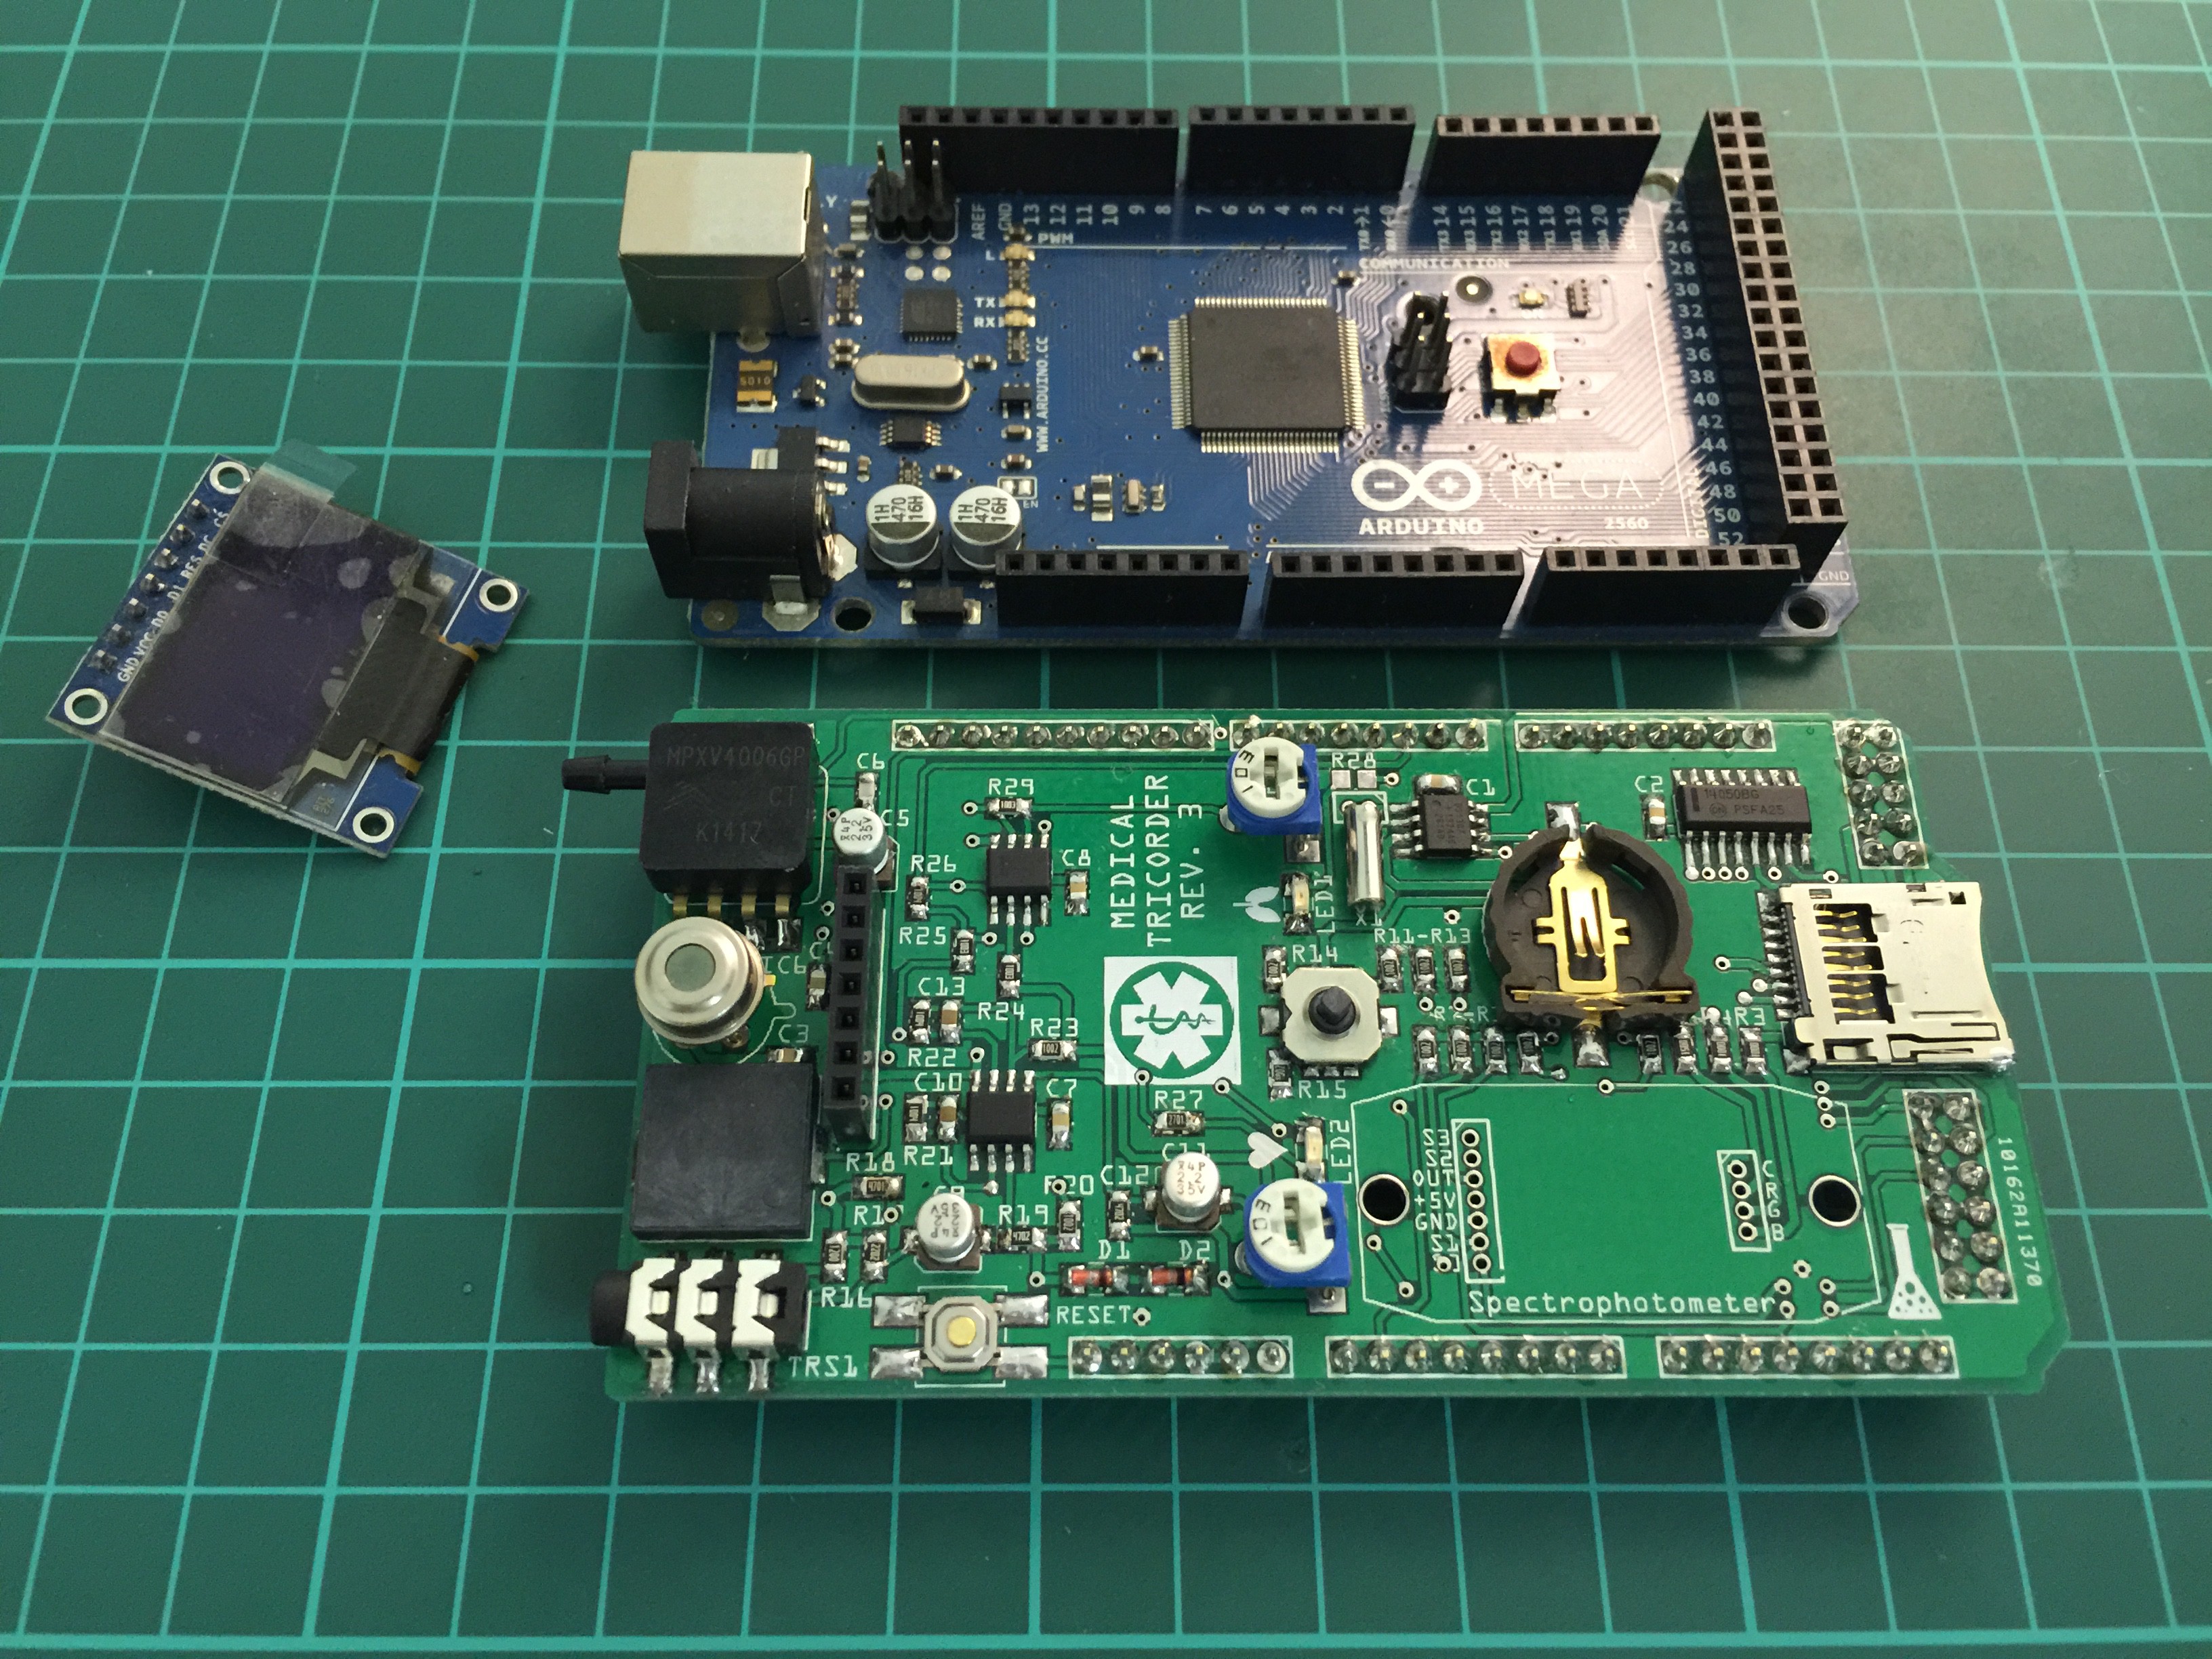
PCB ready for some first tests:
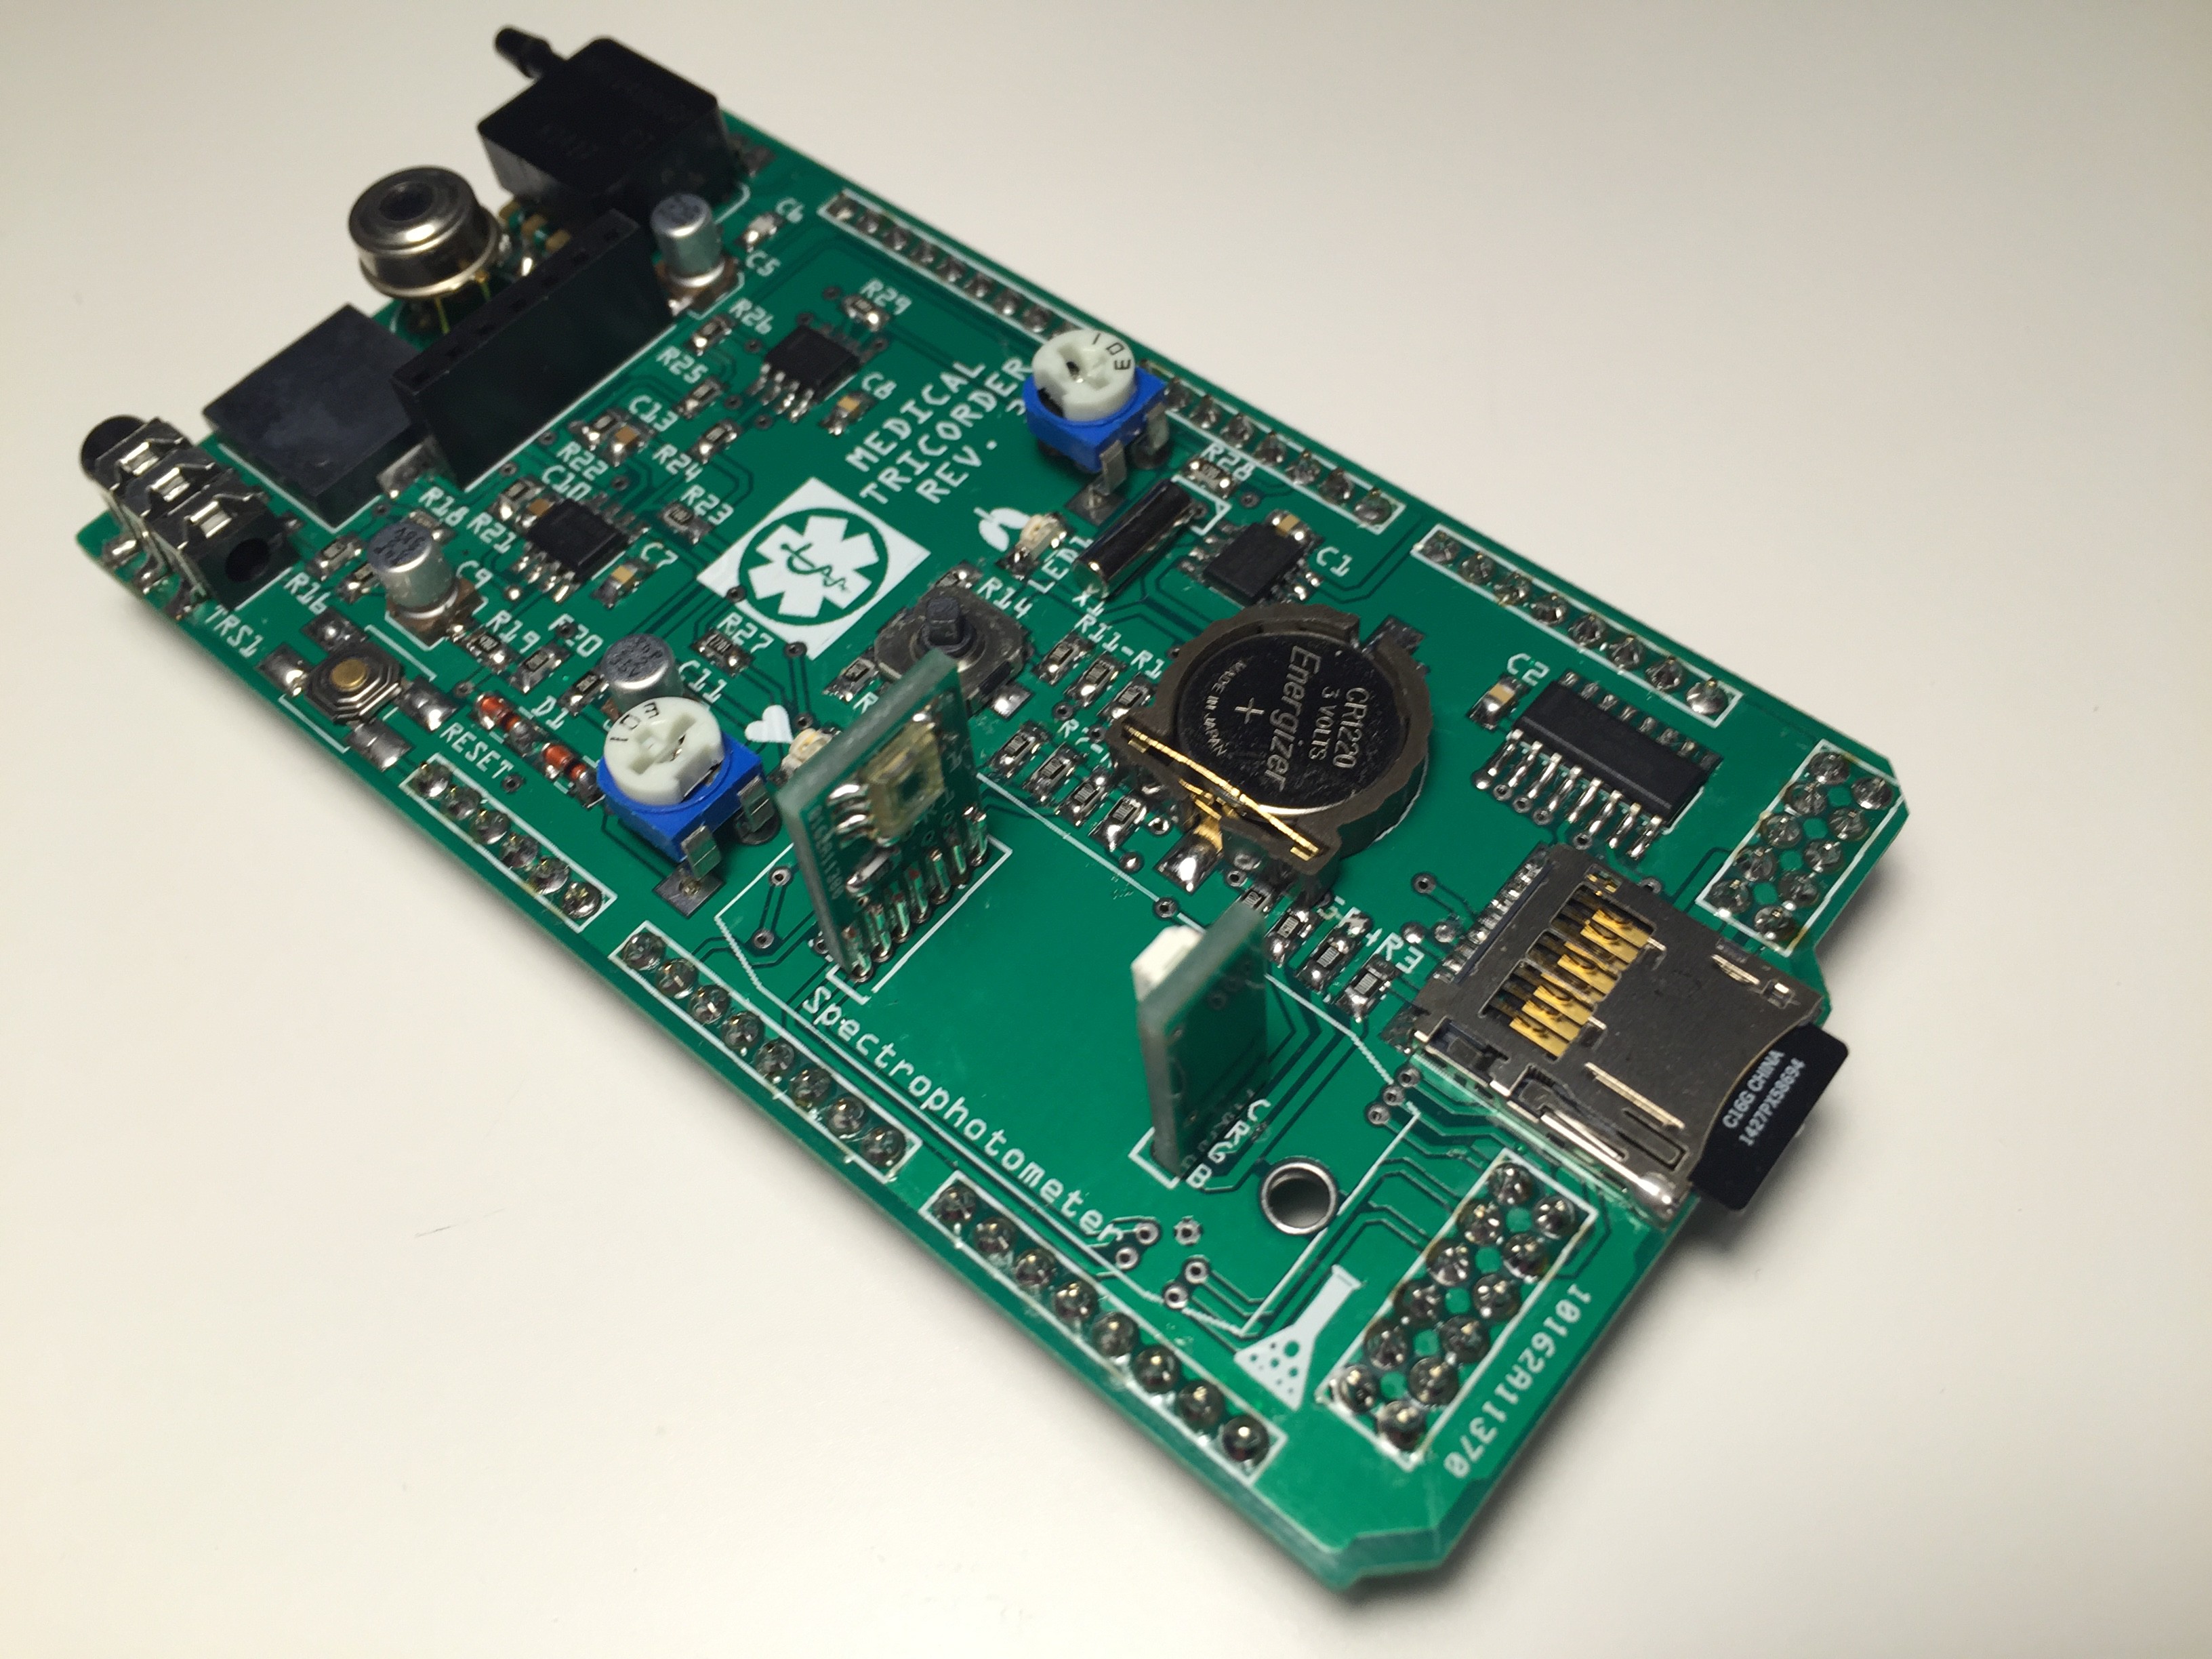
Completely populated shield:
Testing the RGB LED of the spectrophotometer:
The next couple of days I will write code for the spectrophotometer. Once done, a short demonstration video will follow.
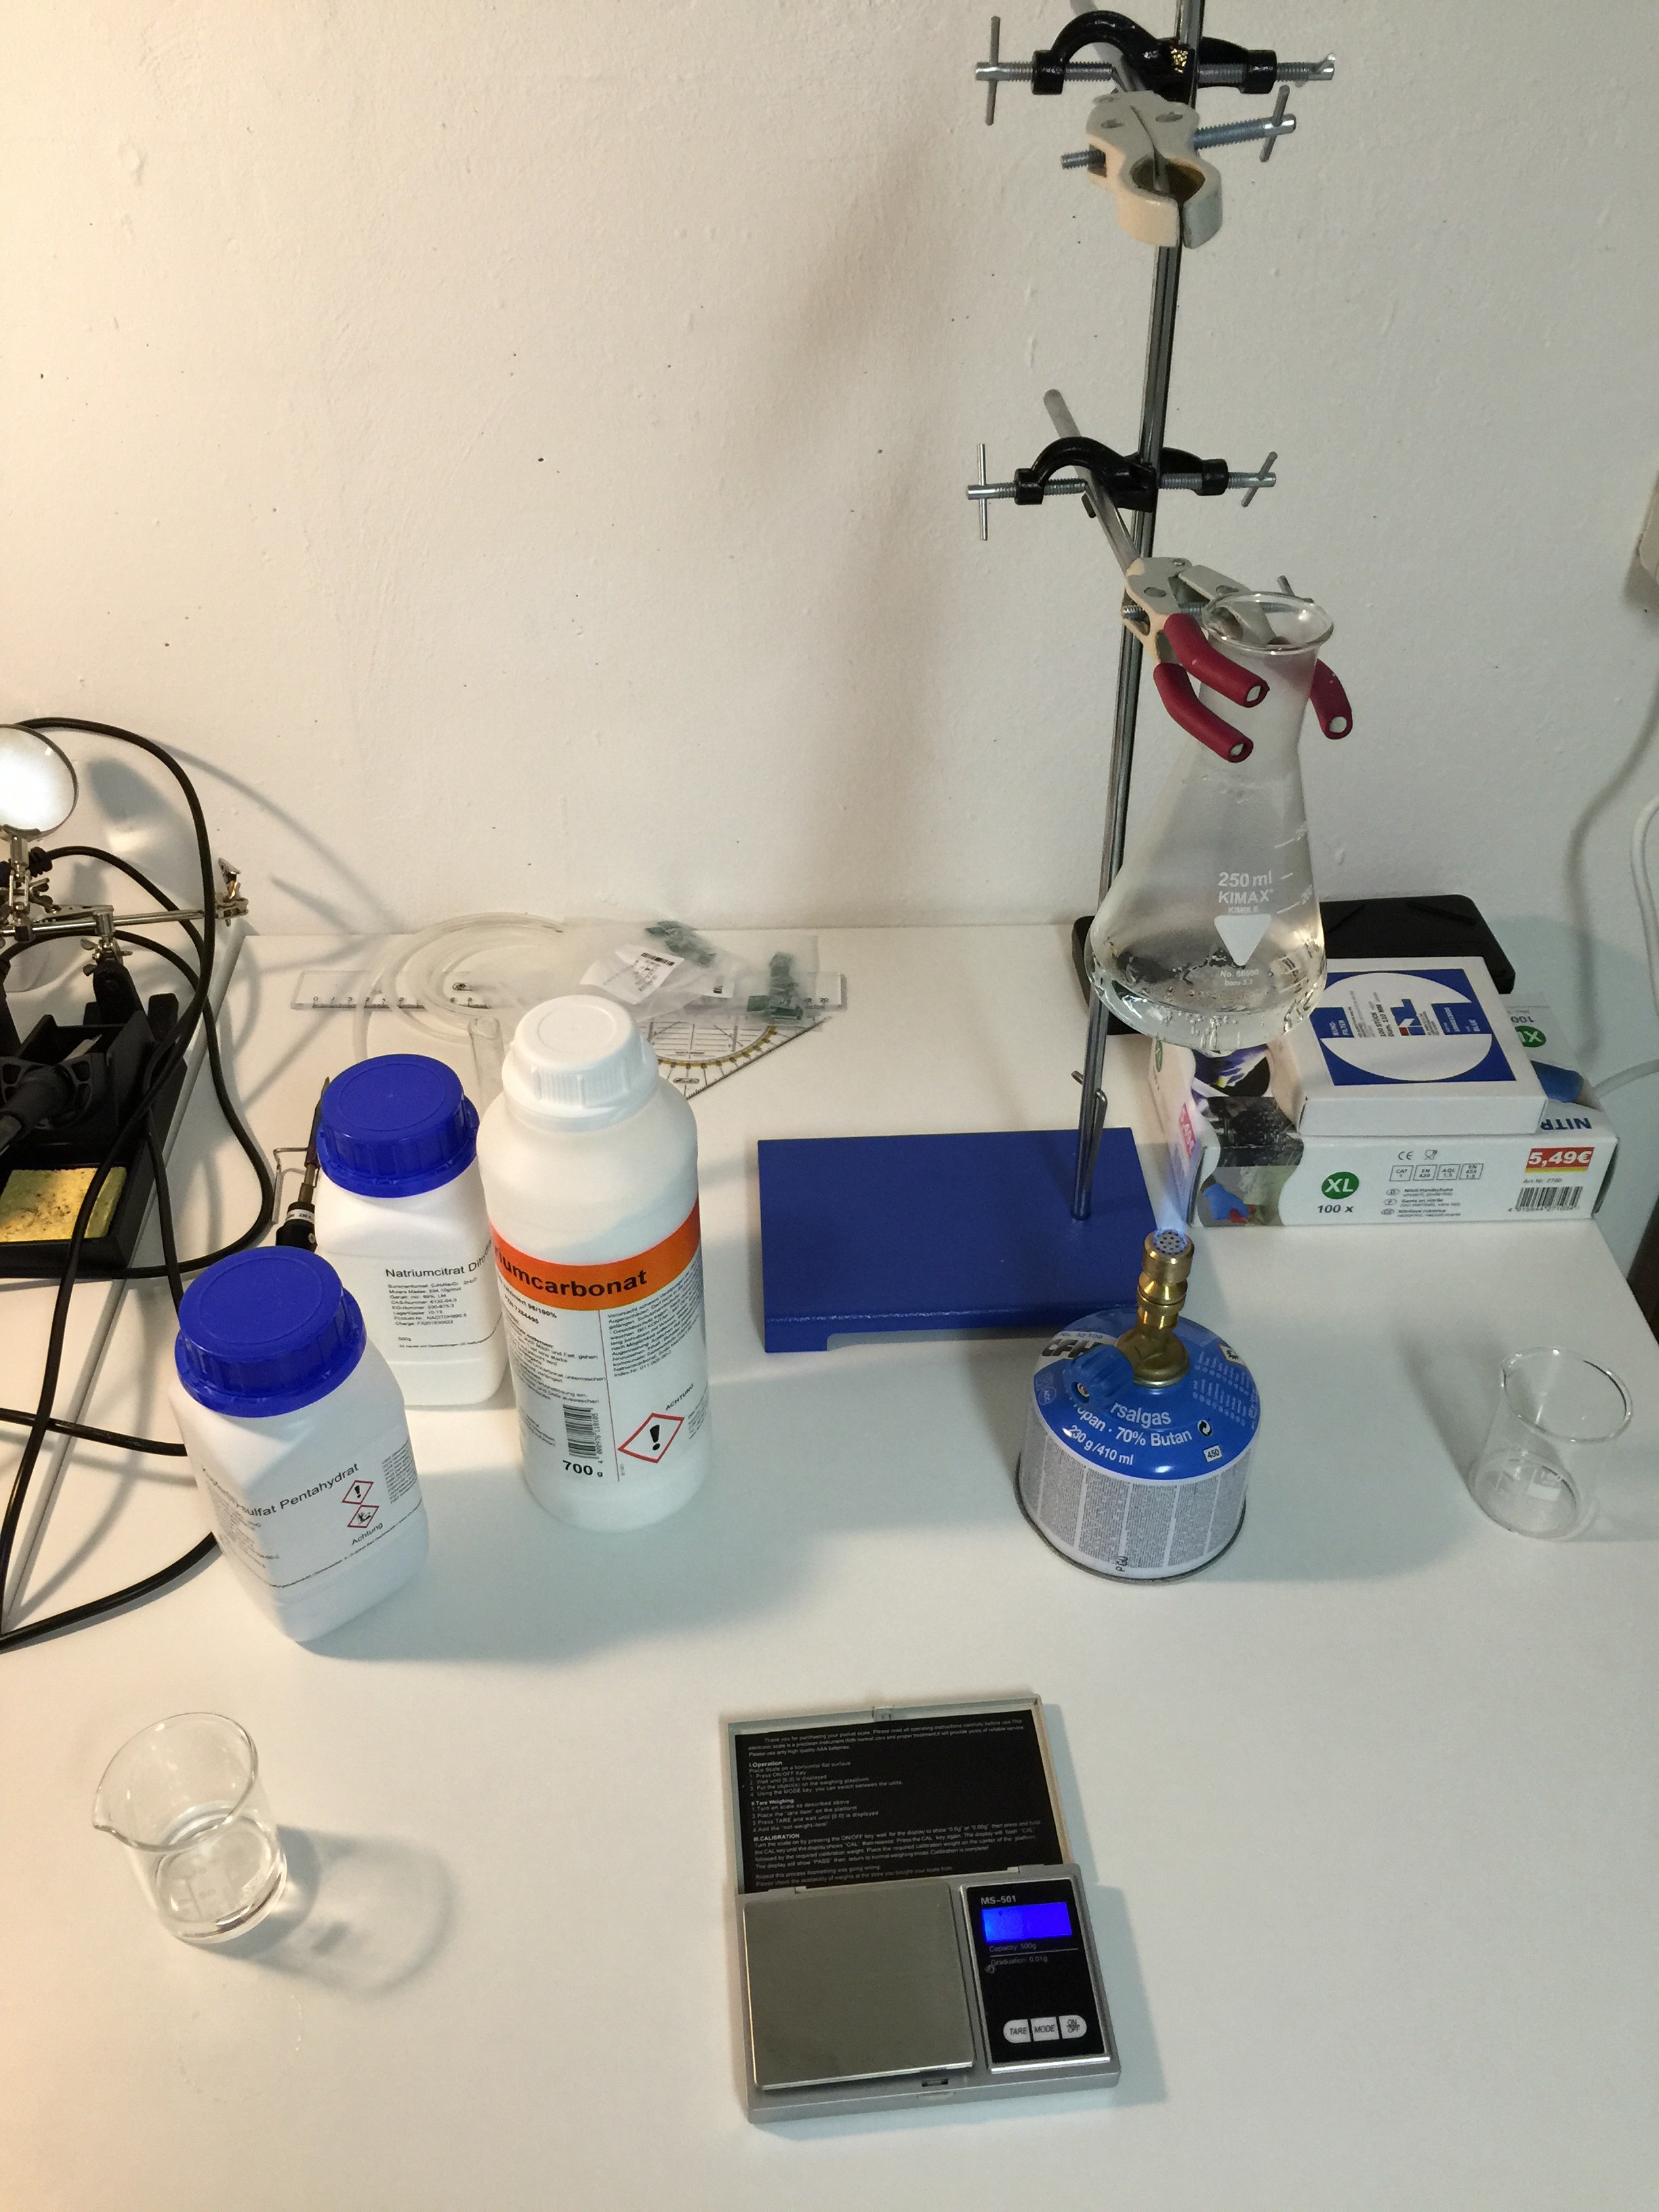
In a first test I will use Benedict's solution to determinate glucose level in urine. Benedict's solution is prepared as following:
(1) Benedict A: Dissolve 1.7 g of Copper (II) sulfate pentahydrate in 20 ml of deionized H2O.
(2) Benedict B: Dissolve 17.3 g of Sodium citrate and 10 g of anhydrous Sodium carbonate in 70 ml warm deionized water.
(3) Benedict's Reagent: Pour Benedict's solution A slowly into solution B and make up the volume to 100 ml . Mix well.
Use this procedure to determinate glucose level by spectrophotometer.
Preparing Benedict's reagent:
General Benedict's reagent test (Glucose):Next step is to work out a concentration standard curve and derive a function by curve fitting.
To do this, the main housing of the spectrophotometer needed some small modifications to fit well. I have updated the 3-D drawing and STL file. New sample will arrive in a couple of days from the fab house. Once arrived, I'll be able to finish spectrophotometer code and prepare standard glucose/Benedict's reagent samples to obtain a look-up table. In the mean time I will work on other code snippets like core temperature reading and heart beat.
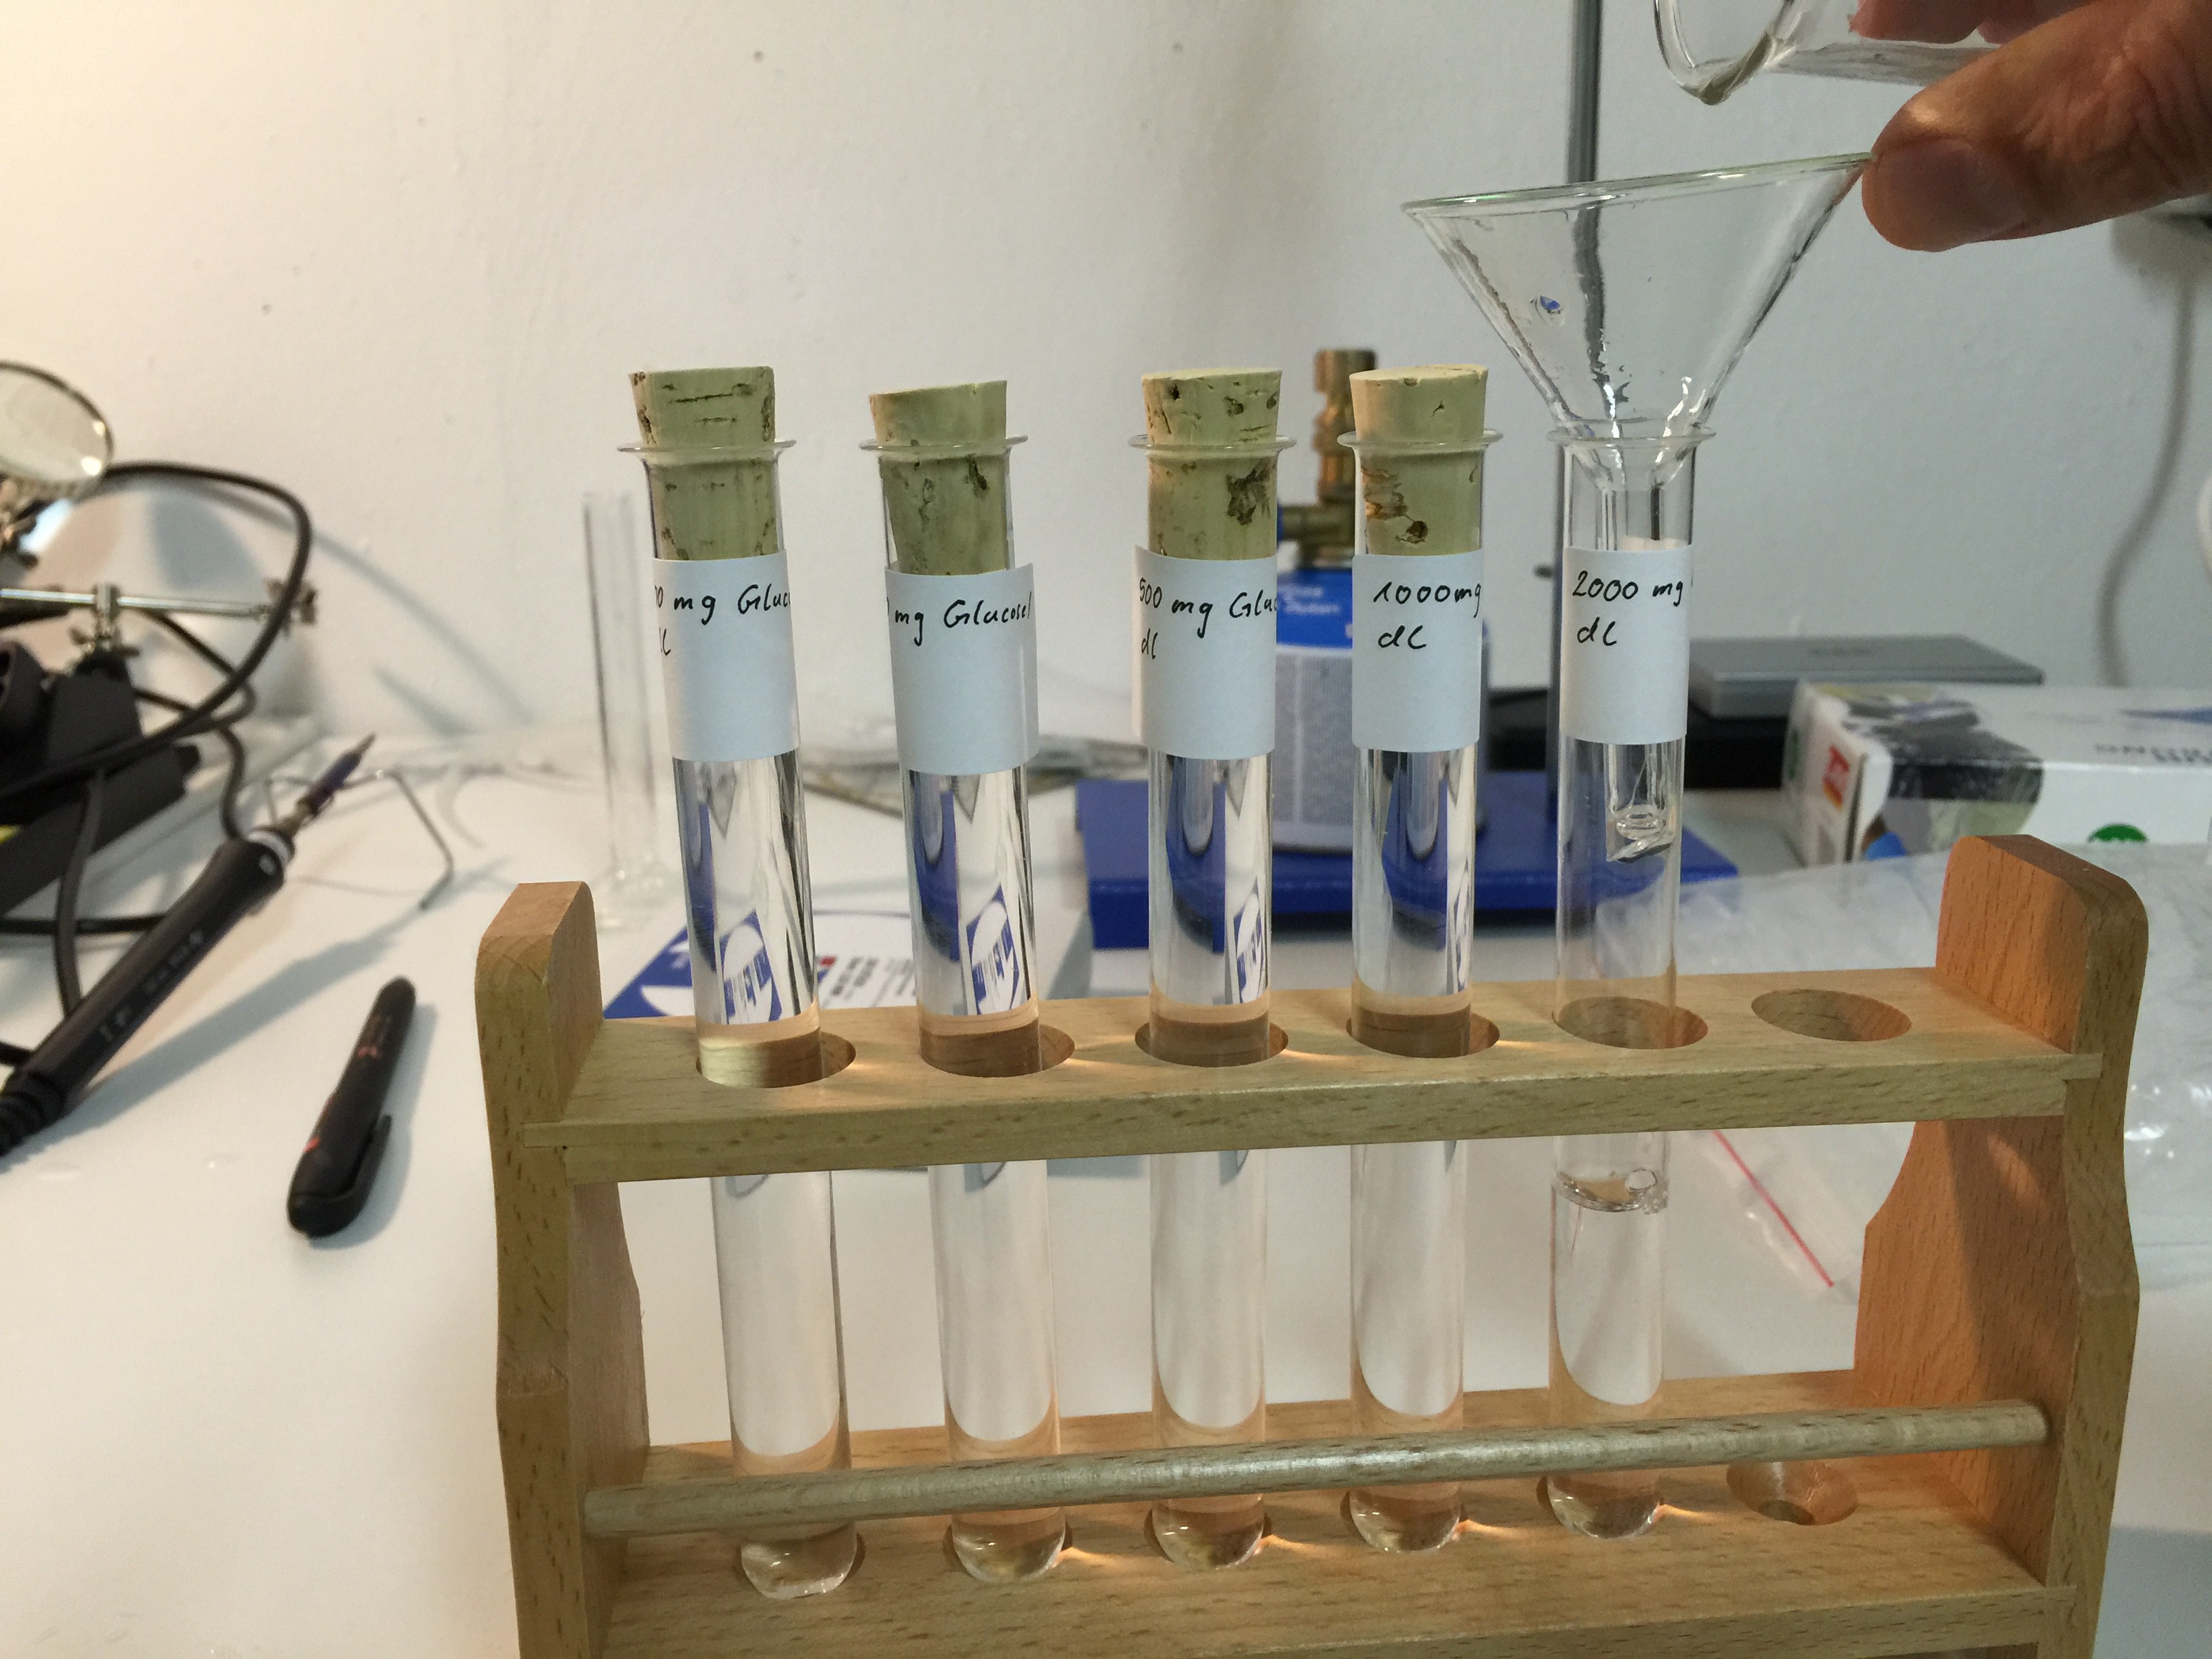
The new housing of the spectrophotometer will arrive tomorrow, so I started to prepare different solutions (100 mg/dl, 250 mg/dl, 500 mg/dl, 1000 mg/dl, 2000 mg/dl) of D-(+)-Glucose monohydrate ≥ 99.0% for microbiology and deinoized water:
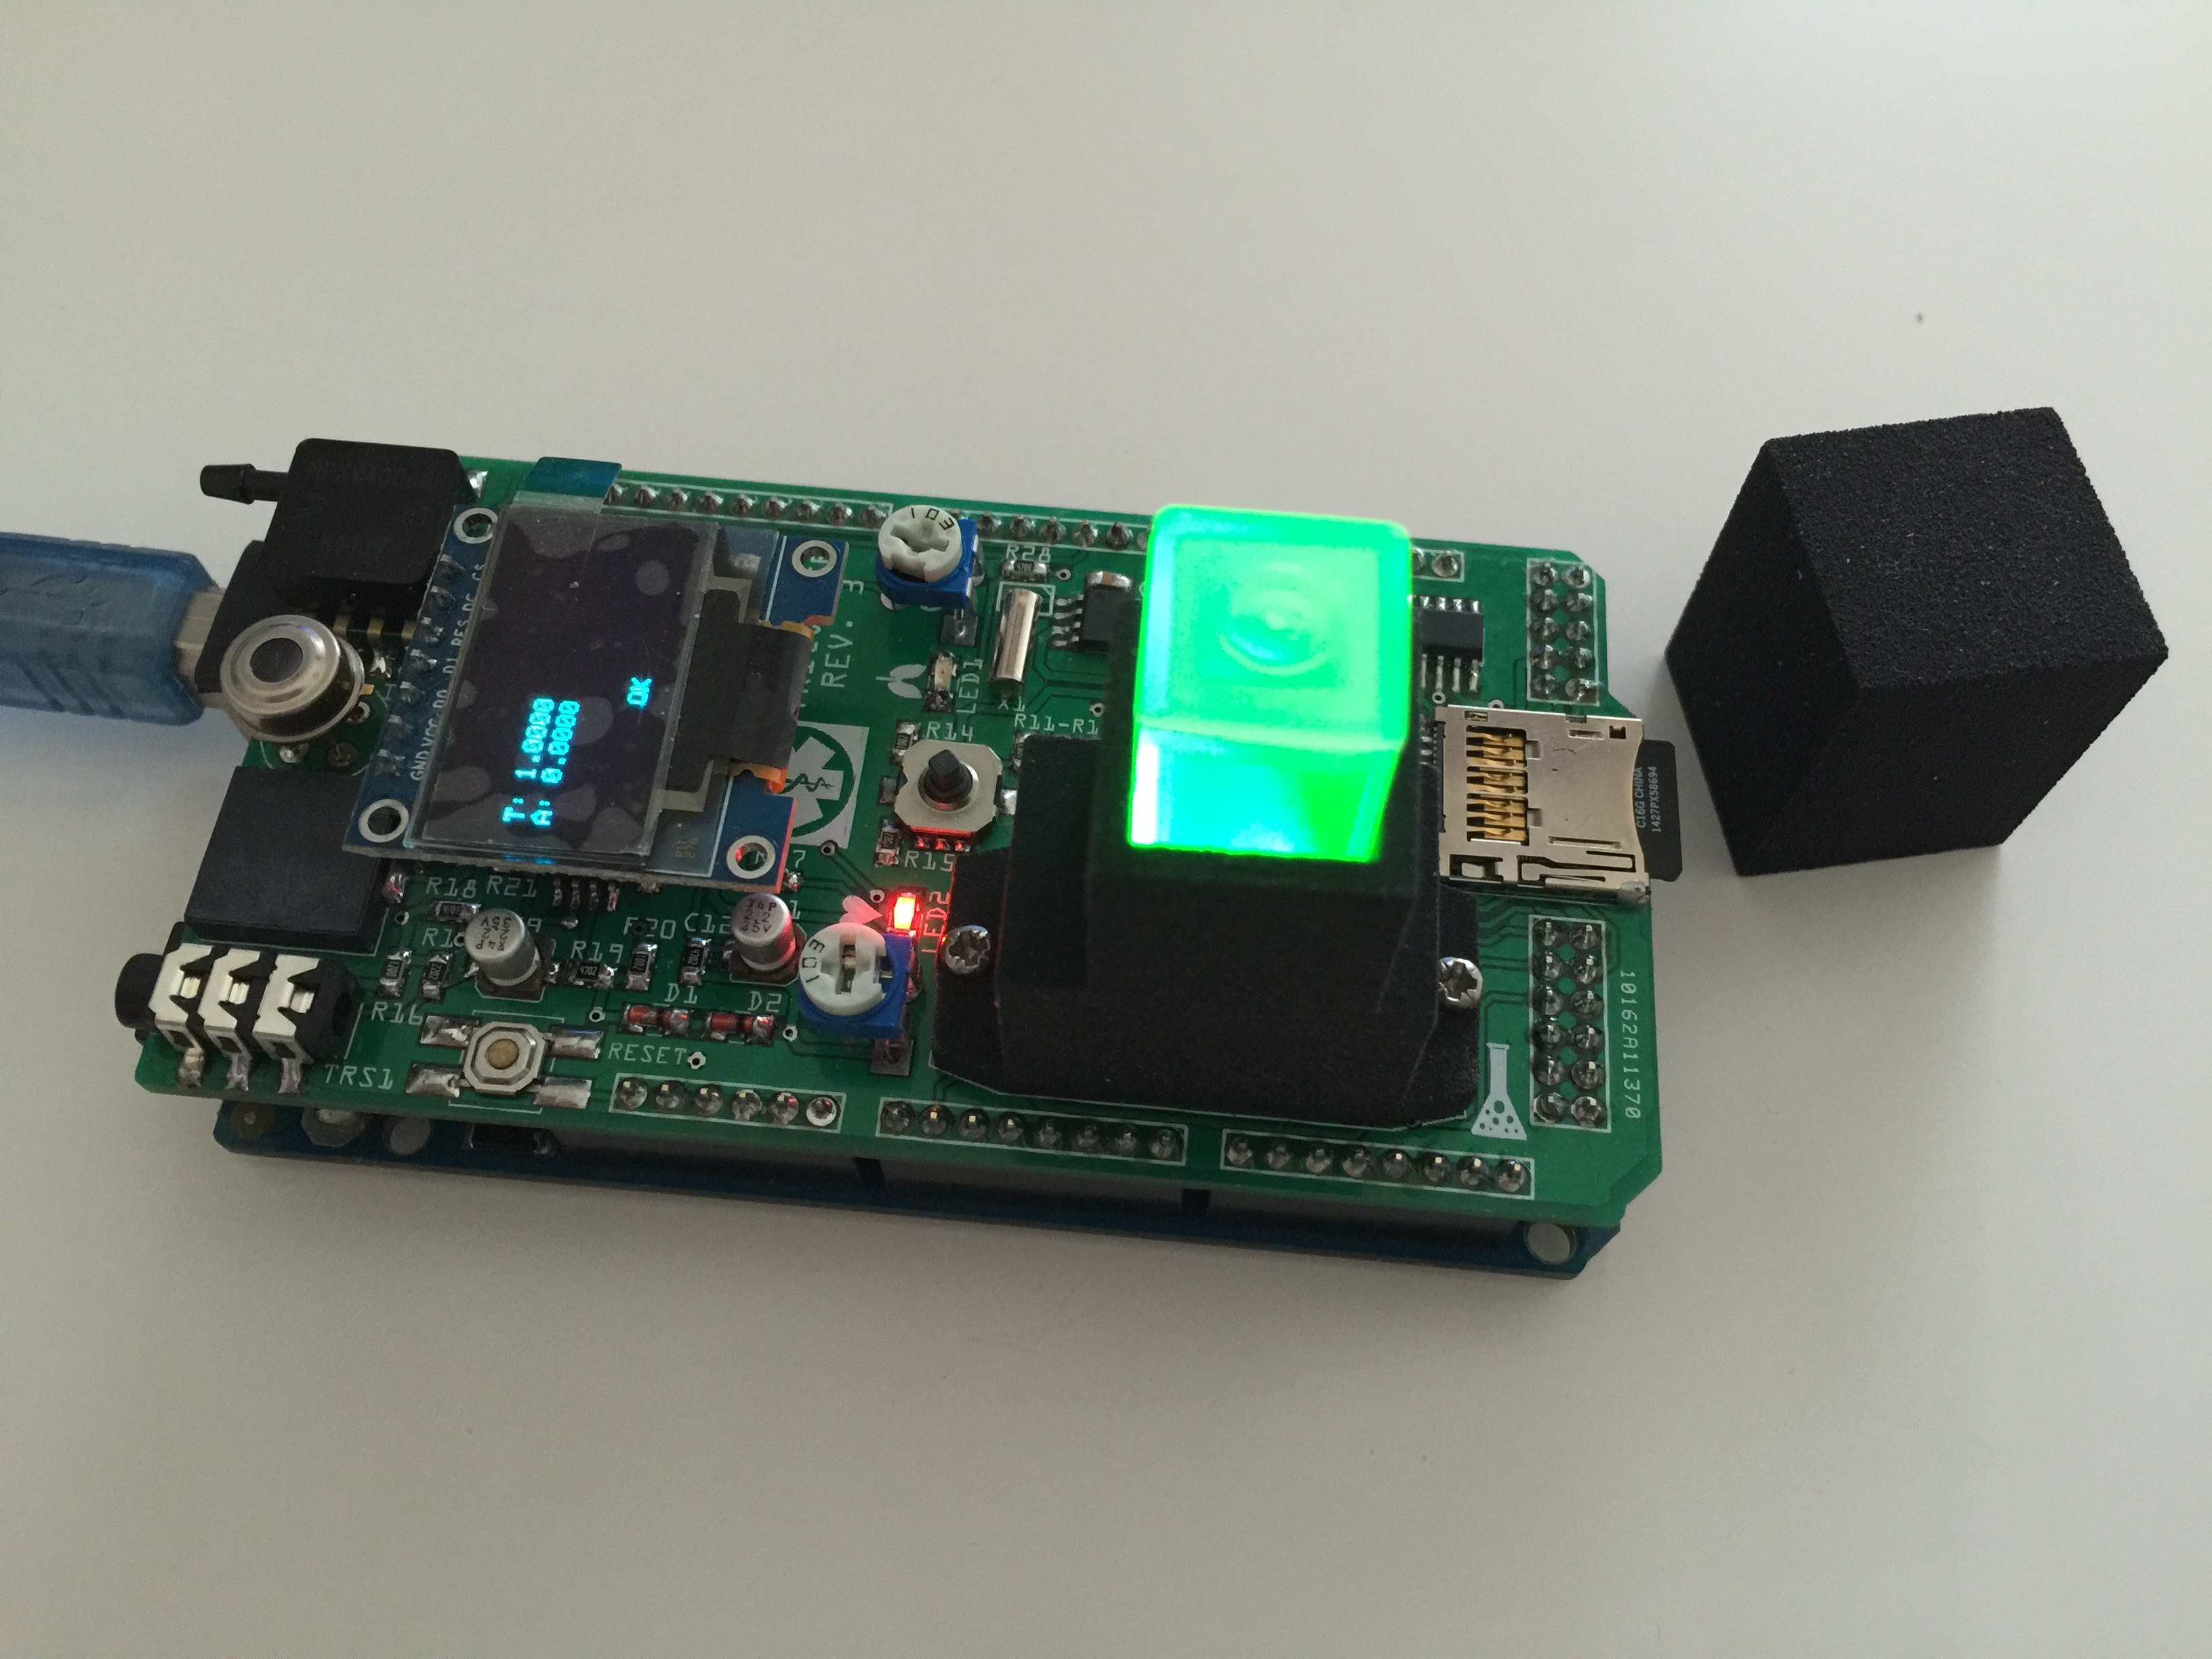
First tests with the finished spectrophotometer:
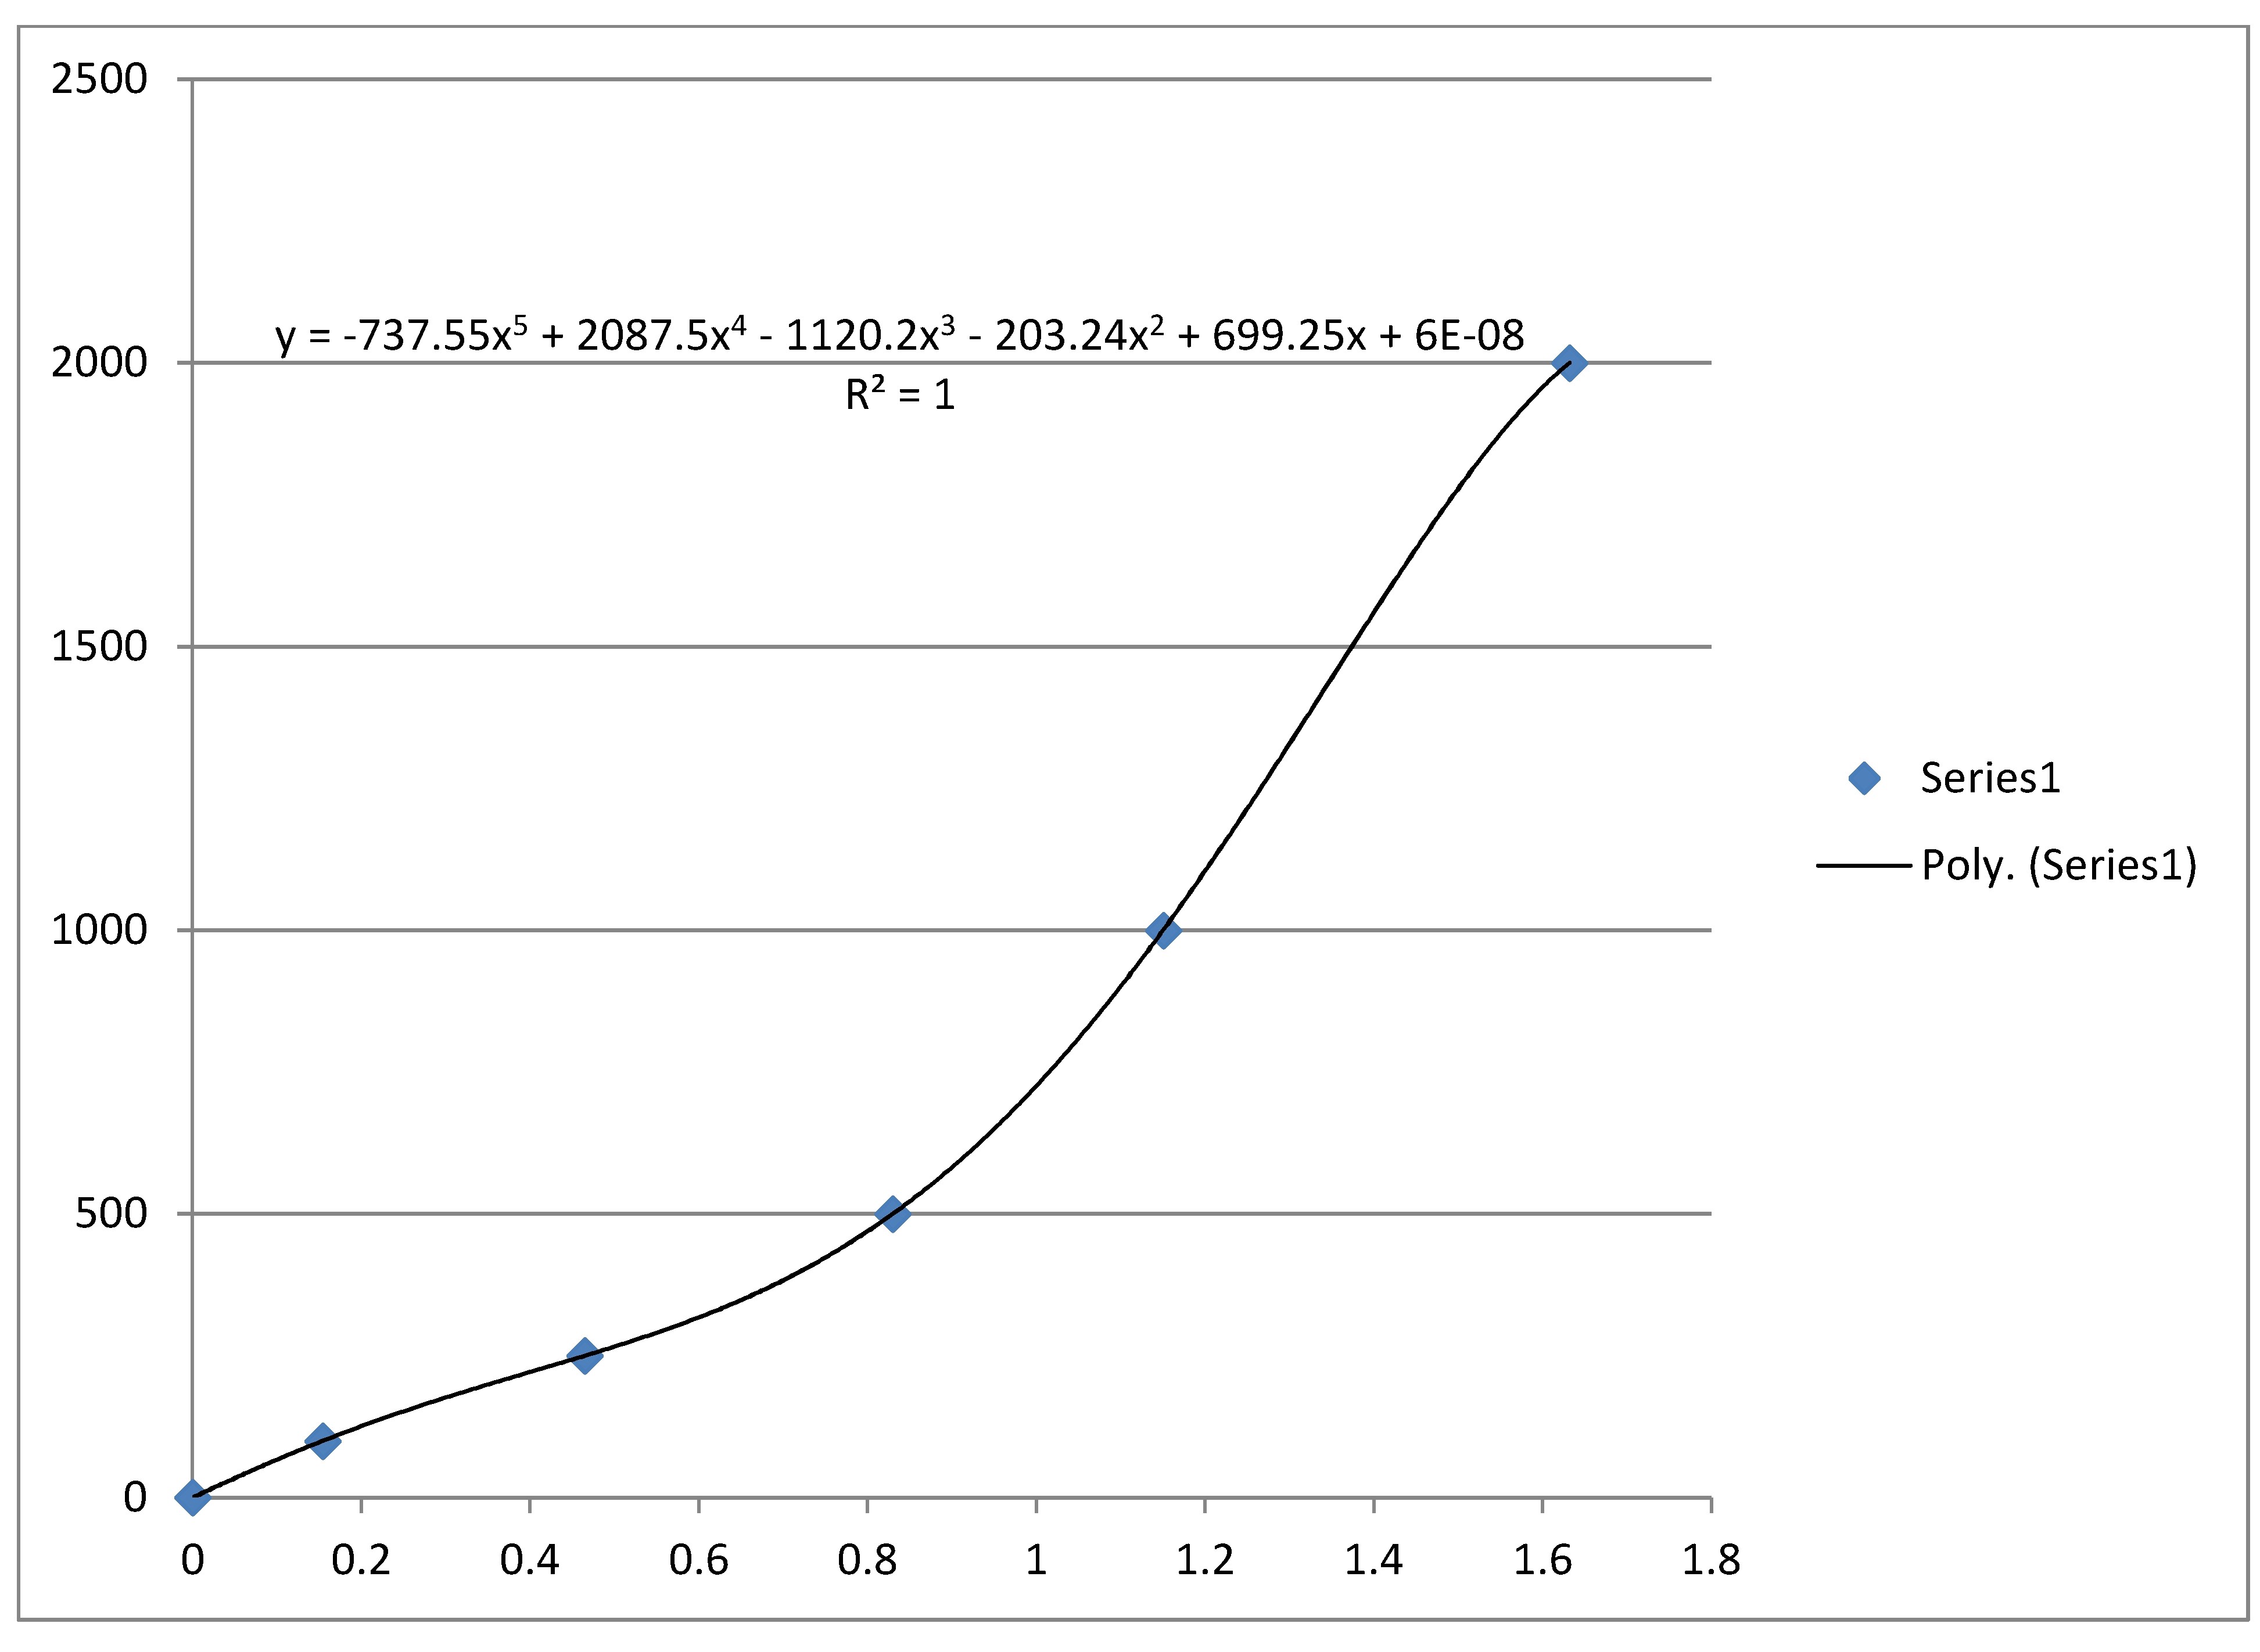
For λ = 528 nm, read with no filter, 3 ml Glucose solution and 1 ml Benedict's reagent, heating mixture for 1 minute in a boiling water bath in each case I obtained following trendline made by Excel. x-axis: absorbance, y-axis: concentration mg Glucose/dl.
![]()
The mass concentration is defined as the mass of a constituent divided by the volume of the mixture:
Therefore the mass concentration under above mentioned circumstances is given by (neglecting the last term of the Quintic function):
where A is the absorbance at a wavelength λ = 528 nm.
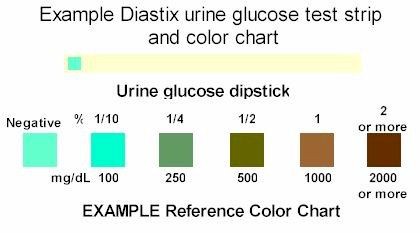
We might overfitting the model but we can run an additional K-nearest neighbor classification to find the usual concentrations mentioned on a Urine test strip:
![]() Source: http://www.caninediabetes.org/pdorg/urine.html
Source: http://www.caninediabetes.org/pdorg/urine.htmlPresence of > 40 mg Glucose/dl Urine could already be an indication of diabetes or a kidney disease.
Spectrophotometer demonstration video:
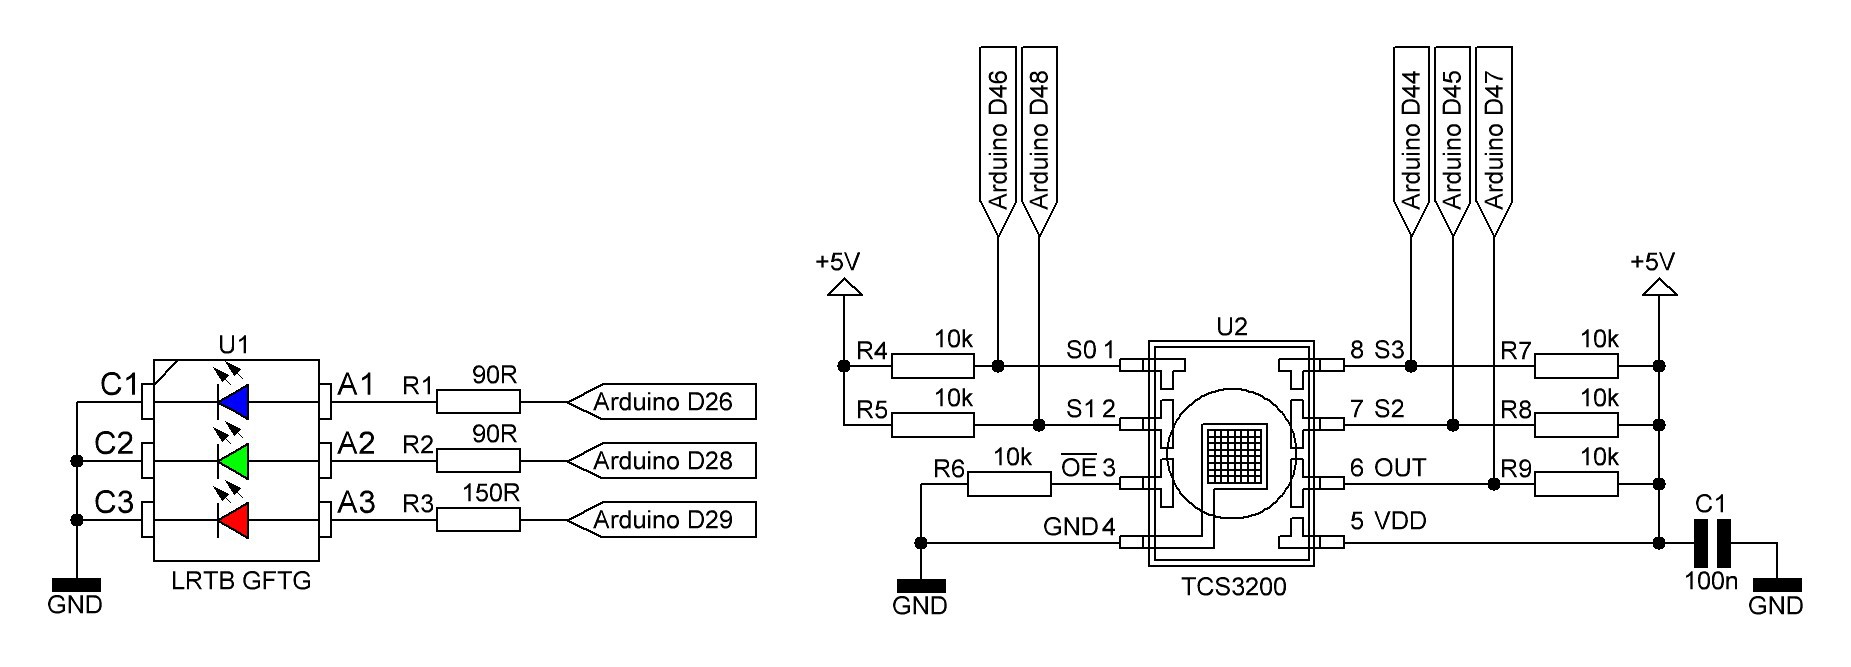
Spectrophotometer schematic (temporary):
R1 - R3 are series resistors for the RGB LED LRTB GFTG and R4 - R9 pull up/pull down resistors for the color sensor TCS3200. C1 is the usual decoupling capacitor for U2.
-
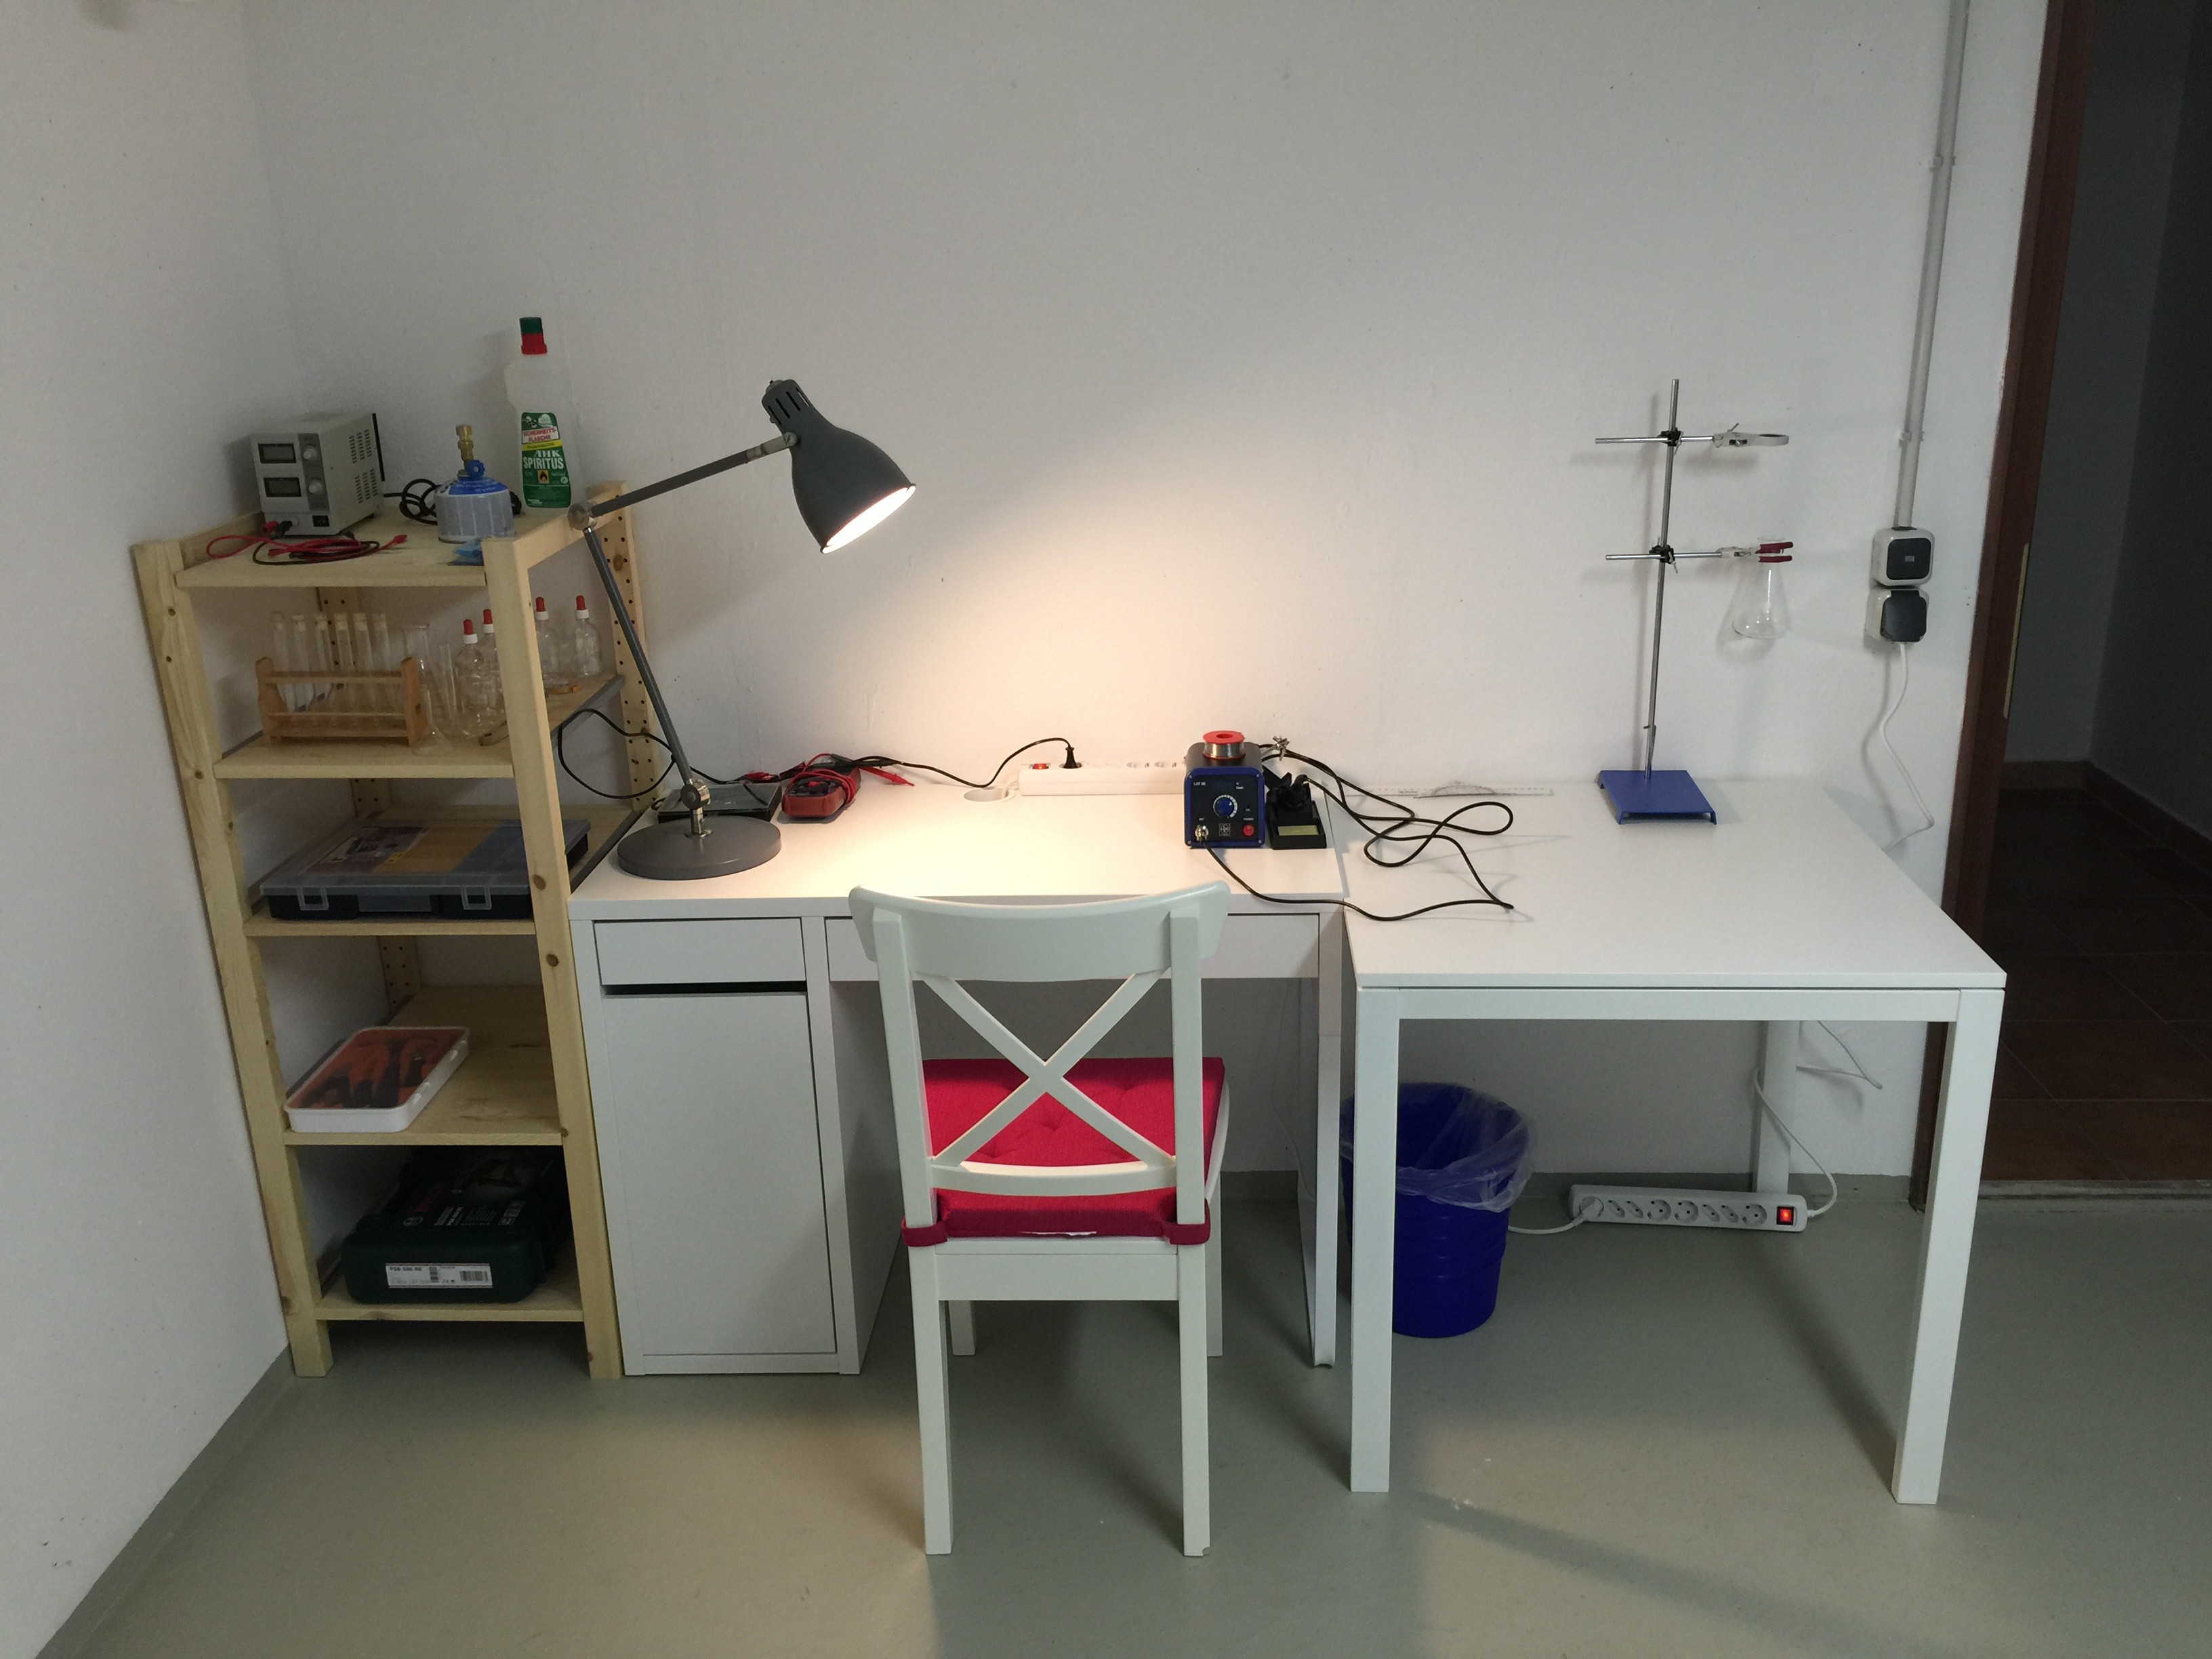
New lab in Germany
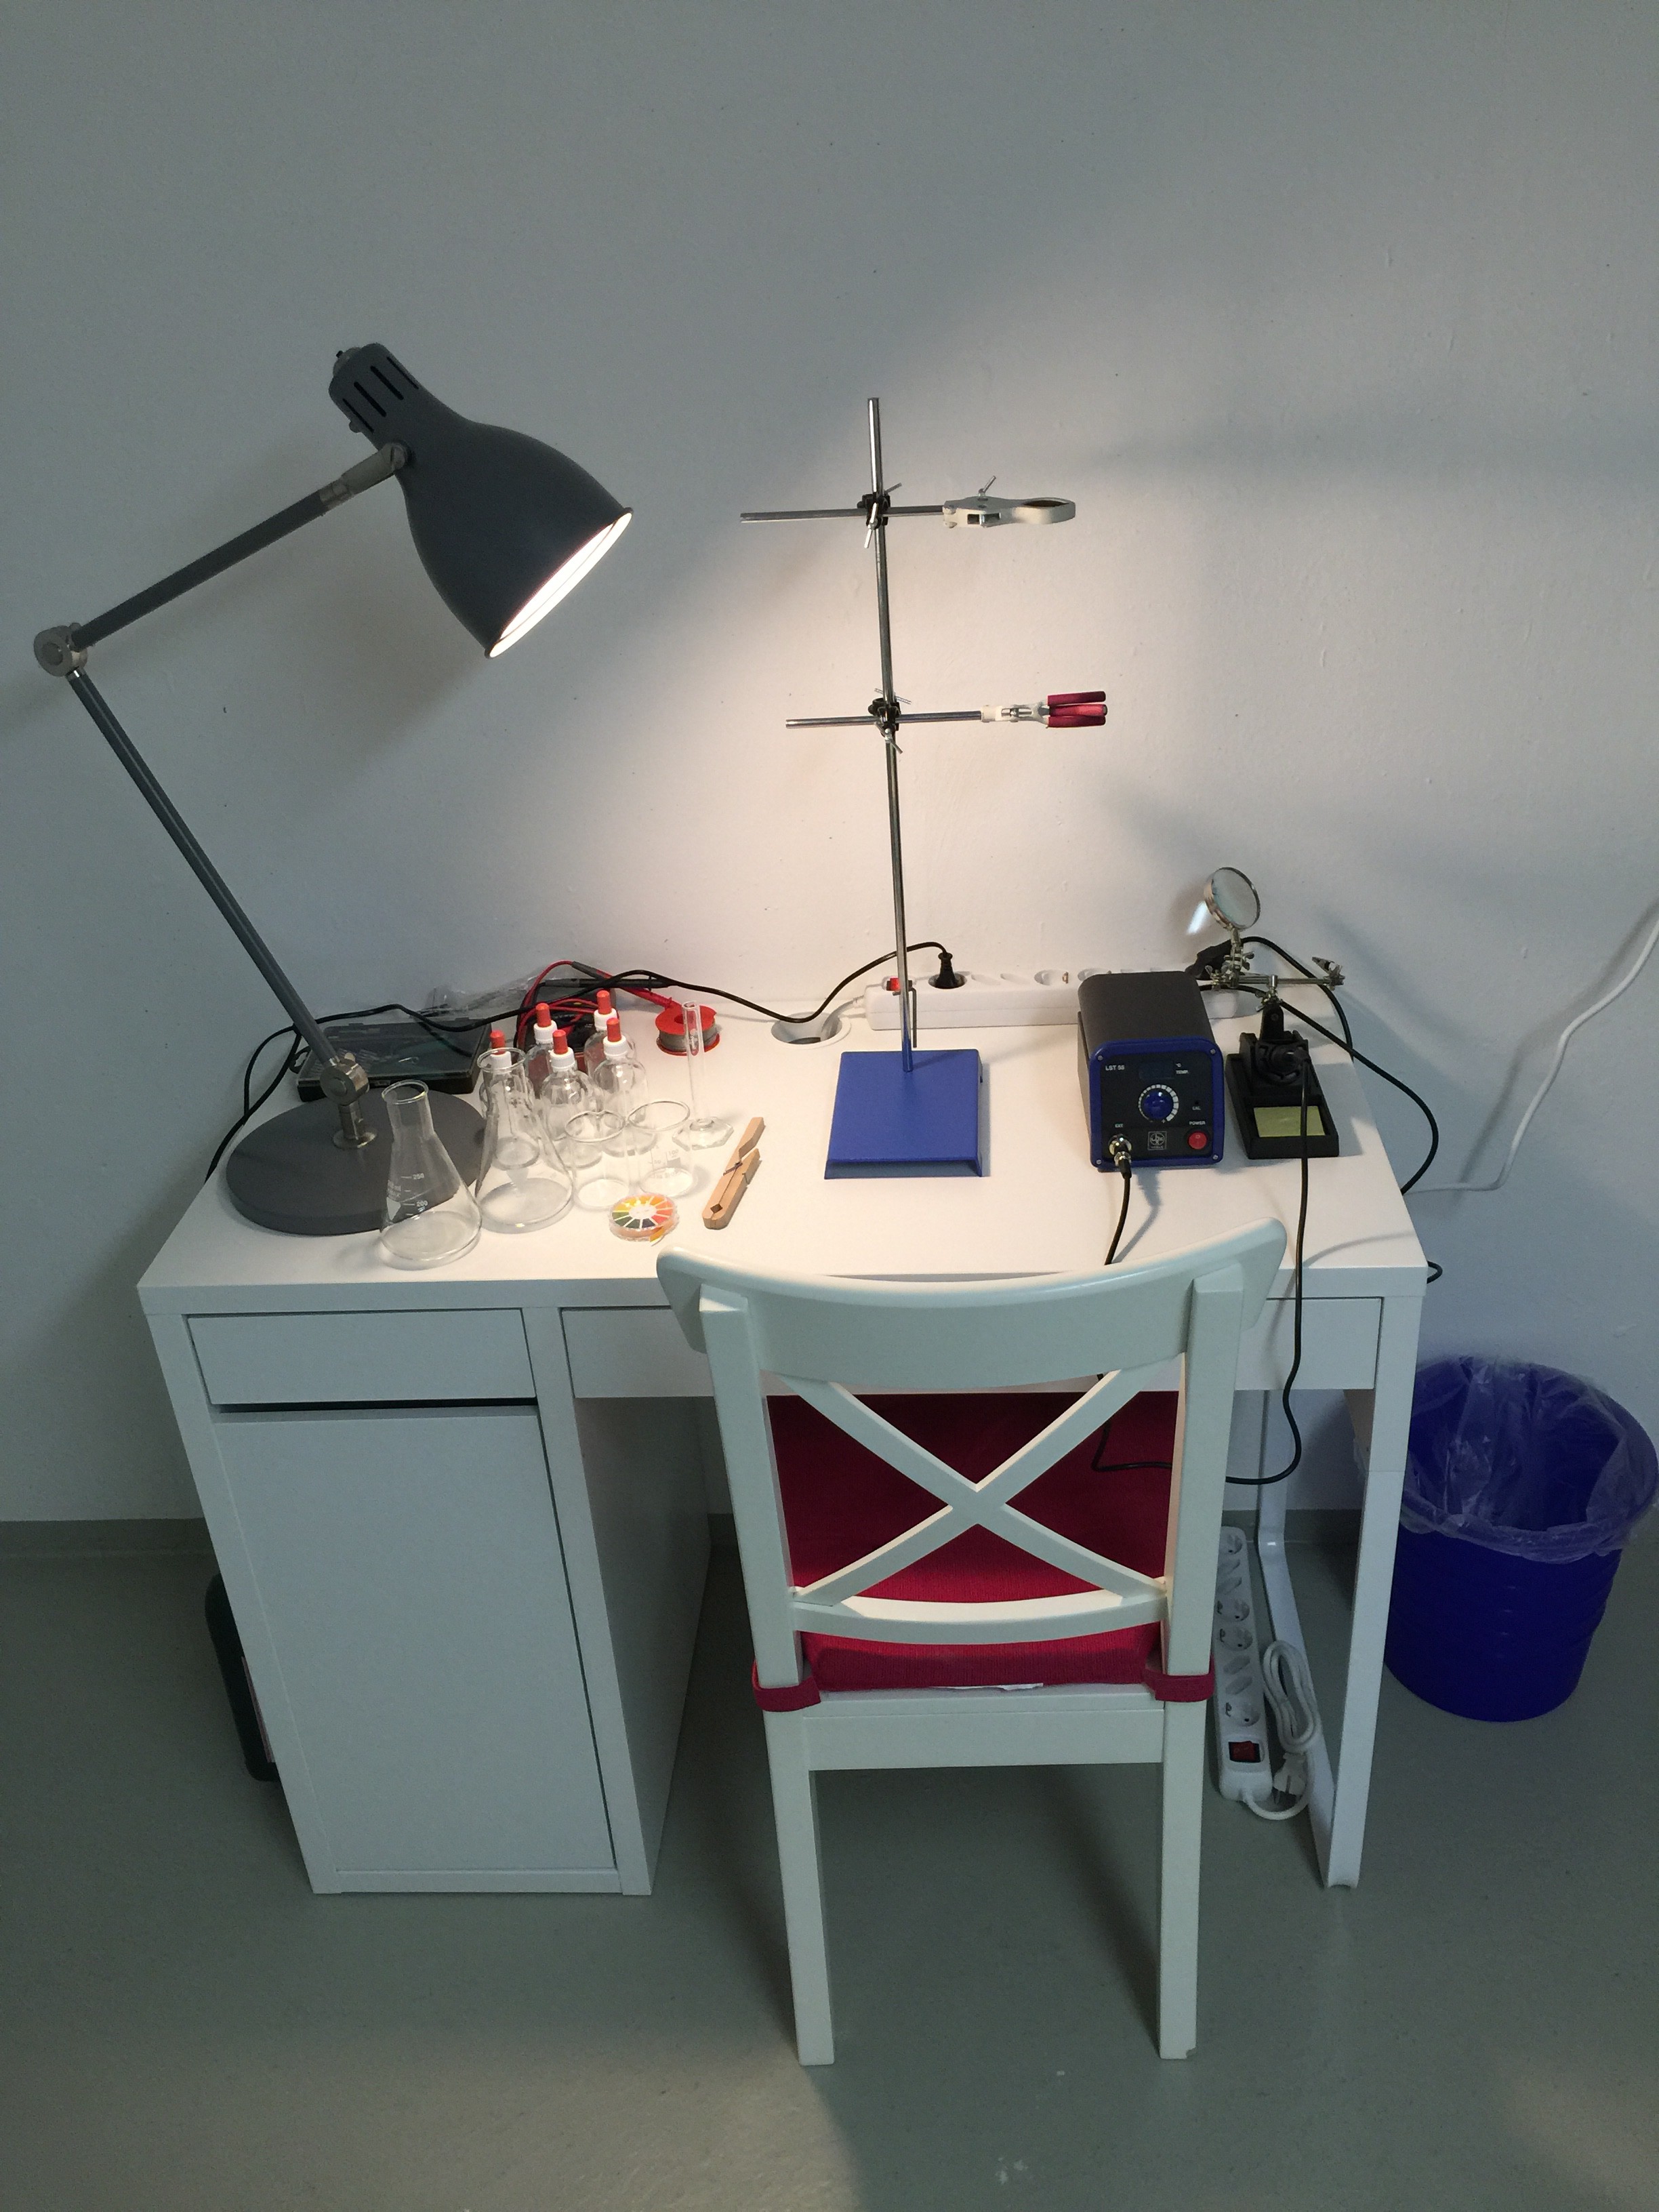
07/21/2015 at 16:48 • 0 commentsI have been busy moving to Germany after nearly 9 years residence in China. I have rent a house and just started to build up a new chemistry and electronic lab in the basement to continue with my medical tricorder project. Picture below shows the lab (WIP):
-
New shield
05/28/2015 at 06:47 • 0 commentsI decided to design a new shield including the spectrophotometer beside some small modifications like gain control for the respiration sensor and a gas sensor to analyze the exhalation gases . After the shield and spectrophotometer is finished, I will focus on software and wetware for the tricorder. Things will slow down a bit as I will soon move to Germany with my family and I have to leave all my equipment and my chemistry lab here in China.
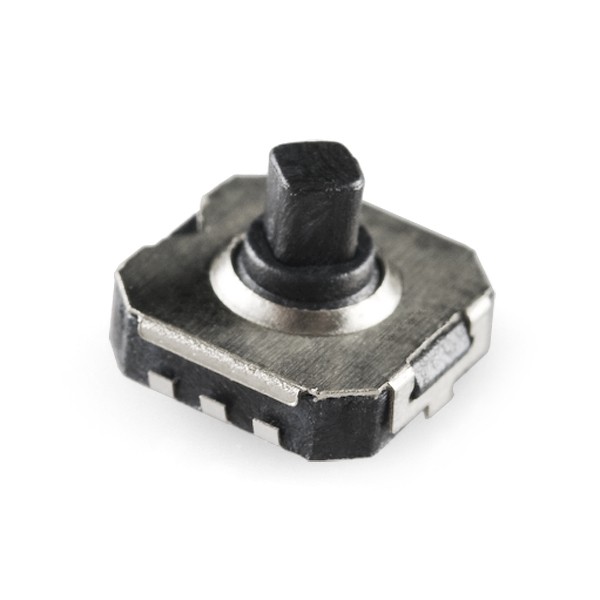
To save place, the push button interface had to be removed. I am using a joystick-like interface in a very small package instead:
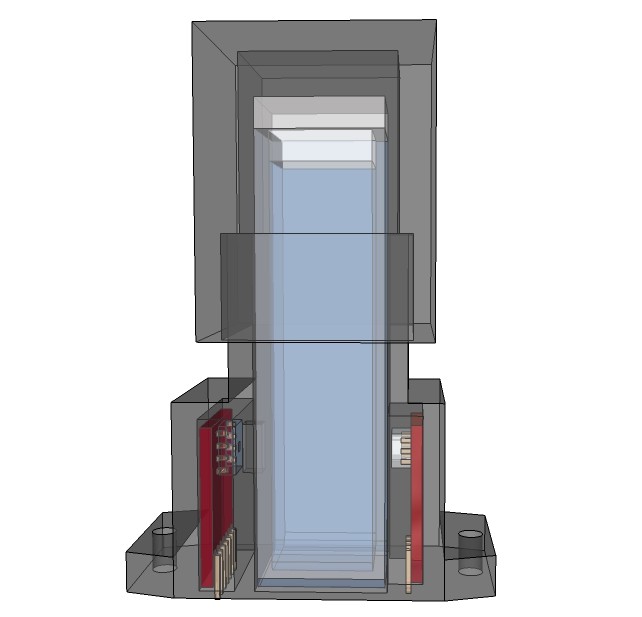
X-ray view of the spectrophotometer:![]()
Partly routed shield:![]()
![]()
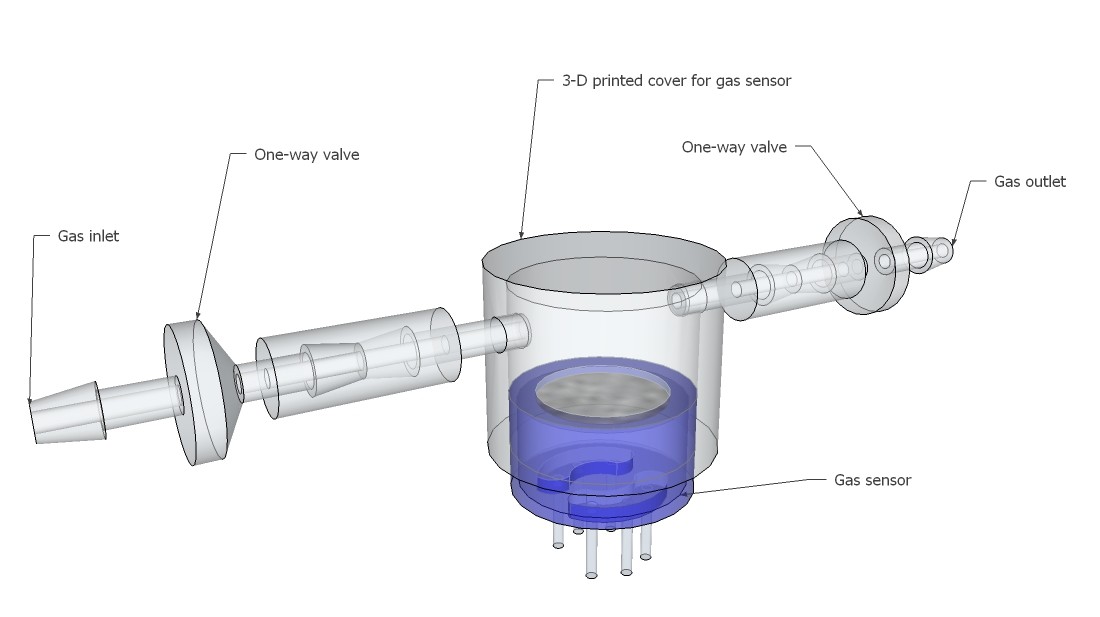
One reason why I am using a respirator- half-mask for the respiration rate sensor is that I am able to do a analysis of the exhalation gases at the same time. This can be done by one or more common available MQ-series gas sensors, which are attached to 3-D printed gas chambers with a predefined volume:
![]()
![]()
-
Spectrophotometer
05/21/2015 at 12:18 • 2 commentsI should have thought about the Beer-Lambert Law earlier!
where
- A: Absorbance or optical density OD of the wave length λ
- I_0: Intensity of light that is incident on the sample [W·m^(−2)]
- I_1: Intensity of light that is transmitted by the sample [W·m^(−2)]
- ε: Molar extinction coefficient of the wave length λ [L·mol^(–1)·cm^(–1)]
- c: Concentration [mol/L]
- l: Length of the light path through the sample, usually 1 cm
Spectrophotometers are commonly used to measure the concentration of a solution from its light absorbing properties. Some other examples of how they are used include:
- Water quality - Turbidity, chlorine content, pH, water hardness, phosphate content etc
- Microbial population growth - Turbidity of a microbial culture over time
- Enzyme kinetics - Activity of an enzyme over time
For RGB spectrophotometry we can use a RGB LED and the TCS3200 color sensor, which output is a square wave (50% duty cycle) with frequency directly proportional to light intensity.
Proposed design, directly mountable on a PCB (complete copper fill without traces on both layers of the board in the area of the cuvette bottom to avoid exposure to light through the PCB):
![]()
As initially mentioned one use of the spectrophotometer is to determinate microbial population growth. How we do that? Let's start with a exponential bacteria growth model. Let donate the increase in cells numbers ΔN per time interval Δt, then this ratio is proportional to the actual number of cells N. If for example a population of 10000 cells produces 1000 new cells per hour, a 3 times bigger population of the same microorganism will produce 3000 new cells per hour.
Written as a differential:
Using a proportionality factor μ < 0, which is called specific growth rate, yields to the first-order ordinary differential equation:
Separating the variables
Integrating both sides
Determining the integration constant C using the initial condition t = 0:
Substituting C in equation (6):
Solving for N:
Let donate the generation time tg, where exactly
the equation (8) yields
Now, the optical density or in this case more correctly the turbidity is directly proportional to the cell density. However, the proportionality between the optical density OD and the cell density exists only for OD ≤ 0.4.
The cell density [cells/mL or cells/L] is given by
where N_sample is a proportion of the total cell number N and V_sample a proportion of the total culture volume V.
Hence, equation (9) can be written as
Using a proportionality factor a equation (11) yields
Once the proportionality factor a is determined, we can calculate the cell density from any measured OD.
If we just want to calculate the specific growth rate μ of the bacterium, we don't need a proportionality factor at all. Let donate OD_0 as the optical density at t = 0, then
Solving for μ:
-
LOC build
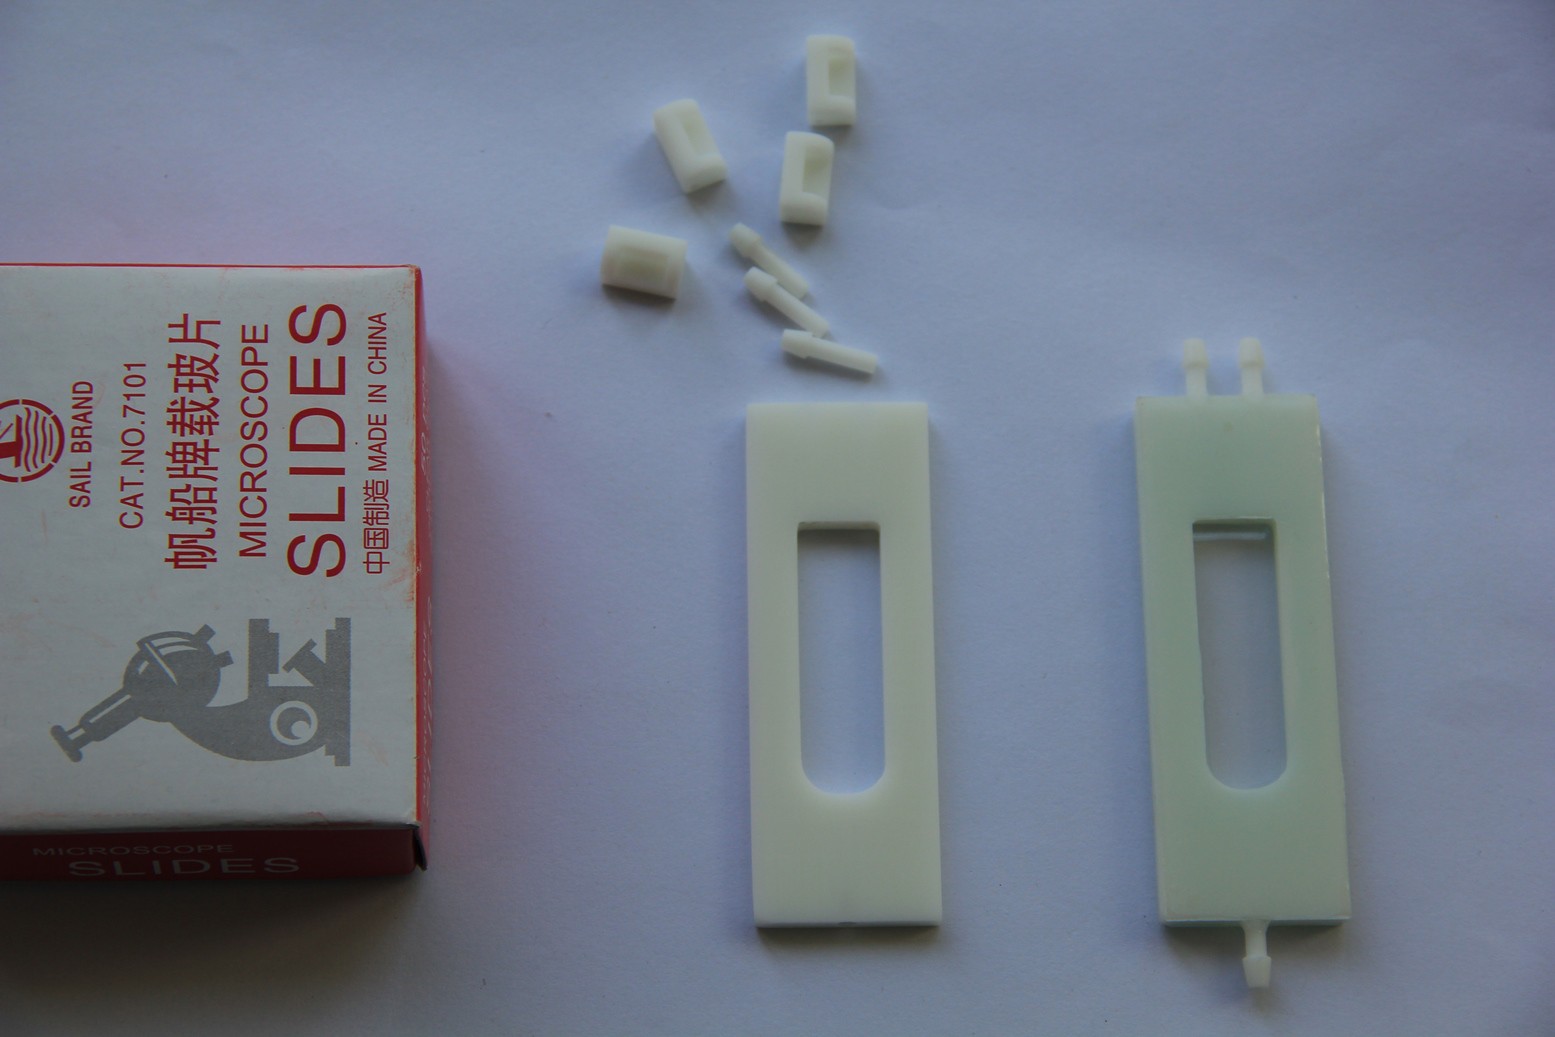
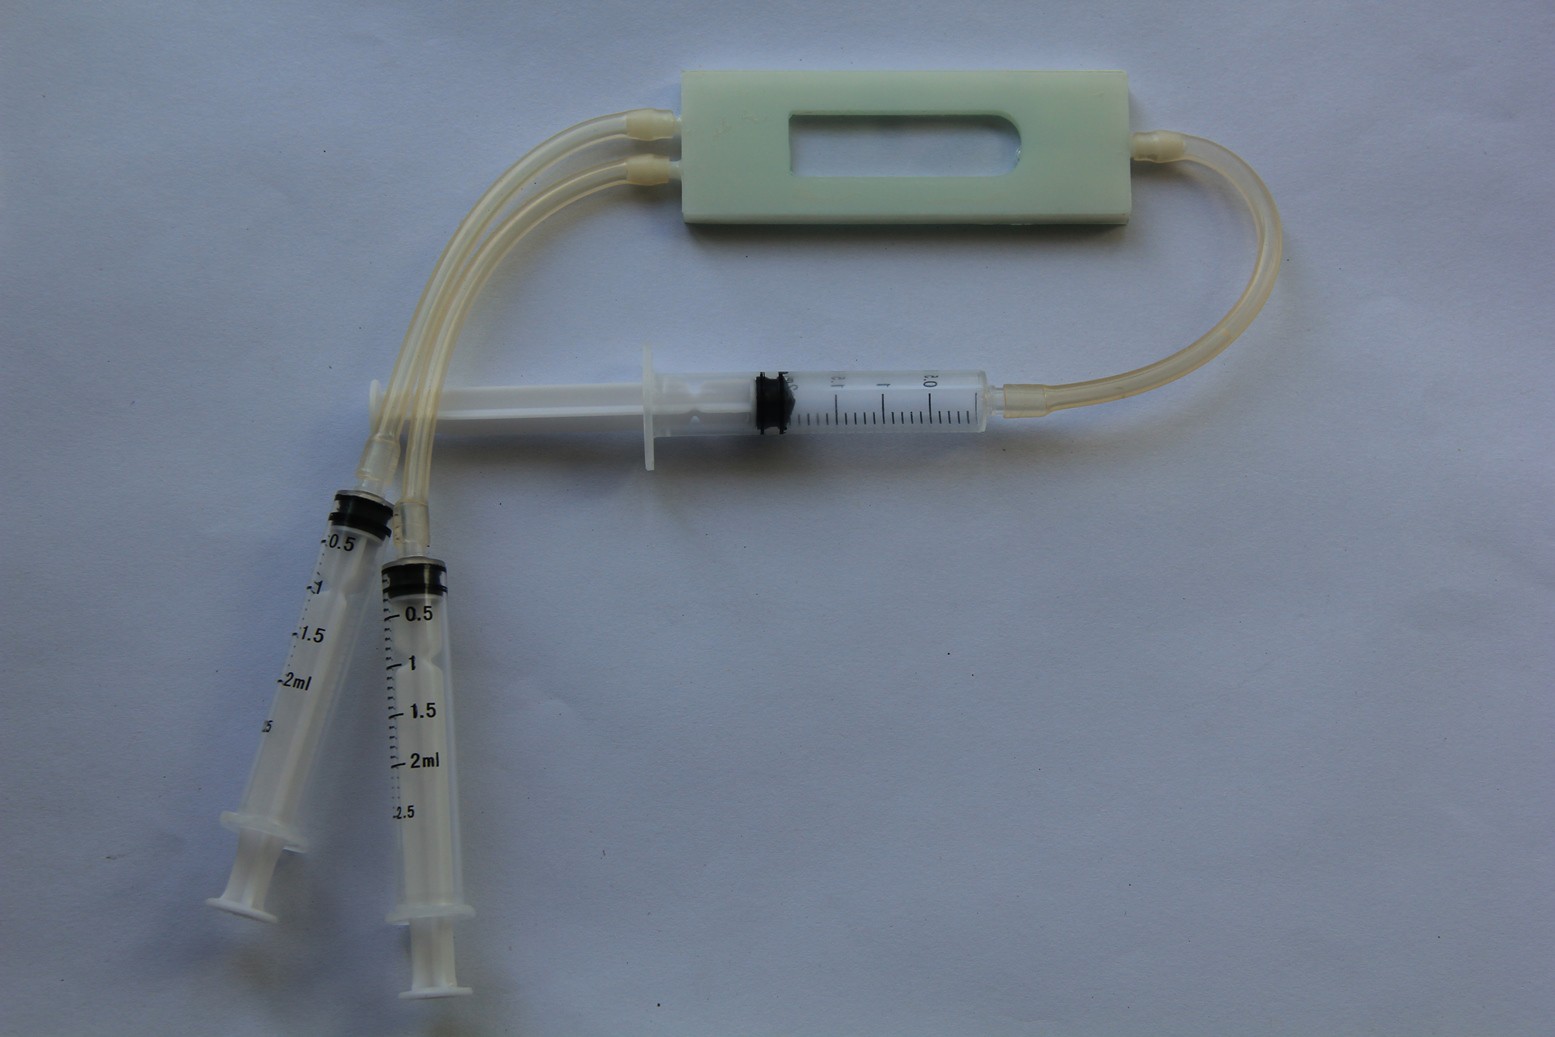
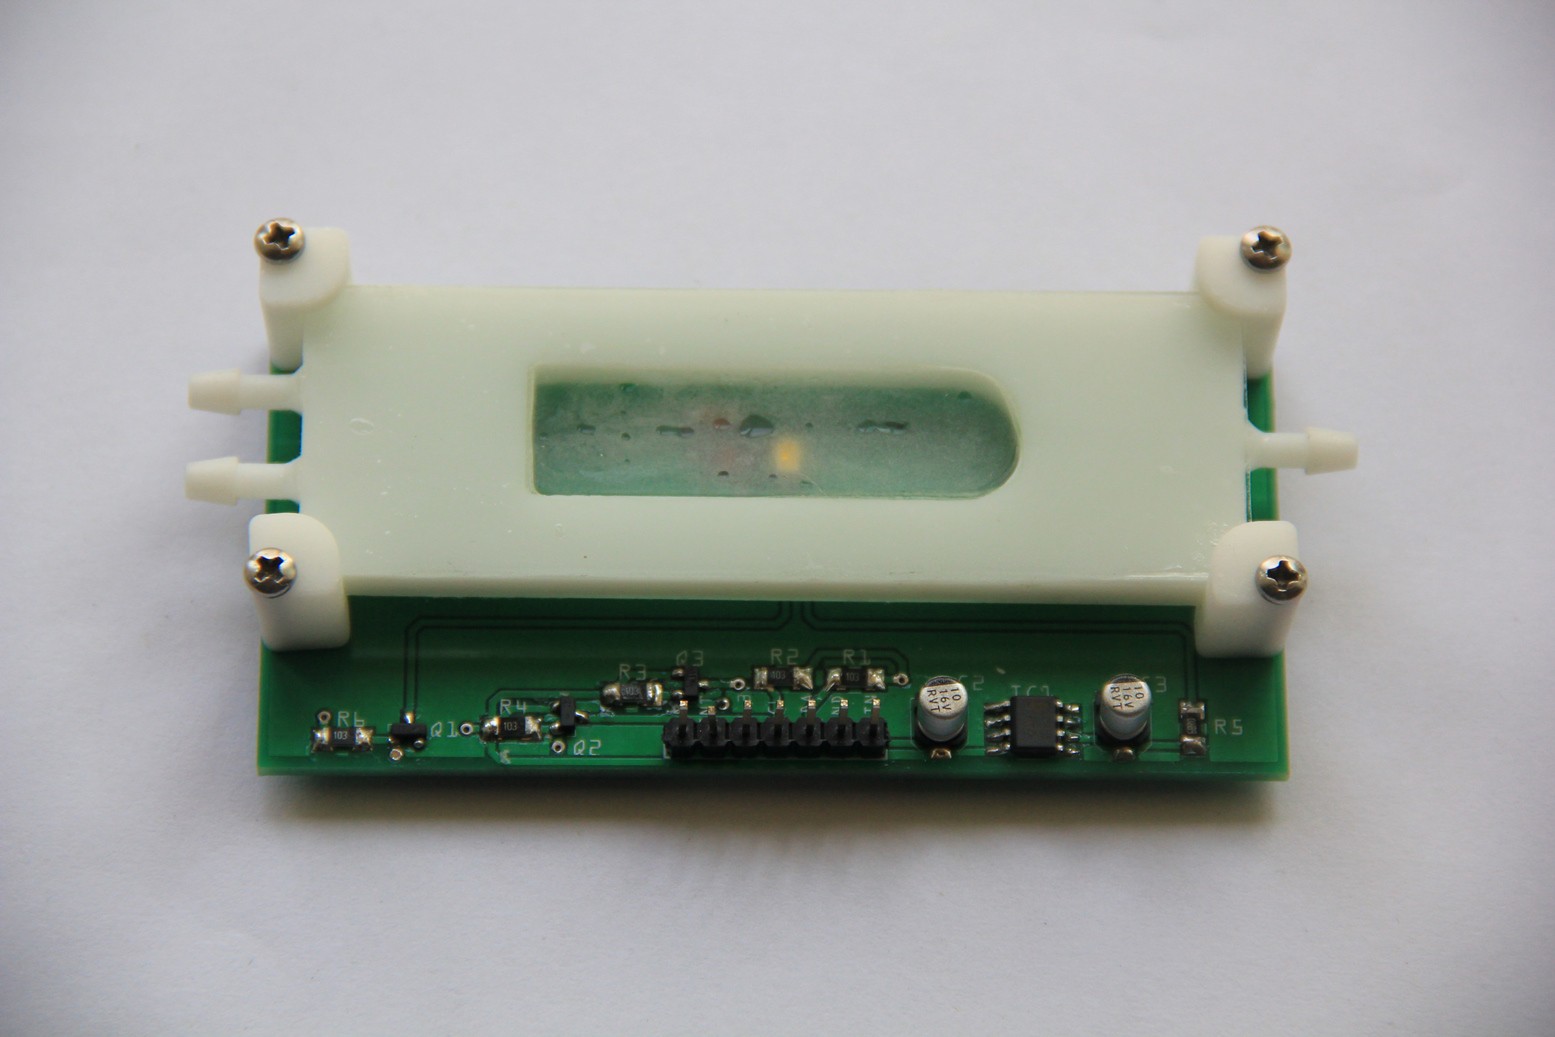
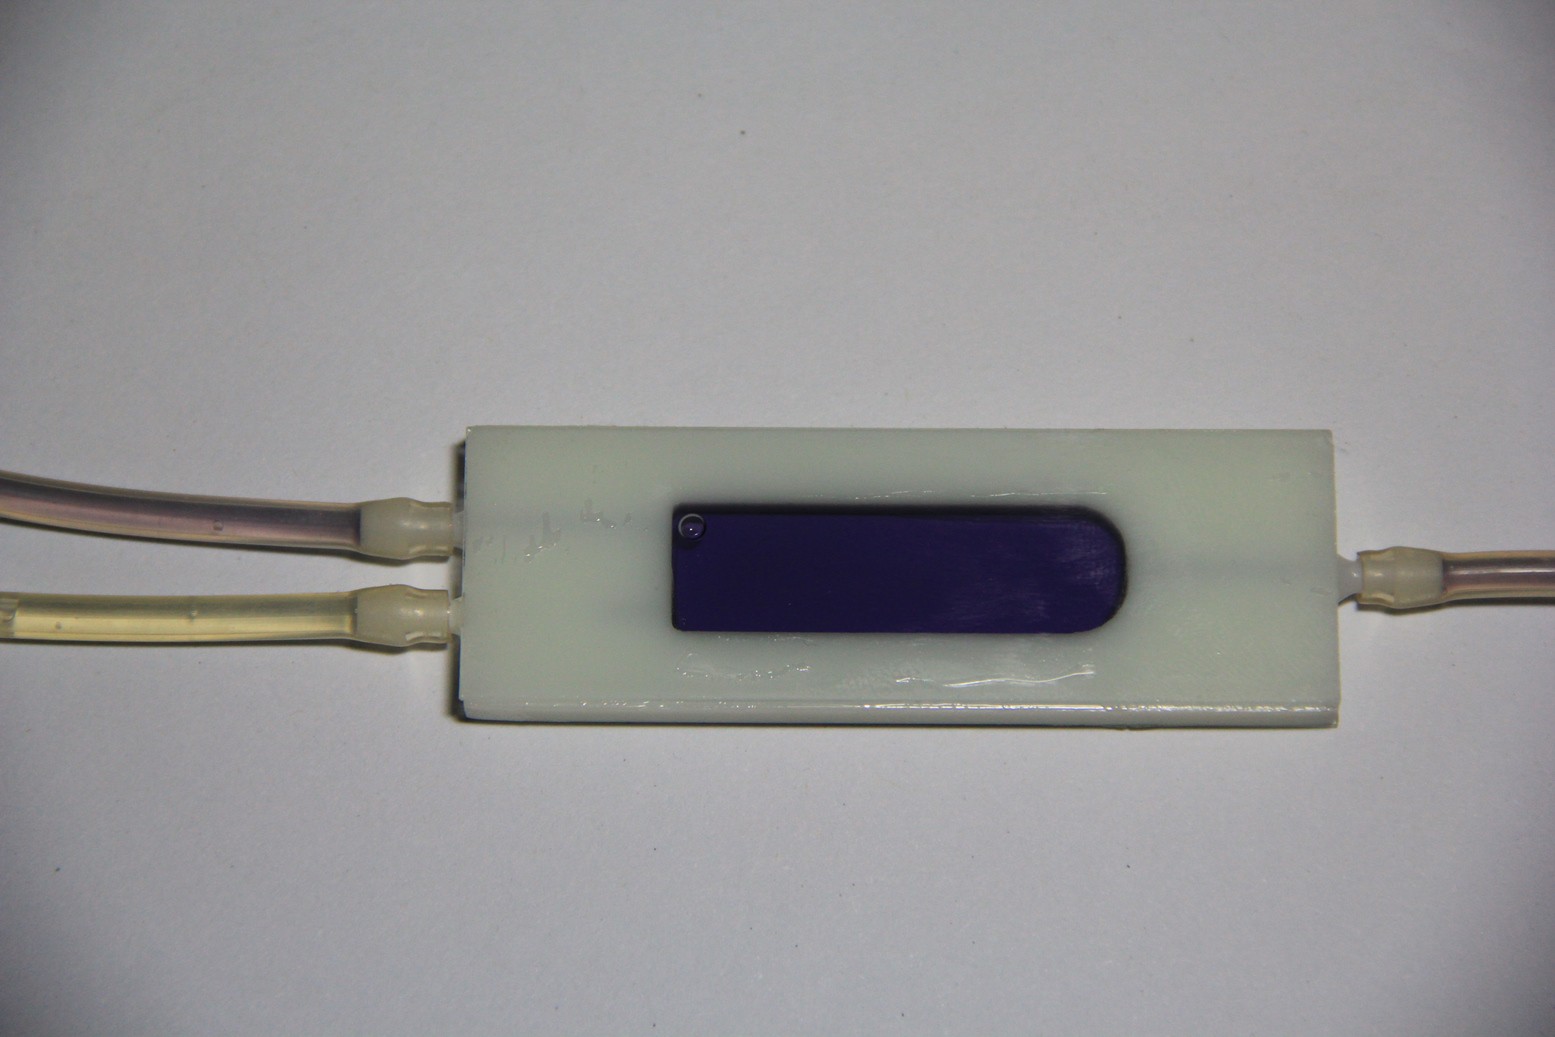
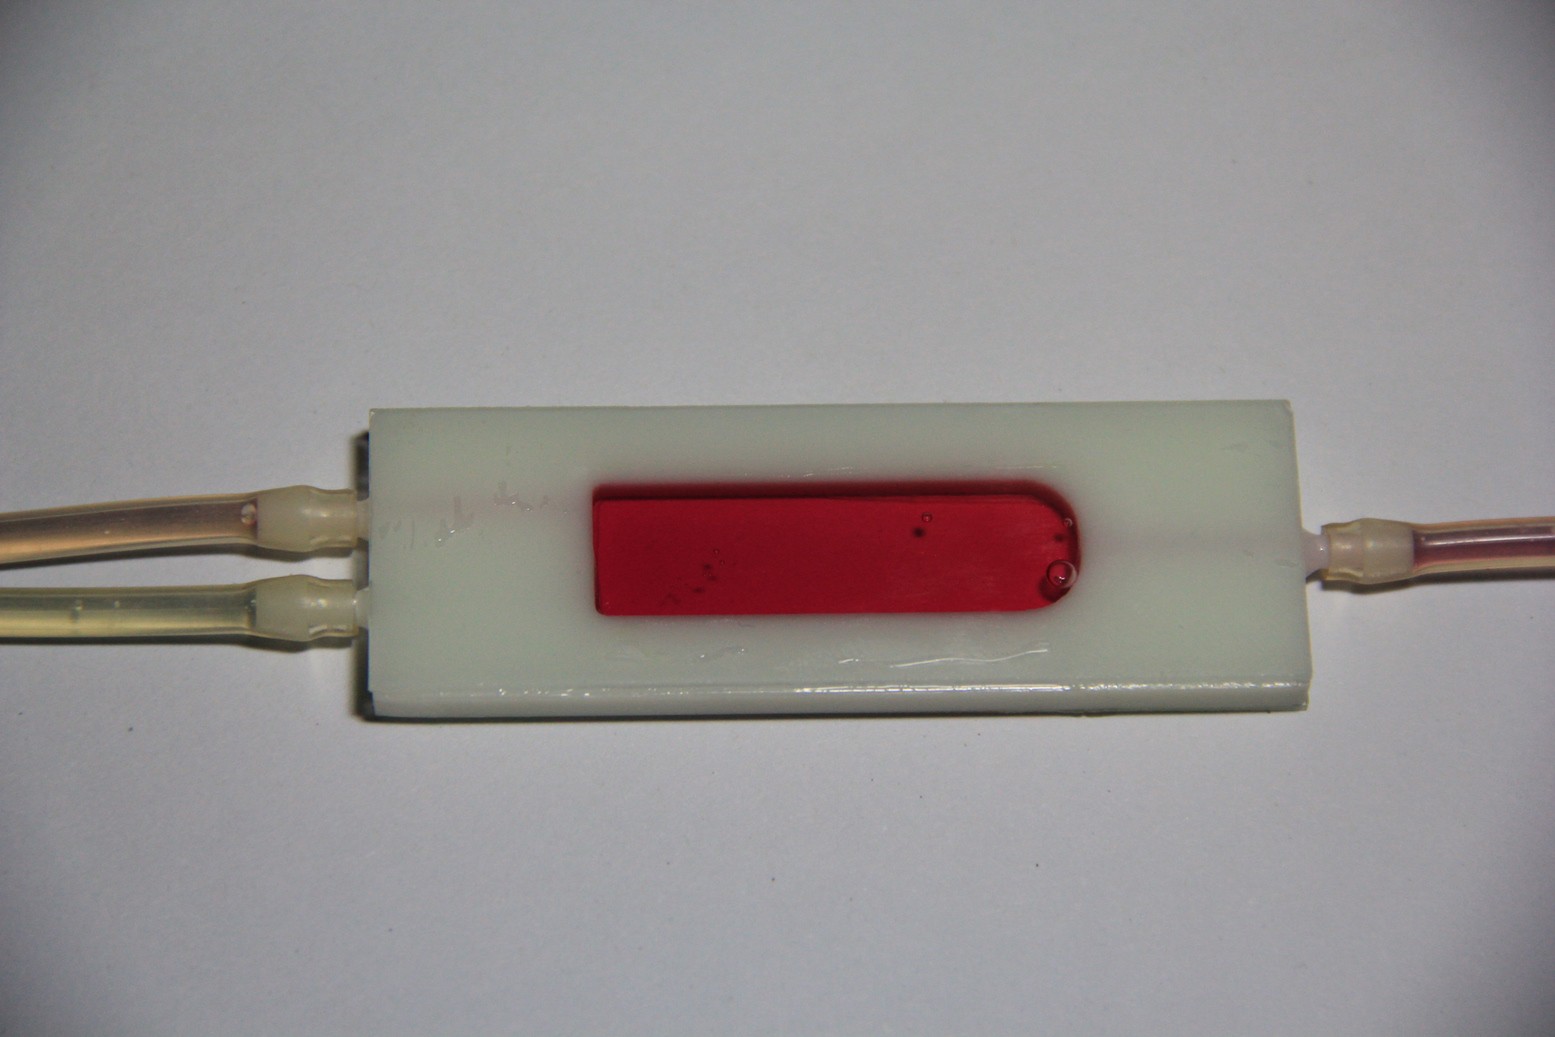
05/16/2015 at 07:04 • 0 commentsMicroscope slides, 3-D printed parts and the finished test-tube-shaped micro reaction chamber. 2-component 5-minutes epoxy resin adhesive has been used to glue the microscope slides and nipples in place:
Leakage test (pass):Populated PCB:
Reaction chamber attached:
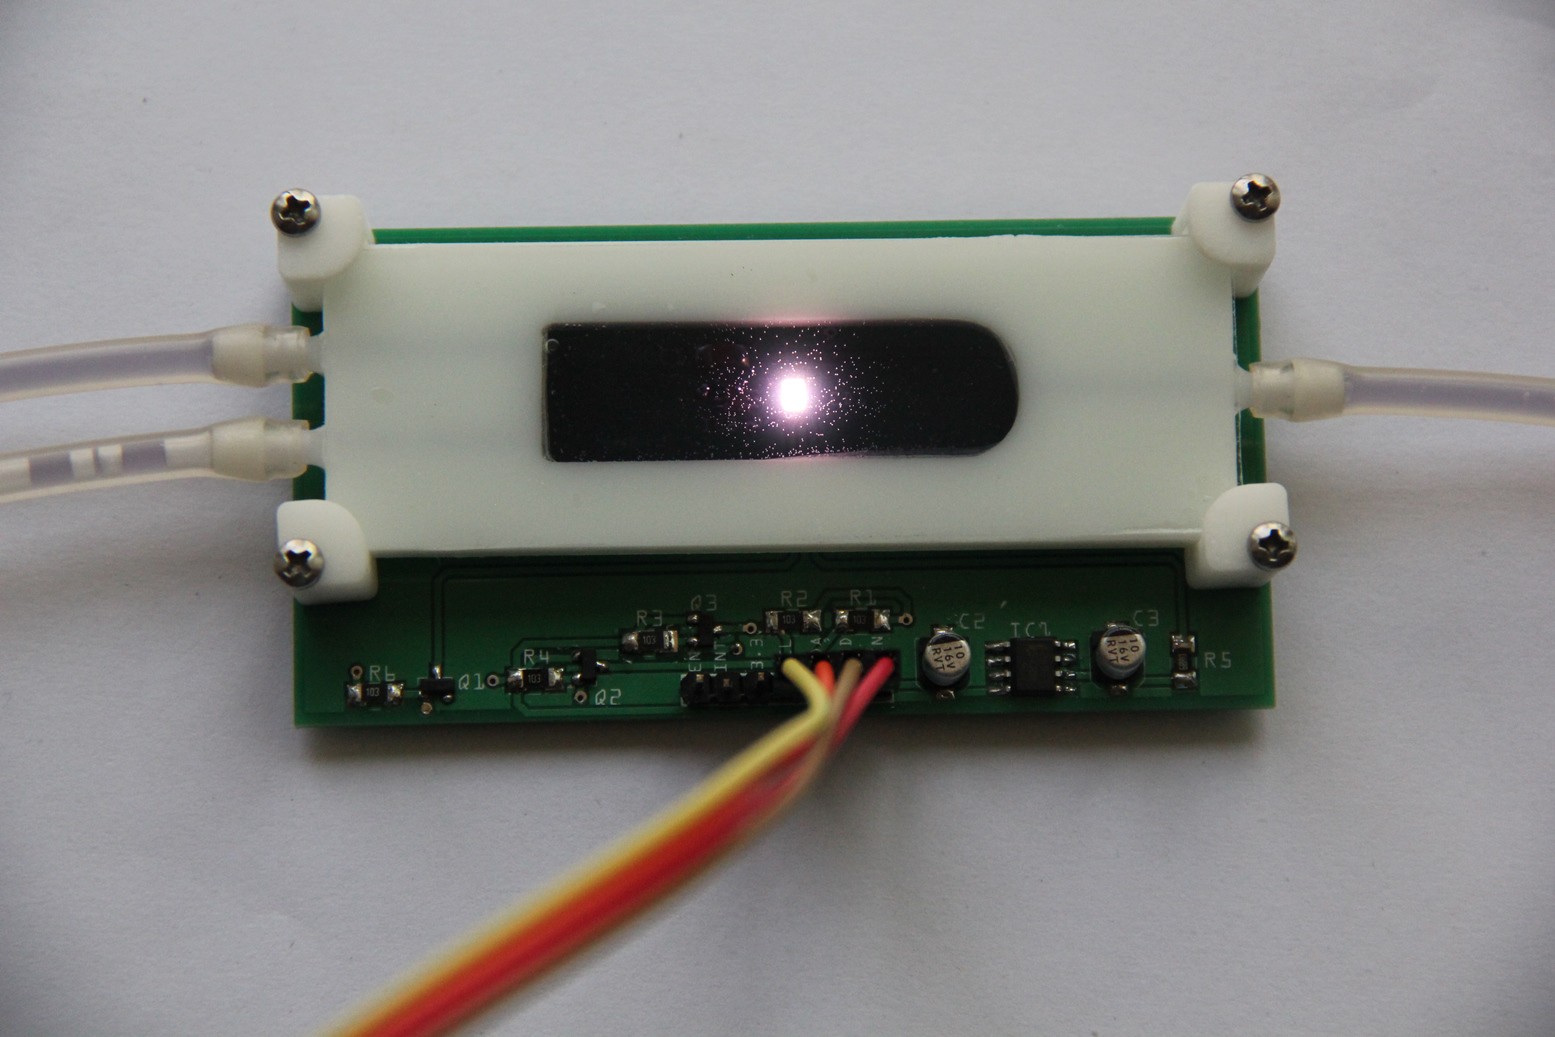
Testing the LoC:
For the first experimental demonstration of the LoC I have used red cabbage indicator. The pH look-up table for the kNN algorithm below was obtained via Color Cop and this image, but initial tests of the TCS34725 color sensor showed that it does not output a reliable RGB color model. I will probably use the raw red/green/blue/clear channel data and work in a 4-dimensional Euclidean space instead. Means also I need to obtain the look-up table for the kNN algorithm by an empirical approach.
pH measurement of urine for instance provides information about the acid-alkali balance in a patient and helps to identify substances that are present in the urine. Maybe other household chemicals or natural chemicals like Cyanidin for pH could be used to test urine for Leukocytes, Glucose (Benedict's reagent ?) as a substitution for urine test strips.
pH
1
2
3
4
5
6
7
8
9
10
11
12
Color
![]()
![]()
![]()
![]()
![]()
![]()
![]()
![]()
![]()
![]()
![]()
![]()
R
239
240
240
229
213
181
107
89
70
13
2
191
G
77
76
100
124
158
142
124
129
124
125
138
216
B
52
101
163
191
213
207
196
191
184
165
134
0
Neutral red cabbage indicator (2 ml):
Acetic acid 5% v/v (1 ml) added:
Medical tricorder
Using artificial intelligence to identify a disease by its symptoms
 M. Bindhammer



 PCB's: