David Scholten
-
Suprise! 3D Printed Spectrum Plot!
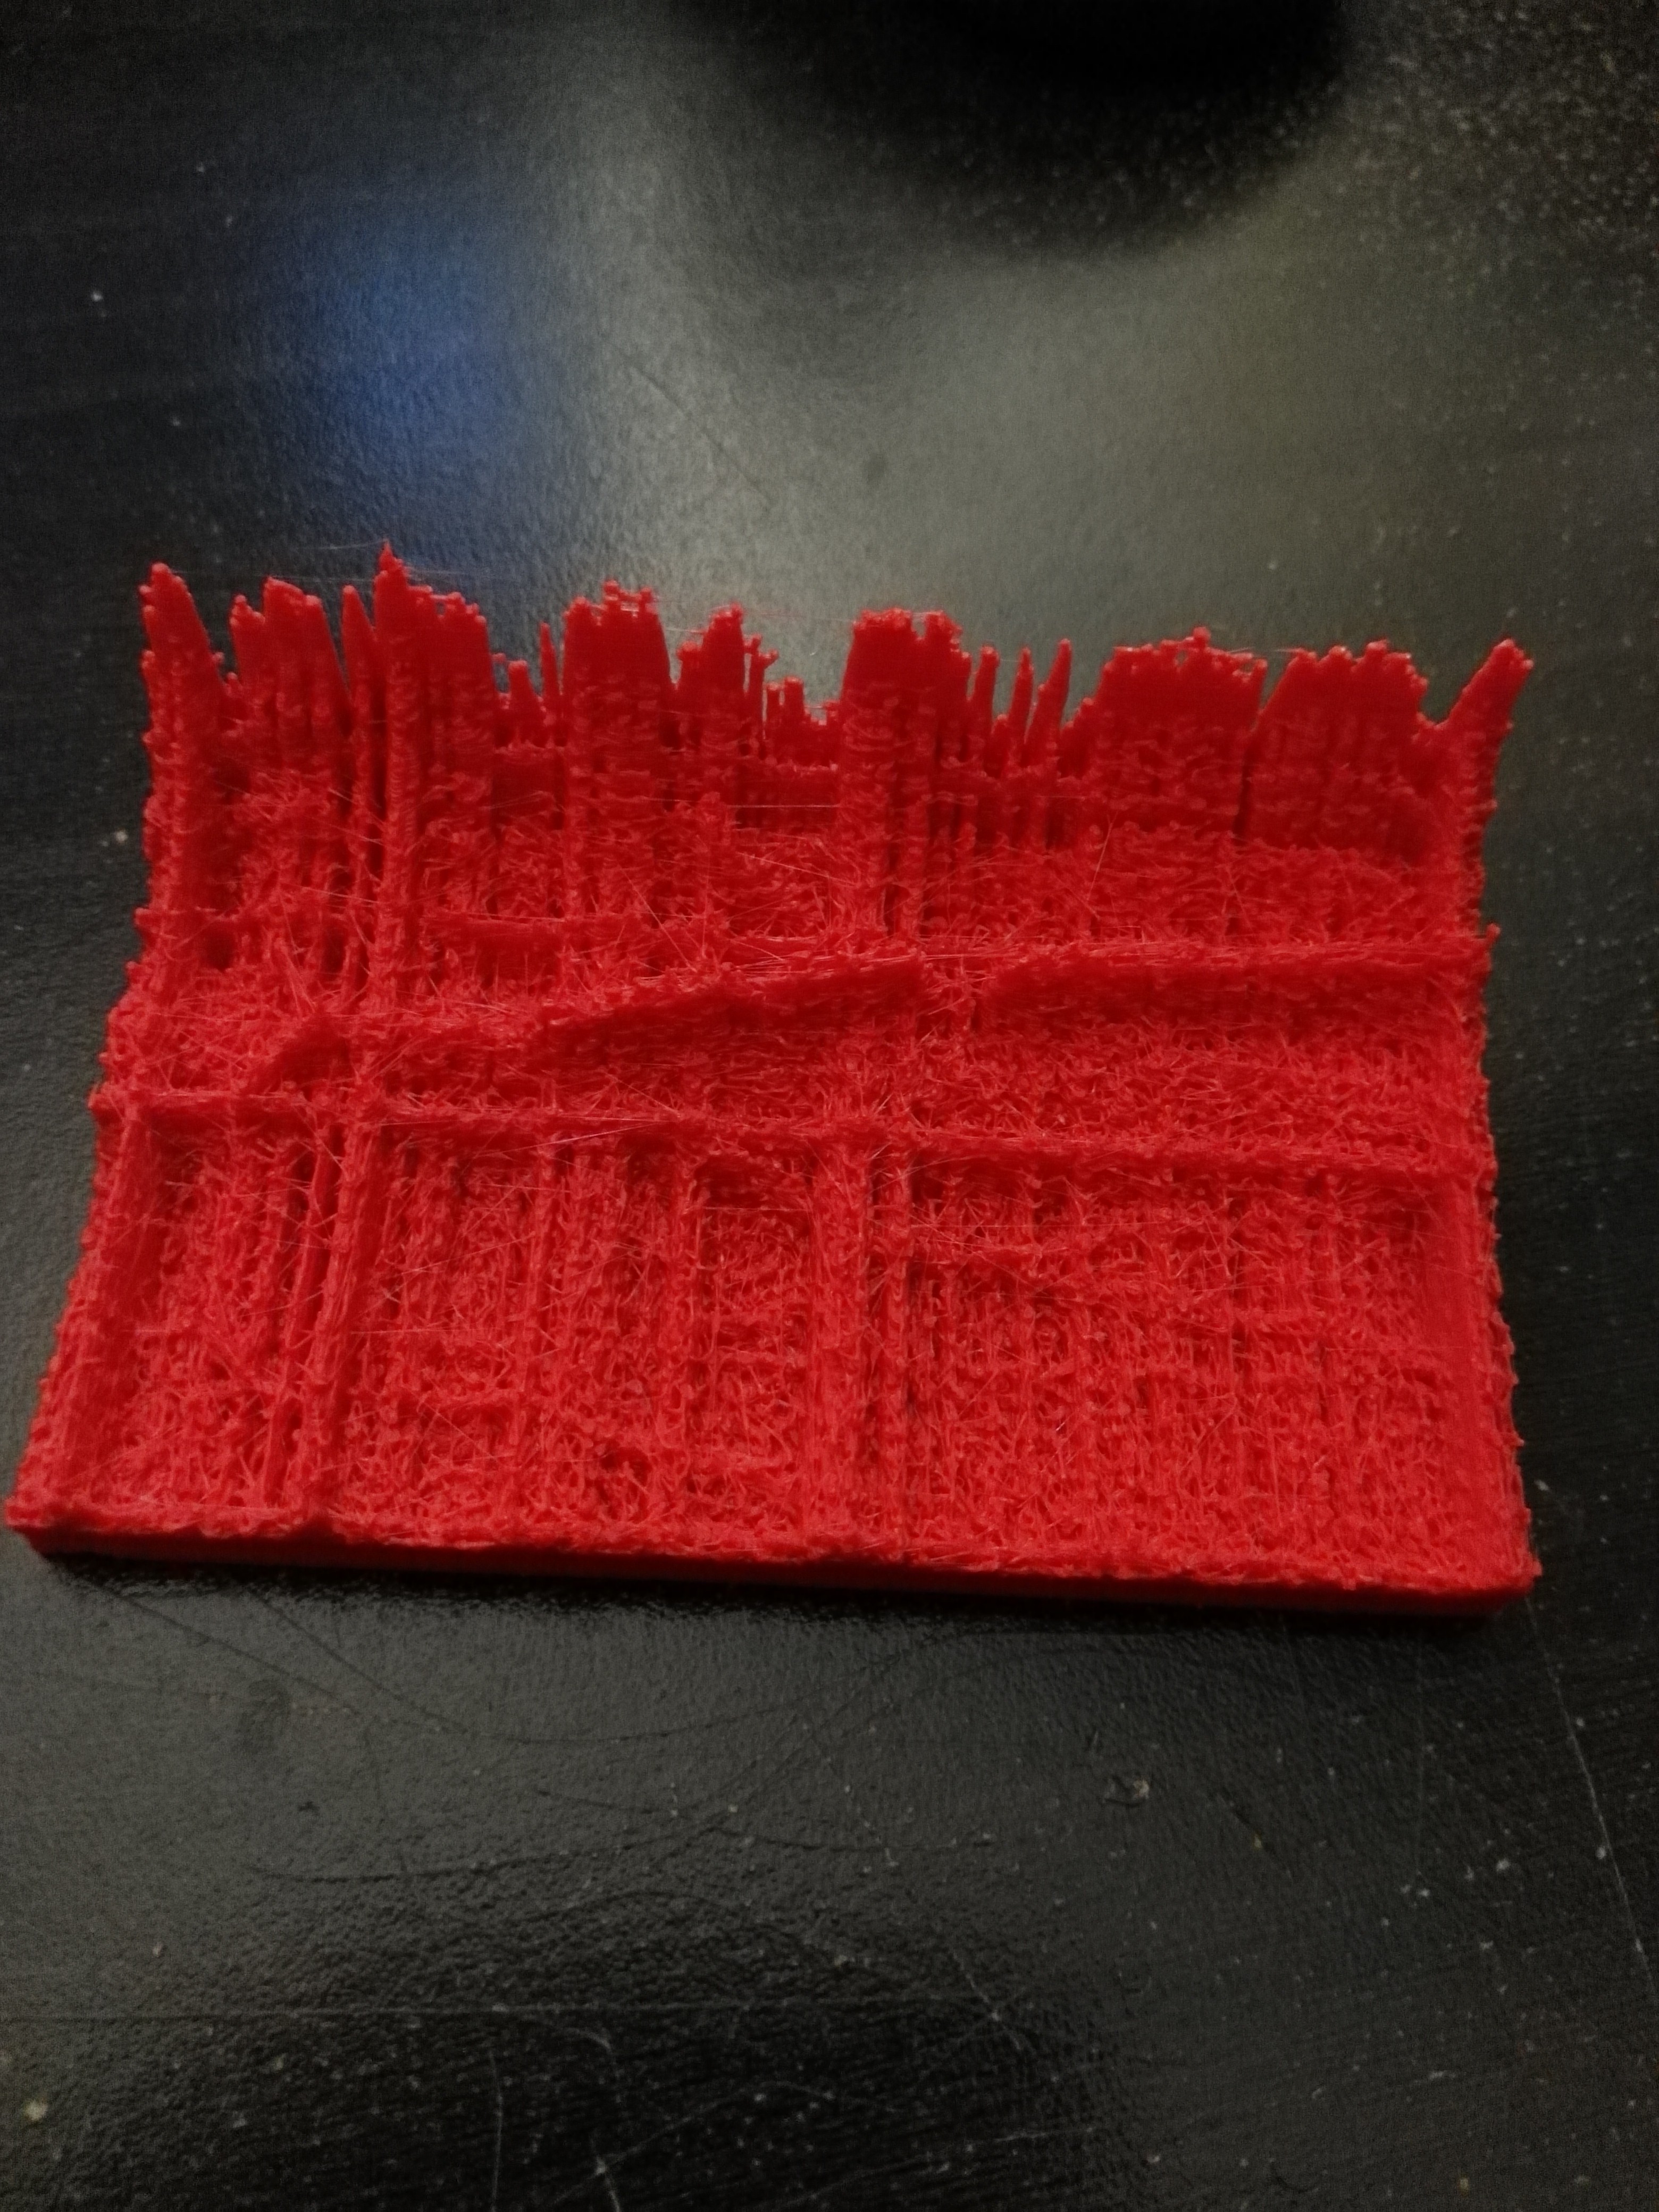
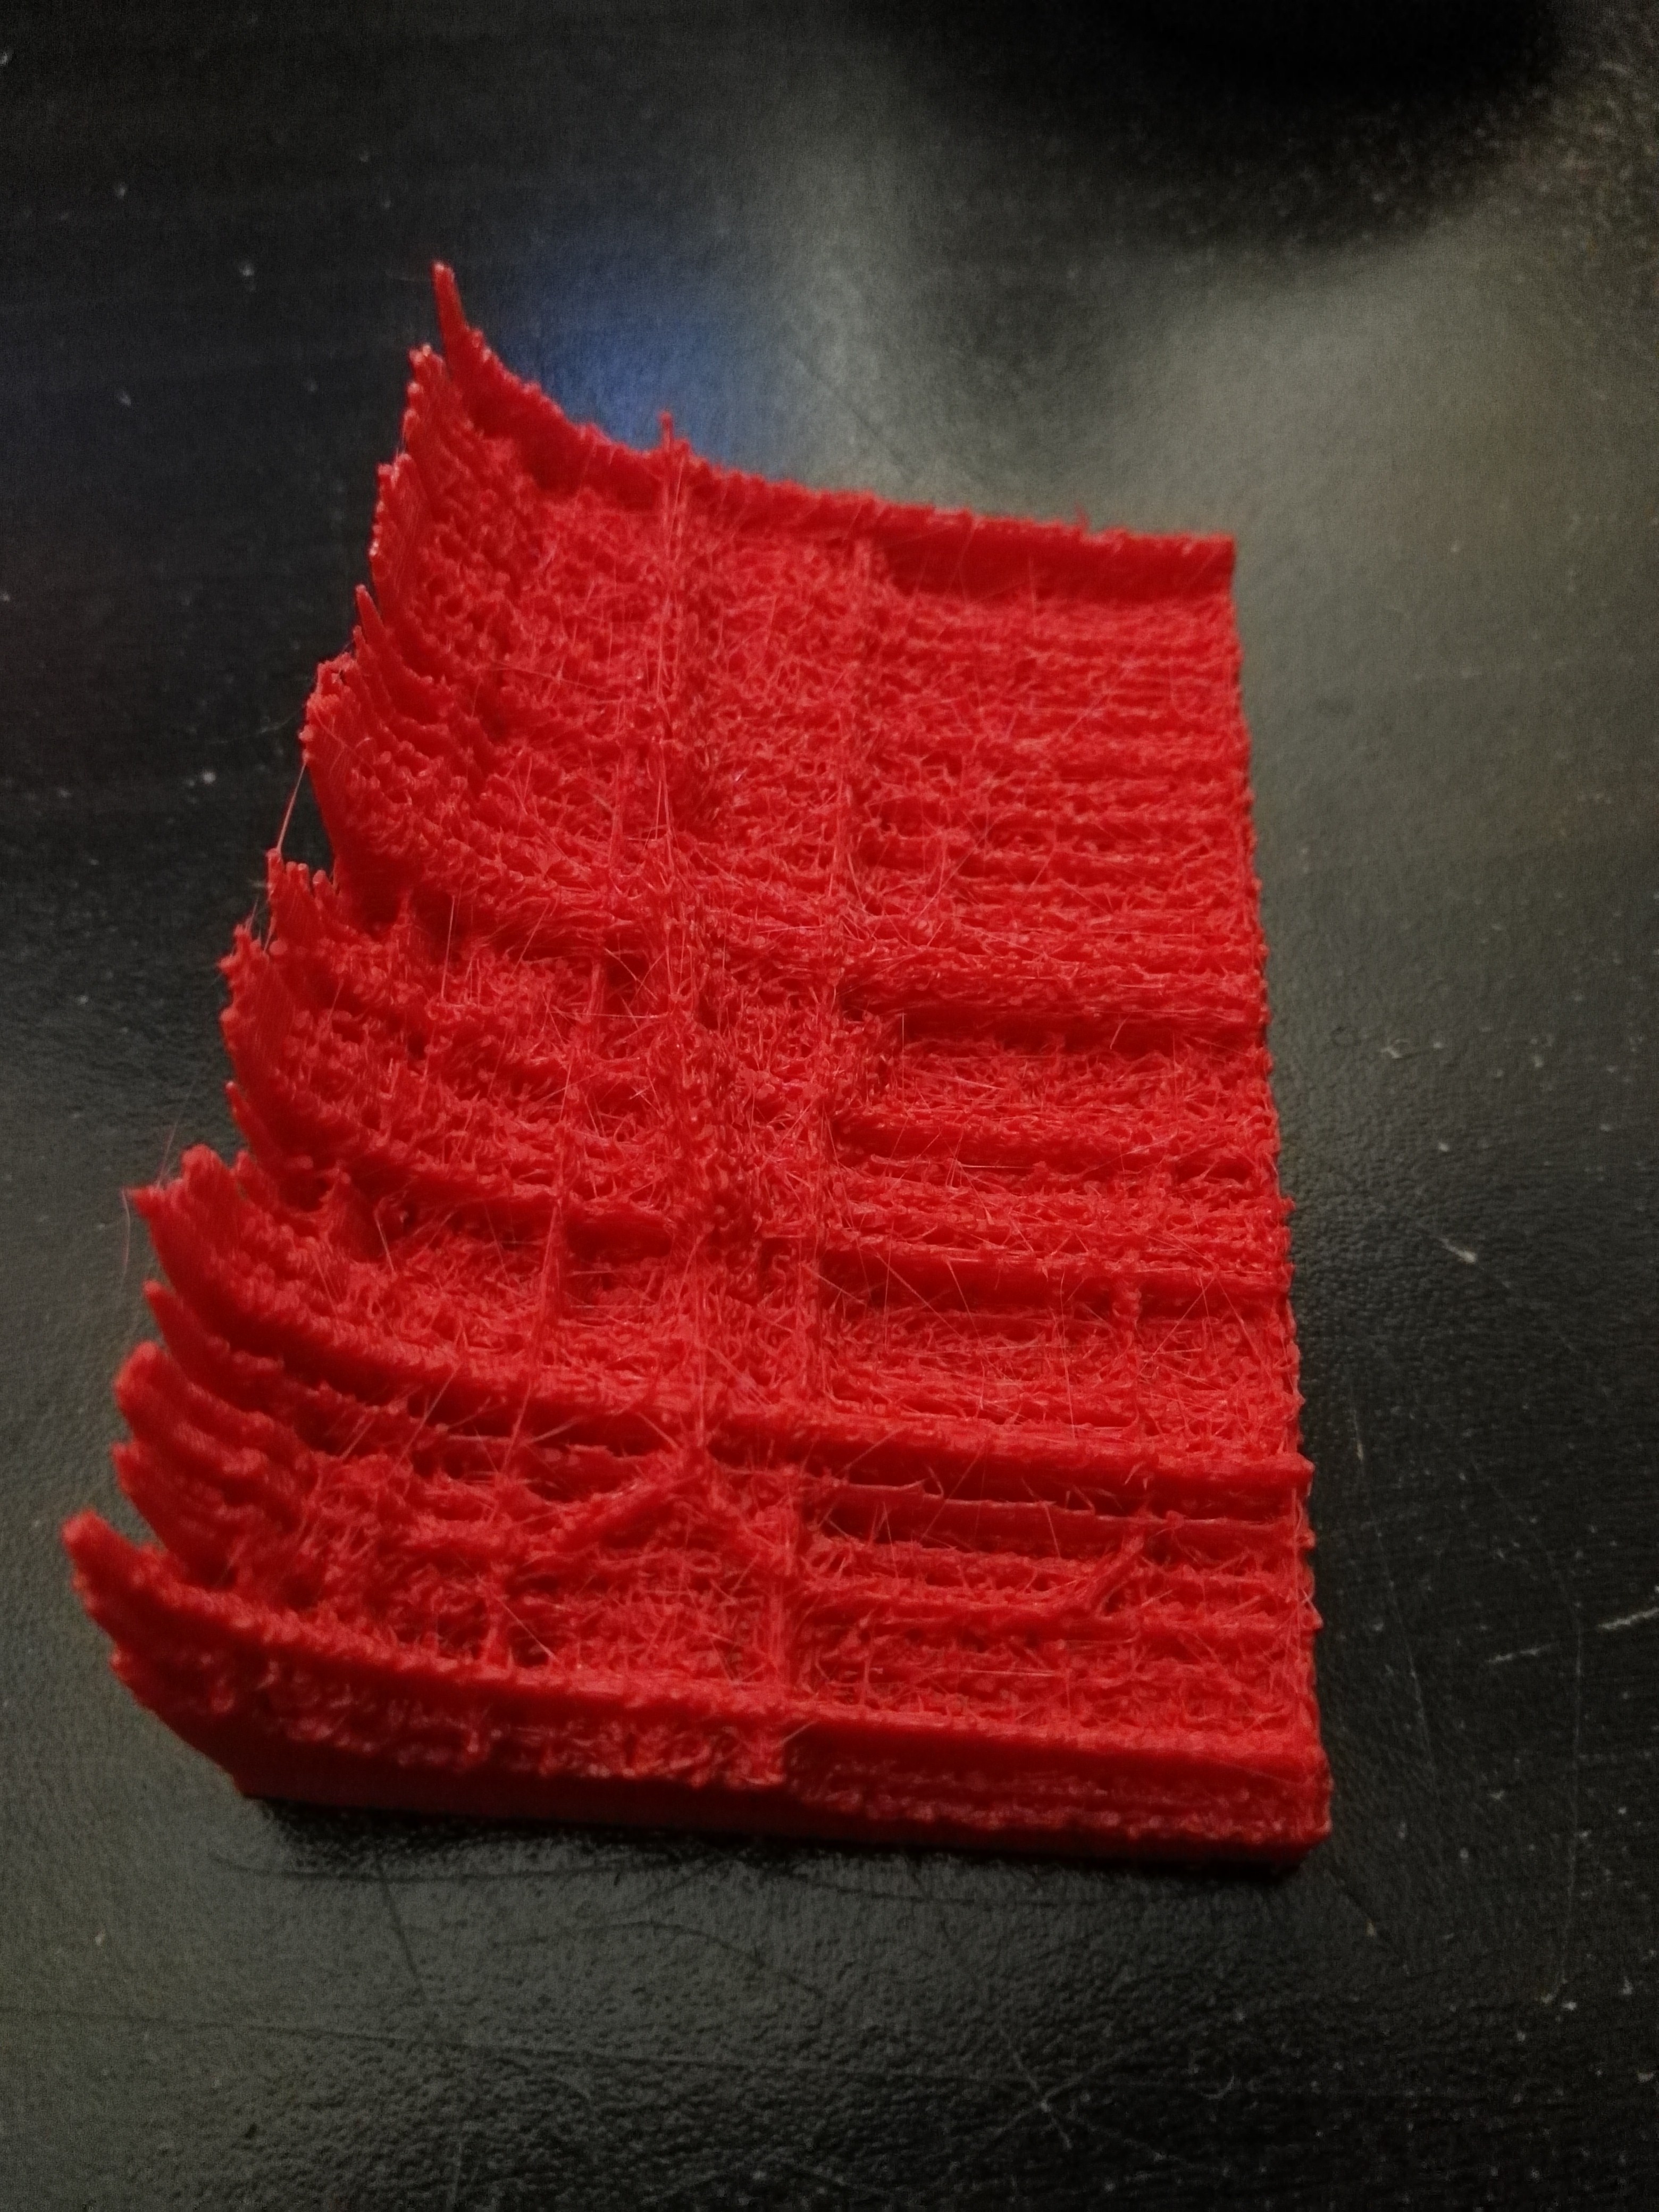
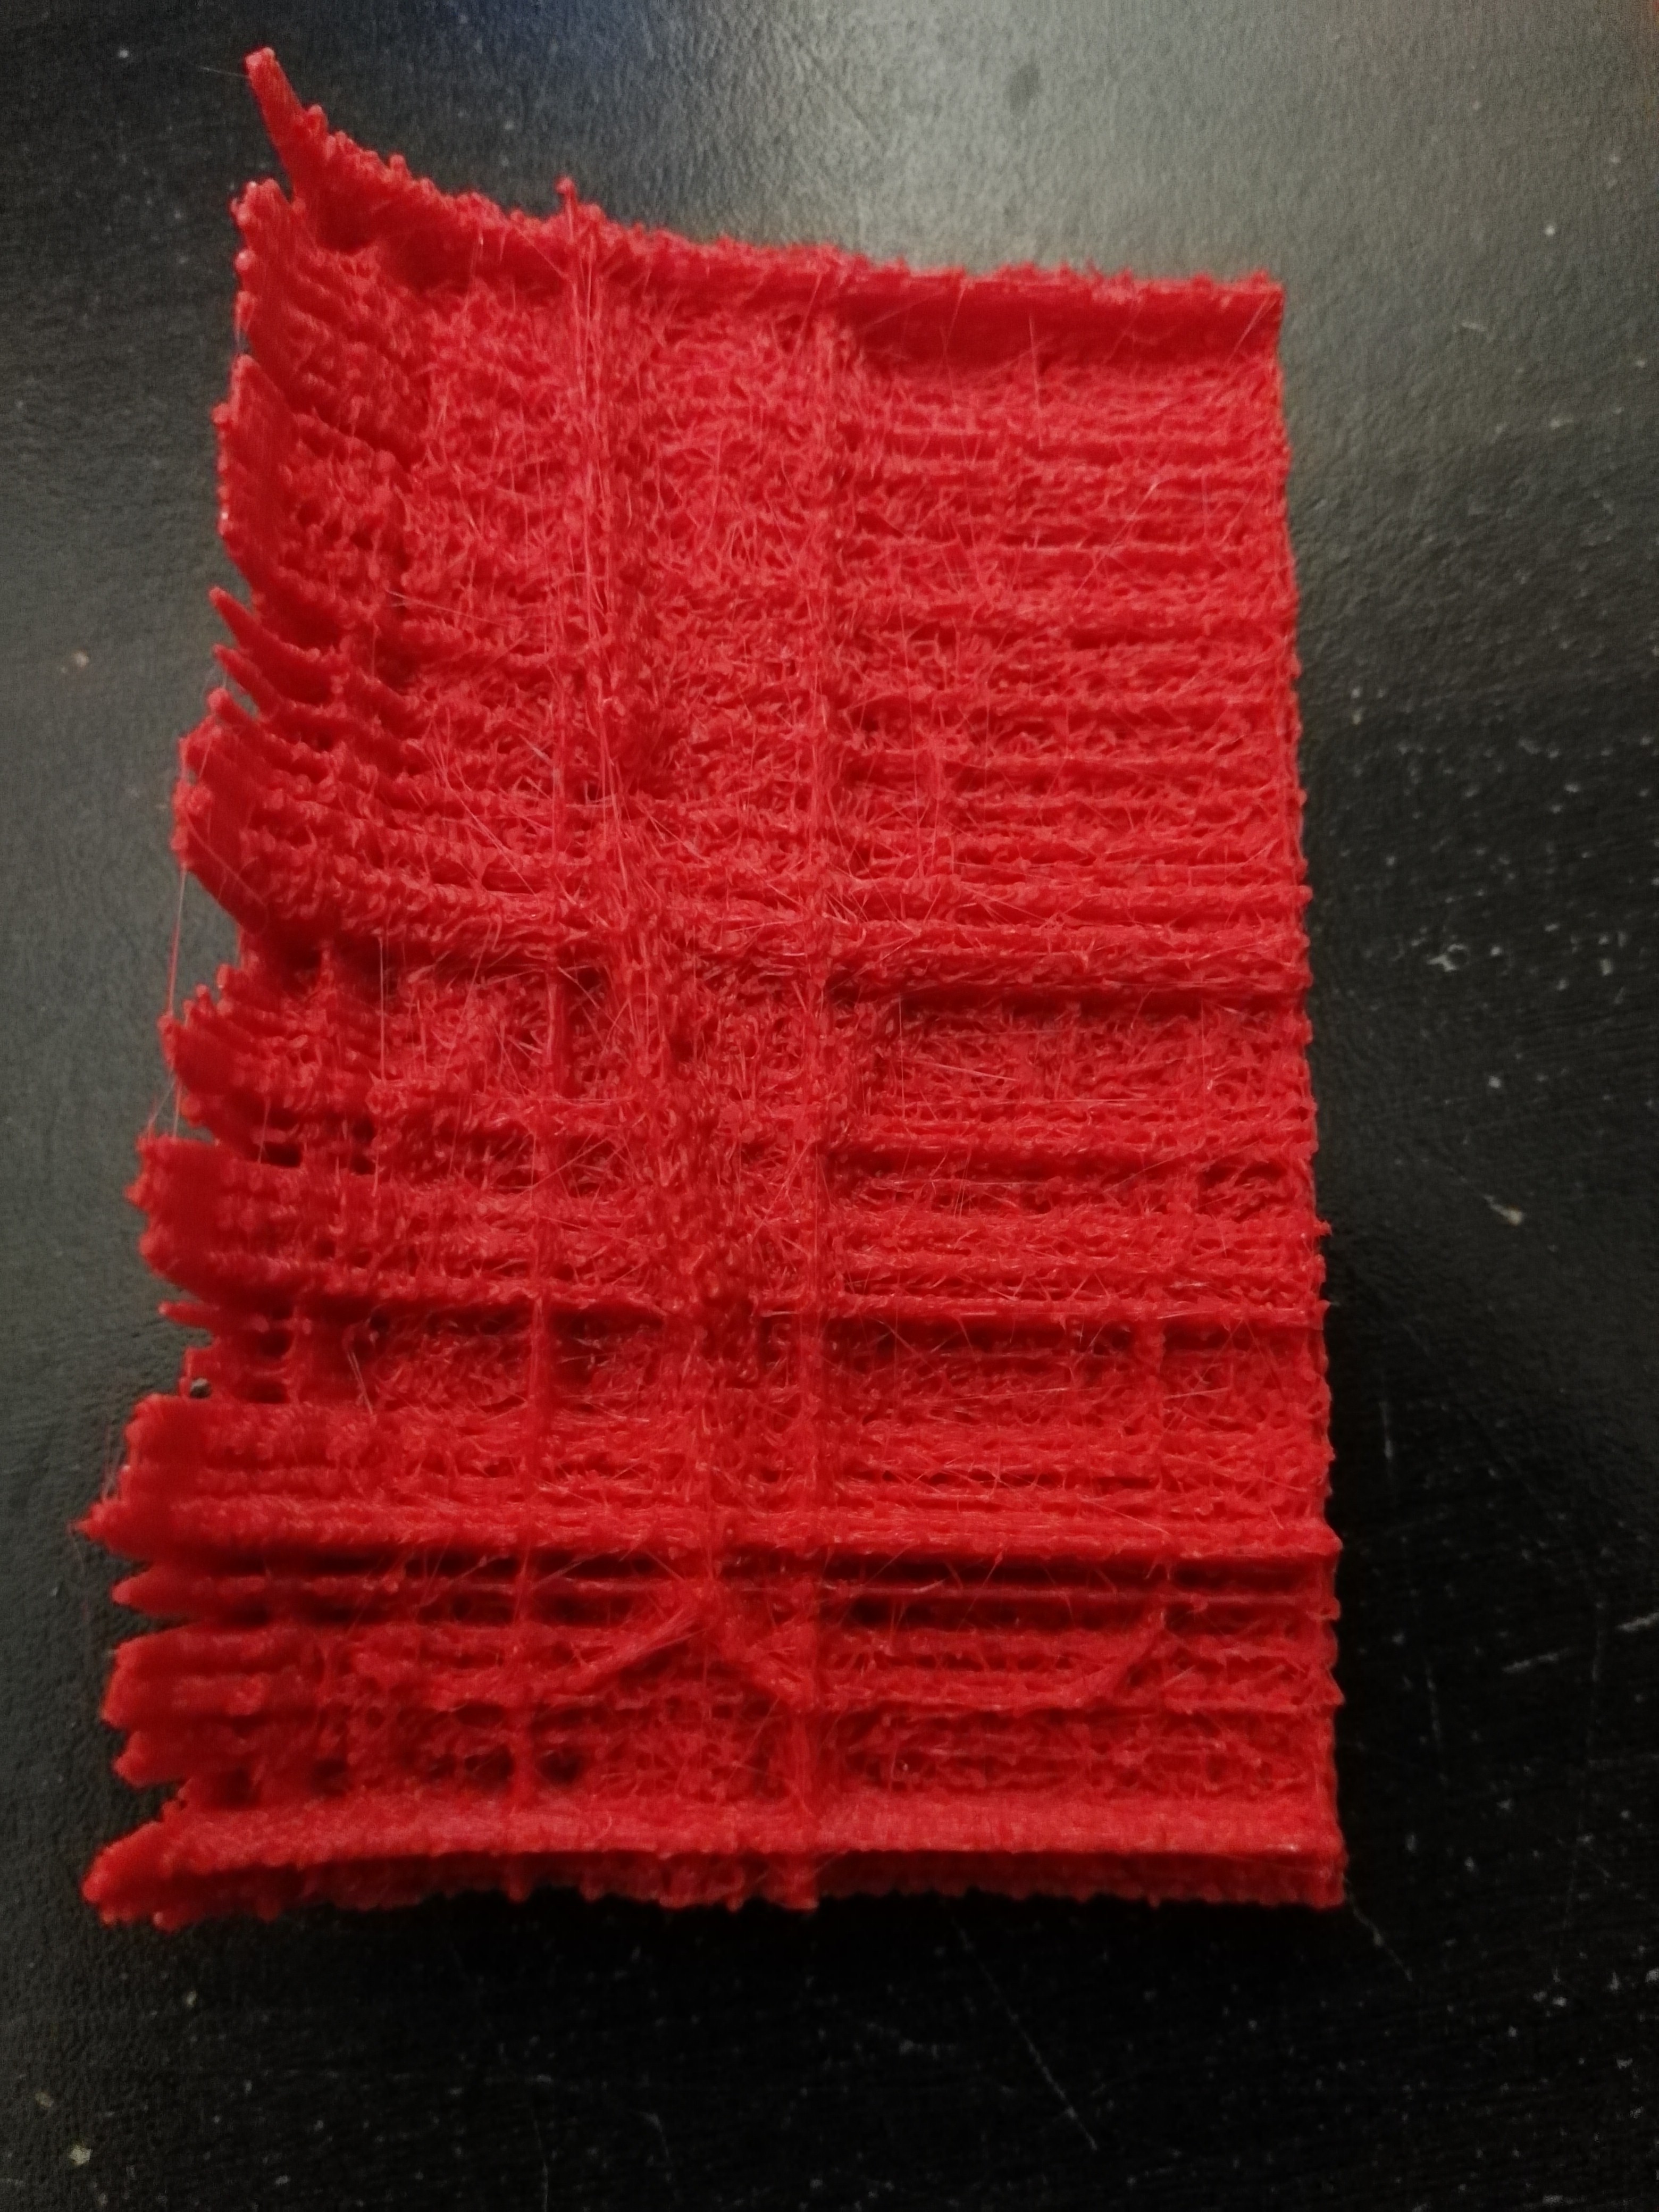
01/30/2019 at 00:21 • 0 commentsAs a bonus for the project, I found my old MATLAB scripts for converting surface plots to STL files and decided to have some fun. So I now present to you a 3D print of the grid harmonics over a 40 minute window:
![]()
![]()
![]()
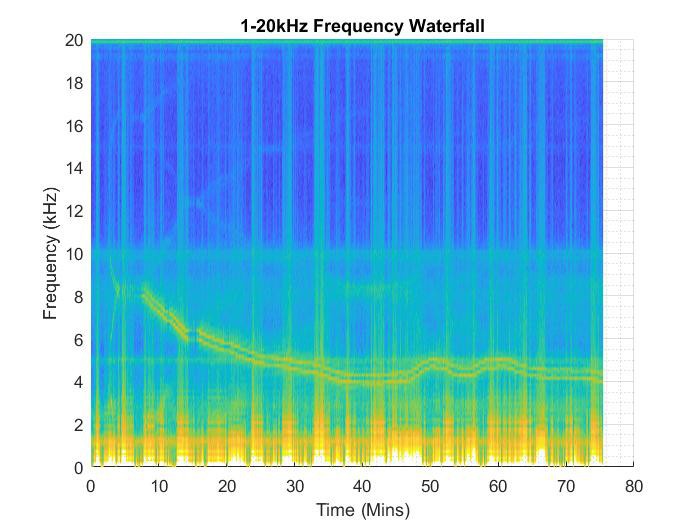
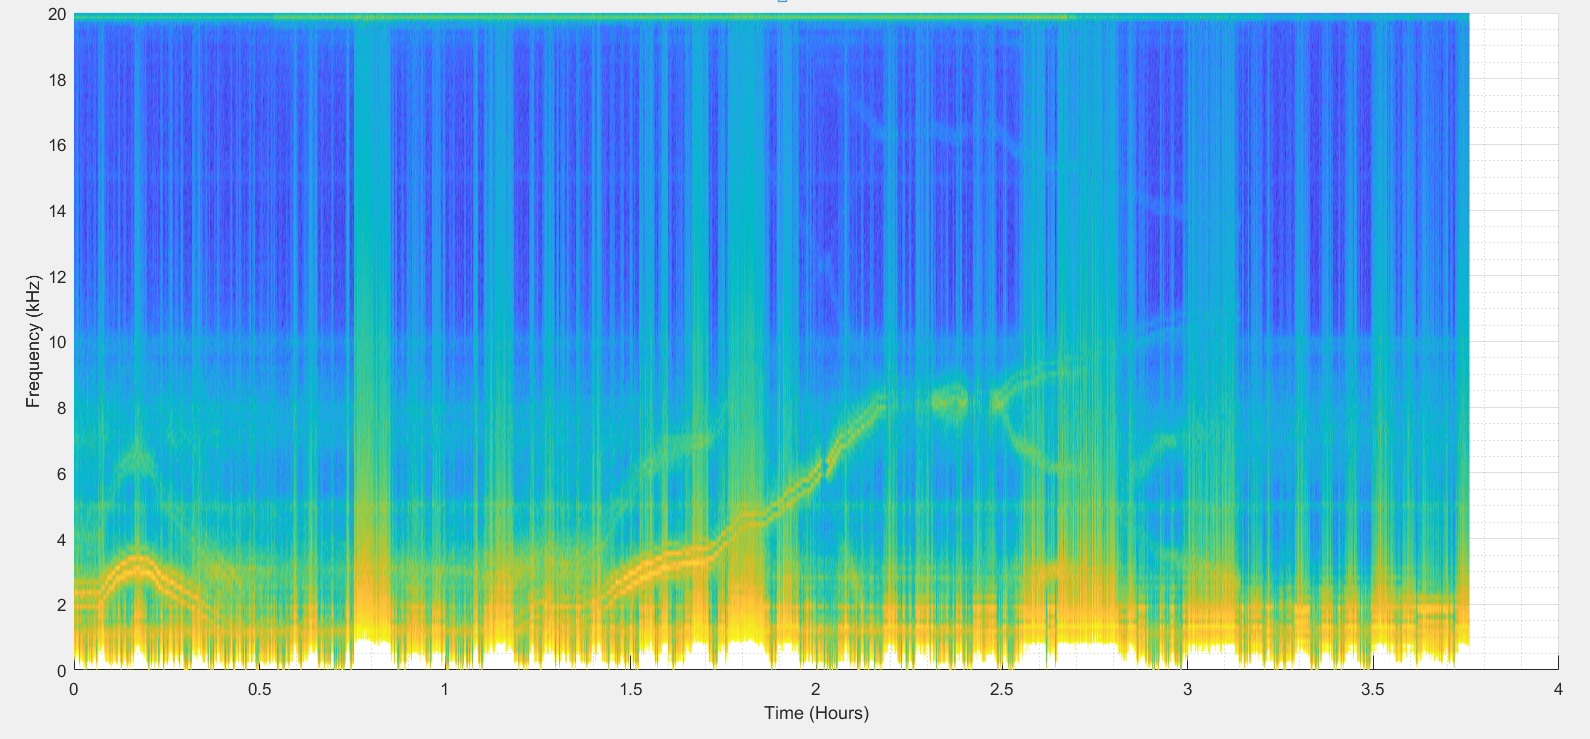
Here is the original data plus more (which is mirrored on the frequency axis from the print):
![]()
NOTE: The 3D print is the first 40 minutes of the above spectrum only.
Unfortunately, the data is not smooth. Filtering is not really practical as the data of the fainter harmonics is spatially very narrow. Although it's not really captured in the images, holding the object in the right light makes all of the harmonics very visible. If I can reduce the size of the STL file I'll upload it, but this is unlikely.
However, printing a difficult spectrum plot like this does seem like a great place to try colour changing filament that is temperature dependent. The physically higher the data printed, the higher I set the temperature (and thus the more of a colour change). Perhaps the perfect application actually?
Another project for one day :)
-
Data from the Hottest Day Ever in Adelaide, Australia
01/28/2019 at 01:38 • 0 commentsI couldn't miss this opportunity! Adelaide recently experienced its hottest day in recorded history! It was 46.6 degrees Celsius in the city! This occurred on the 24/01/19.
Two years ago South Australia experienced a state-wide blackout and in response we have had the largest lithium-ion battery in the world installed by Elon Musk and additional emergency generators installed to help prevent future blackouts such as this. Storage and backups like this are especially important due to our weather which basically ensures that every air-conditioner in the country is turned when every one gets home and the solar panels start to ramp down. Normally SA can import power from our neighbouring state Victoria, but they has a similar problem on that day. In addition, Victoria couldn't import any power from their neighbour New South Wales as the link was down (likely due to the heat!).
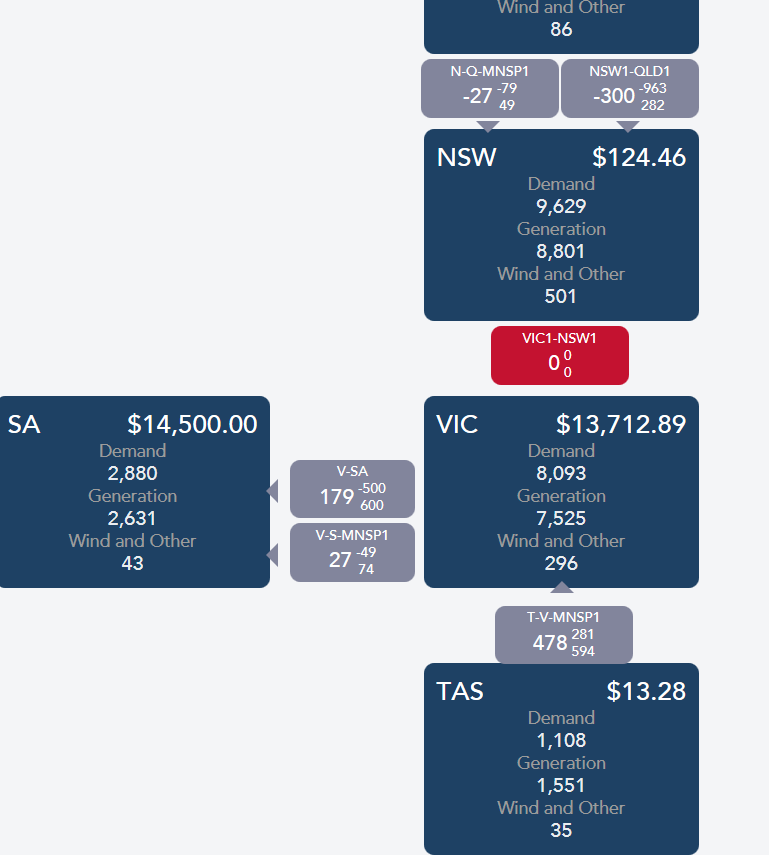
So, with all that in mind, here's the state of the Australian electrical grid at 9pm that day.
![]()
The prices above are in AU$ per mega watt-hour. Yes, that says $14,500, it actually hit the market cap.
You may notice that the inter state links are NOT maxed out. I believe this is because the market operator would rather leave them as a backup and instead first rely on the more expensive (but reliable) emergency generation within the states (the SA-VIC link tripping is what caused the previous SA blackout). However, I'm not a market operator so that's just my guess. Though I can confirm that when the prices suddenly dropped back down to $100 per MWh, the links did take the load as the emergency options were shut down.
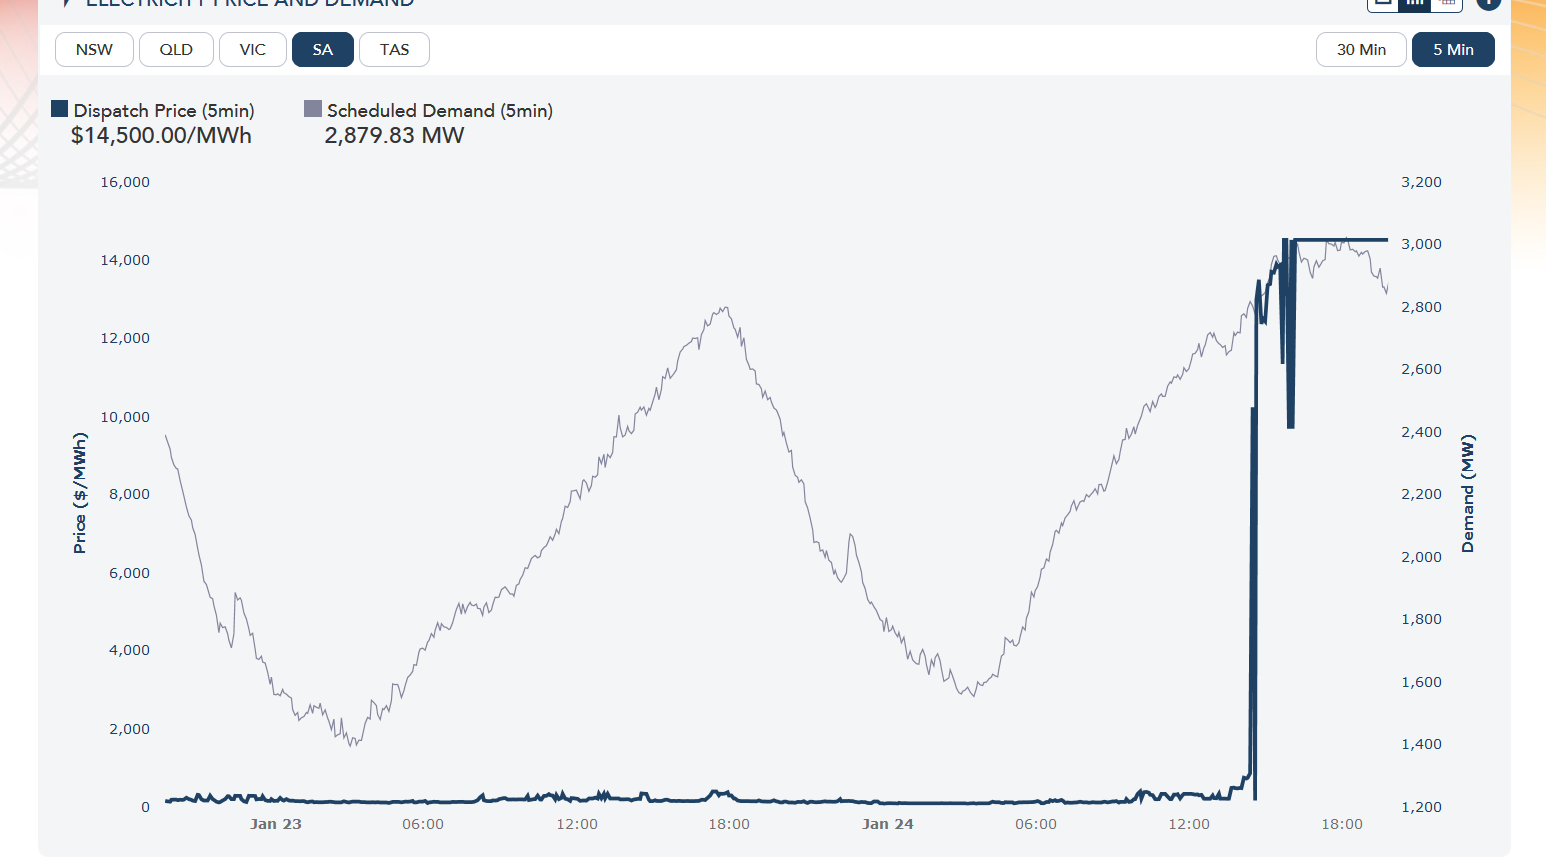
Here's the demand curve and the wholesale price:
![]()
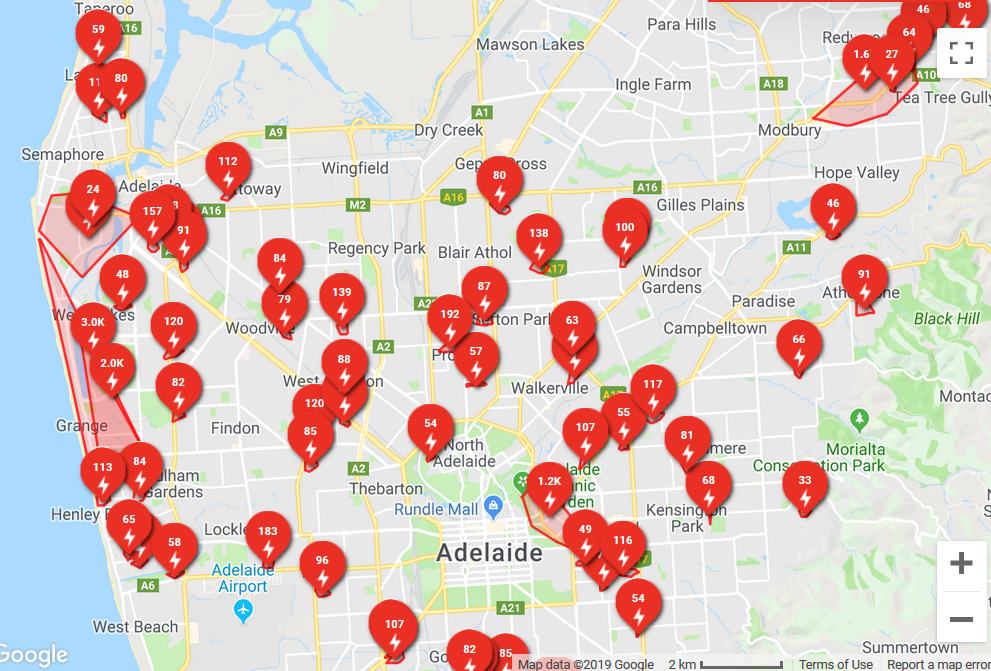
And here's a blackout map:![]()
According to a news report from the ABC, these blackouts were caused by blown fuses on transformers and not load shedding (which is what is looks like according to the map above). Apparently, it was still 35 degrees Celsius at 10pm (a time with no local solar production throughout the neighbourhoods). See:
https://www.abc.net.au/news/2019-01-25/sa-blackouts-related-to-heat-not-network-sapn-says/10748884
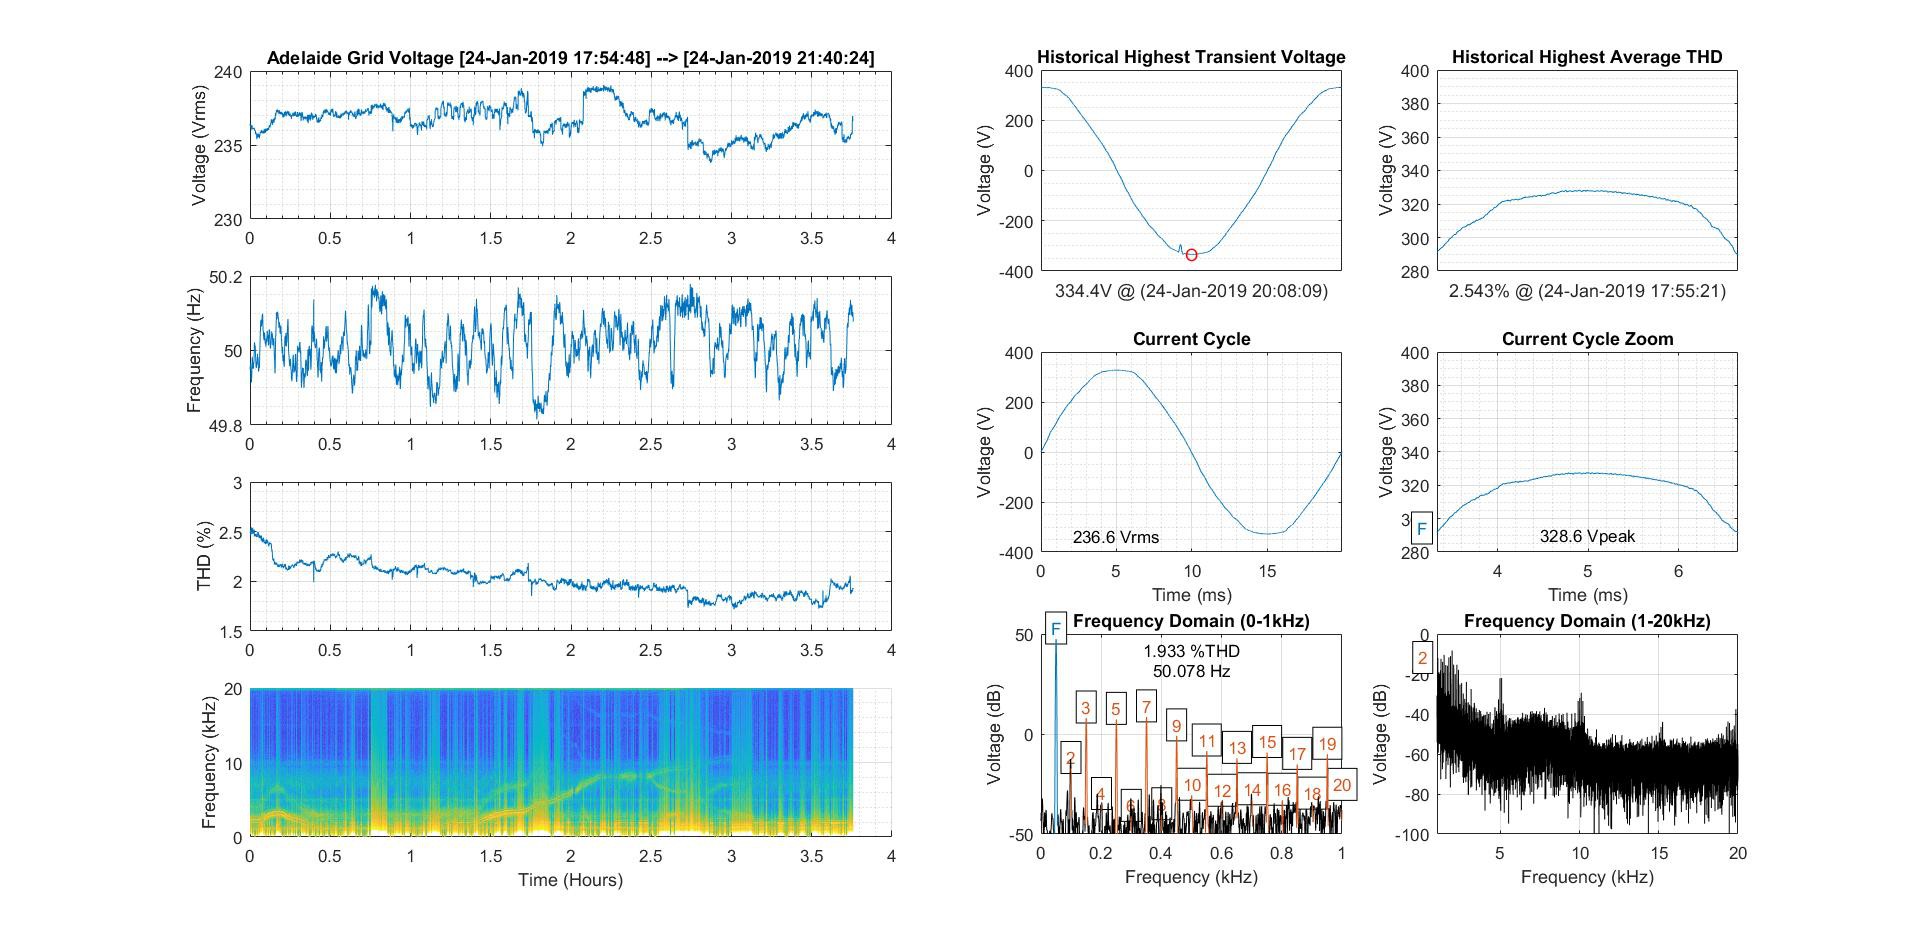
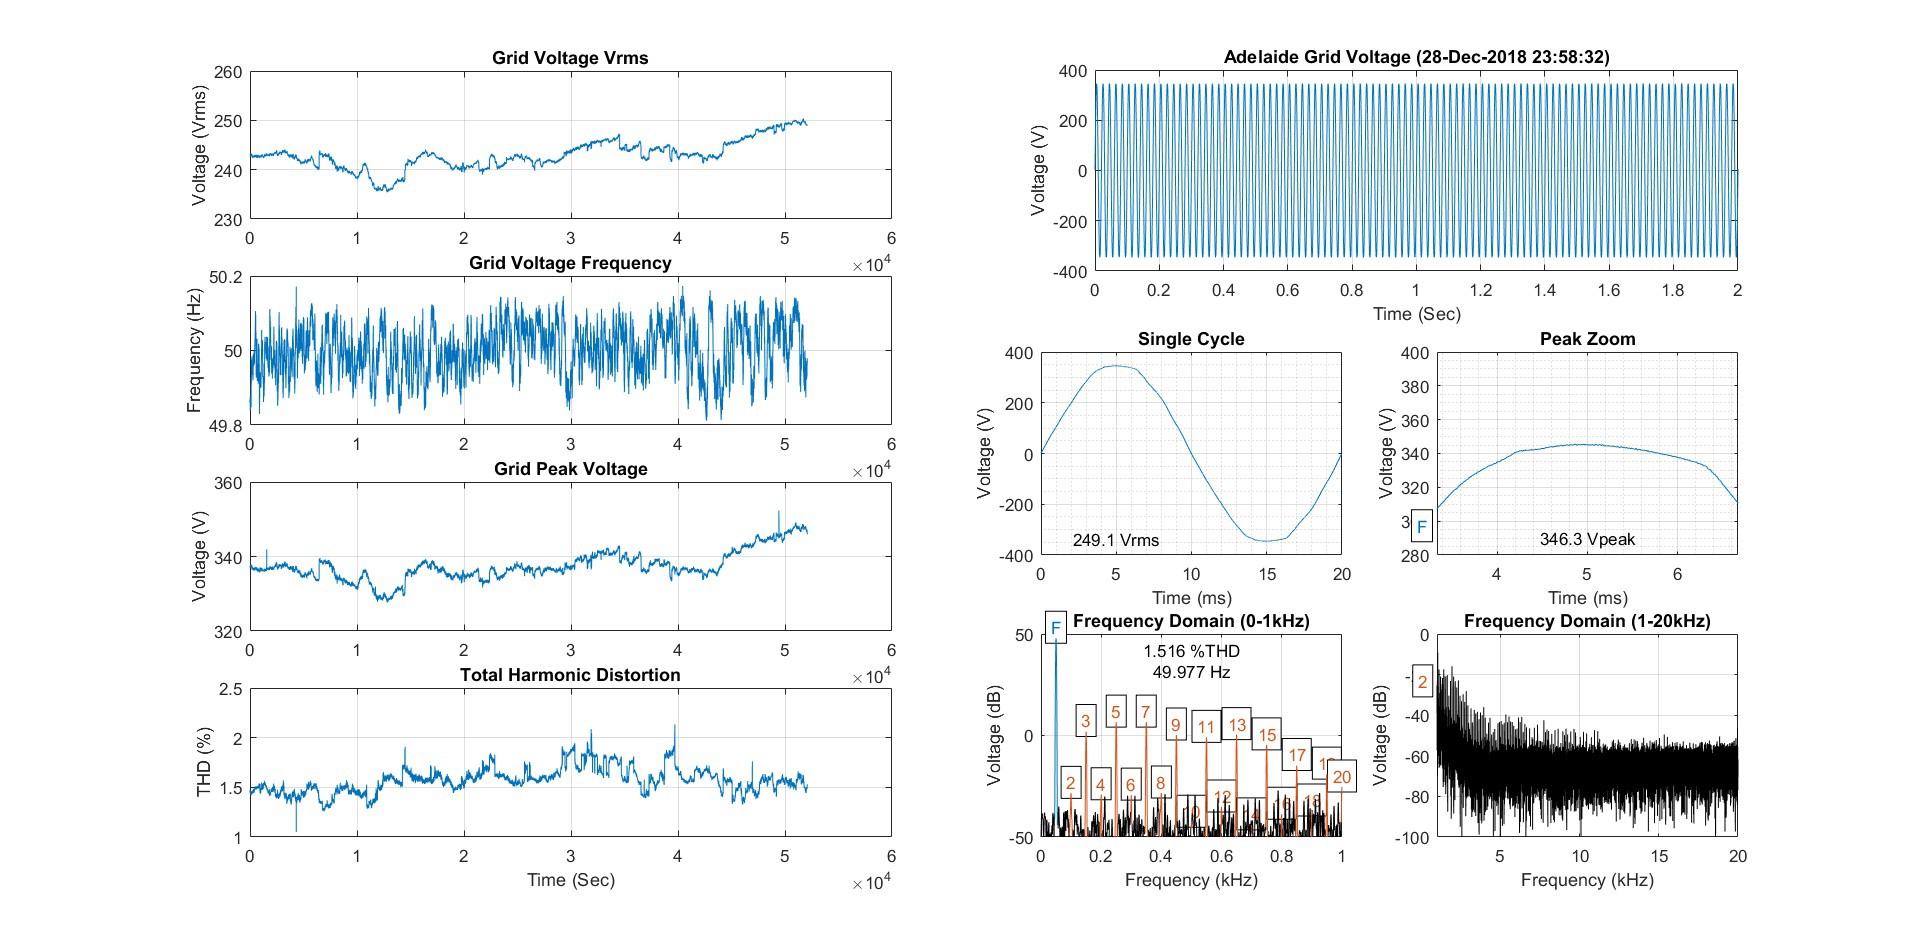
So, what did I record? I had to work during the day, but I did record the grid from 6pm-9.40pm:
![]()
The hottest time was about 5pm, so I did miss the peak, but you can still see some fun stuff.
Yes, I would have left it running all day, but ironically it would have heated the room that my family was trying not to burn to death in (i.e. in front of the air-conditioner).
Also I'm sorry I didn't record any actual audio - It's a difficult process due to weird reasons.
Here's a zoom of the spectrum from above:
![]()
Anyway, I'm happy there wasn't a blackout, but I'm scared to think how this will affect electricity prices going forwards.
I'll upload one more little treat tonight once it's done.
-
It's Finished - All the Fun Stuff is Here!
01/12/2019 at 08:49 • 0 commentsIt's done! After all this time it's finished!
Here's all the good stuff that you probably wanted after seeing the title of this project.
First of all, here is the "sound" of the grid after filtering away the lower frequencies (5 min):
As the description reads:
"This is a 5 minute snippet of the sound of the electrical grid in Adelaide during a period where something was connected that generated a "lot" of noise in harmonics. It slowly comes in over the first 20 seconds and then abruptly changes at 2:45. The image is the waterfall of the 8 hour period of sampling, but the 5 minute clip is from the centre of the circled section. The high pass filter is set to crossover at about 2-2.5kHz."
Here is the process of obtaining the data (a 1 hour snippet that includes the live audio high pass filtered):From the video description:
"This is a 1 hour recording of the MATLAB data recording and processing of my Grid-2-Audio project. For size limitation reasons, only a 1 hour snippet can be shown. The audio you are hearing is the high-pass filtered voltage of the electrical mains during the measurements. The high pass filter is set to crossover at about 2-2.5kHz."
Also, here is an example of the waveform in Soundcard Scope:
Note that nothing really happens at all in this video...
I've also uploaded an example audio recording of the the grid voltage without the high-pass filtering.
SPOILER ALERT: It sounds like hum.Other than fixing up the project description to include all the best bits for people dropping by randomly (hello from Jan 2019!), there is nothing else to be done here - I'm finished. I have a new job starting on Monday and I need the head space. I'll mark the project as complete and that will be that.
Of course I'll still record the grid every now and then. Should I find something good I'll upload it, but there are no guarantees.
So good morning, good afternoon, good evening and good night. It's time to start something new.
-David
-
MATLAB Code Finished
01/10/2019 at 10:40 • 0 commentsSo, after all this time I've finally drawn the line and said enough is enough - The code is done.
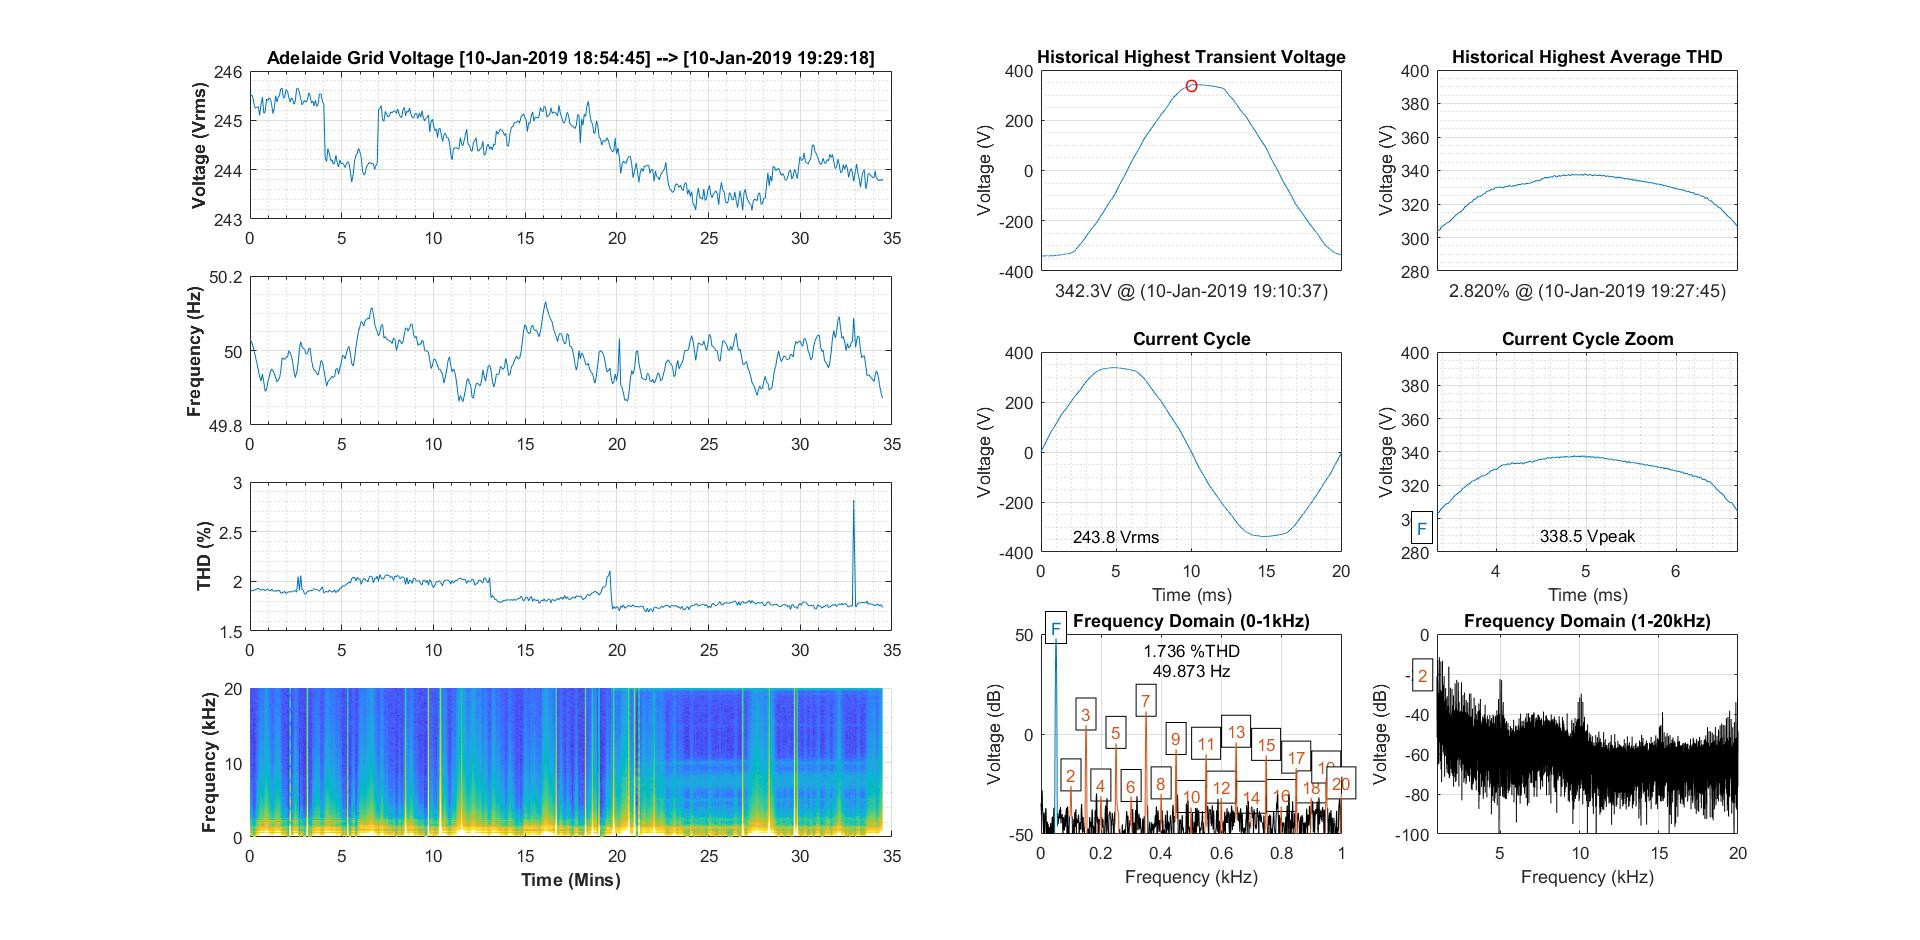
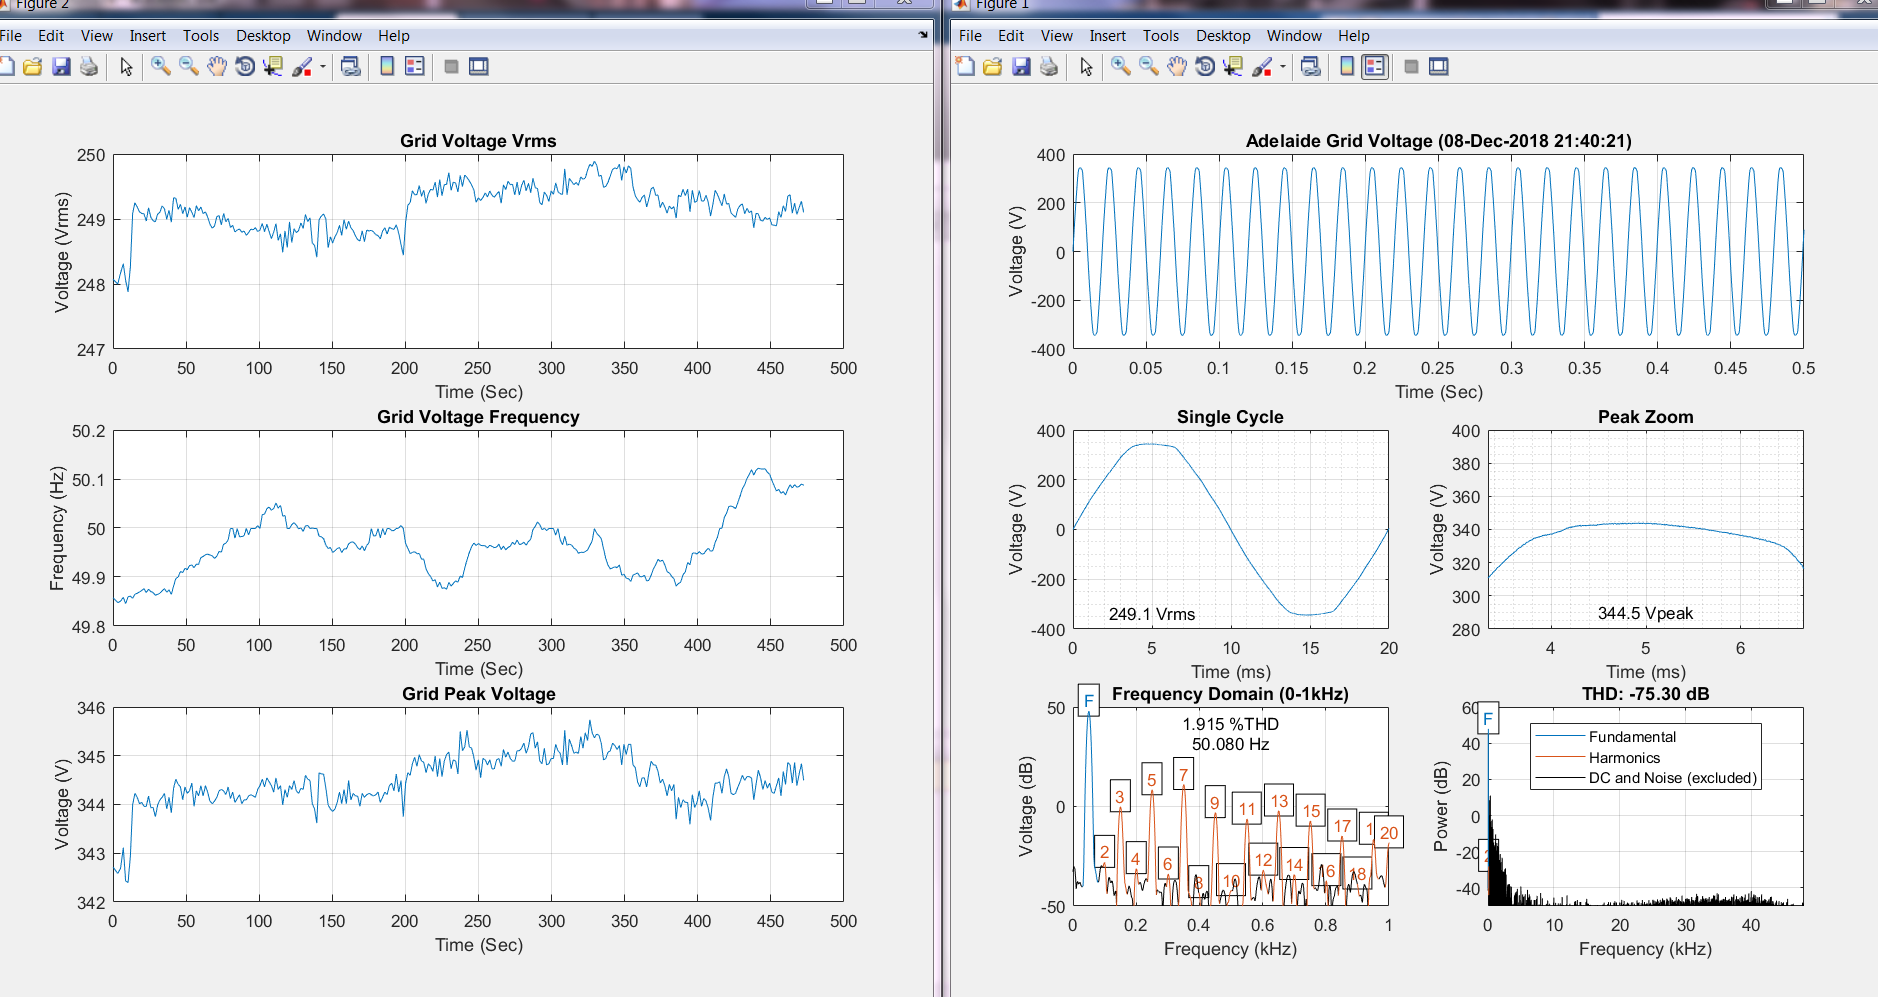
Here is the final format of the MATLAB figure that is produced throughout measurement:
![]()
On the left side (first column) we have from top to bottom:
-The historical Vrms voltage.
-The historical fundamental frequency.
-The historical THD%.
-The historical frequency waterfall spectrum.(2 second sampling/averaging period!)
On the right side we have:
-The highest peak voltage captured since the recording started (red circle shows location). This is a plot of the actual moment it was detected.
-The highest THD recorded. The plot is of one 20ms period from the sample where the highest THD was recorded. This is NOT the period with the highest THD itself.
-The current cycle is the first 20ms from the current 2 second sample.
-The zoom is the same but zoomed into pi/2 to 2pi/3.
-The left frequency plot is for the first 20 harmonics.
-The right frequency plot is for the 1-20kHz harmonics (i.e. switching frequencies and other strange things). This is best seen as a representation of the current sample for the waterfall of the bottom left.Here is a 30 minute recording of the data gathering process:
During this recording (I used VLC) the washing machine was running it's cycle and the kettle was used.
The sudden transient spike in the THD near the end is a bug and I have no idea why it is present.
If you watch carefully during the strange activity on the waterfall (example video time stamp: 2.20-2.25), you''ll see the front of the waveform chopped off. While I want to believe that's the washing machine's phase controlled voltage regulation, it's more likely that VLC's stream recording from the desktop was momentarily holding up the soundcard from MATLAB. This is especially apparent when you notice that there period of the waveform shortens by about 20%. I've never seen this before without VLC recording - So it's a very plausible theory.
I've uploaded the MATLAB code and a bunch of results that I've collected.
What I'll try and do next is record the audio (via soundcard scope) while recording the MATLAB data acquisition using VLC. Then, I'll sink it all up (with the 50Hz hum removed, etc) and make a youtube video. There are two huge problems with this though:
-The sound card is now shared between three programs? I'm sure that will work just fine.
-I need an interesting signal to be present like the changing one in those nice two waterfall diagrams. THIS IS RARE.So good luck to me and having everything work at once, but it has to happen eventually.
-
Waterfall Success!
01/03/2019 at 08:23 • 0 commentsFinally having some success with the FFTs through MATLAB. Most of the difficulty was tuning the visual display and colour chart to display anything of interest (and then waiting for something to happen to test a configuration of display variables). A very frustrating process.
I initially had some success plotting a waterfall using only the harmonics from the "thd" function, but I quickly realised this, when exported to an array, only includes the actual harmonics (i.e. 100, 150, 200, 250Hz, etc) and not the other frequencies in between.
Now, using the FFT library and some guides (with only a moderate understanding of the process), I have produced the following, which captures the weird signal (along with some other faint ones):
![]()
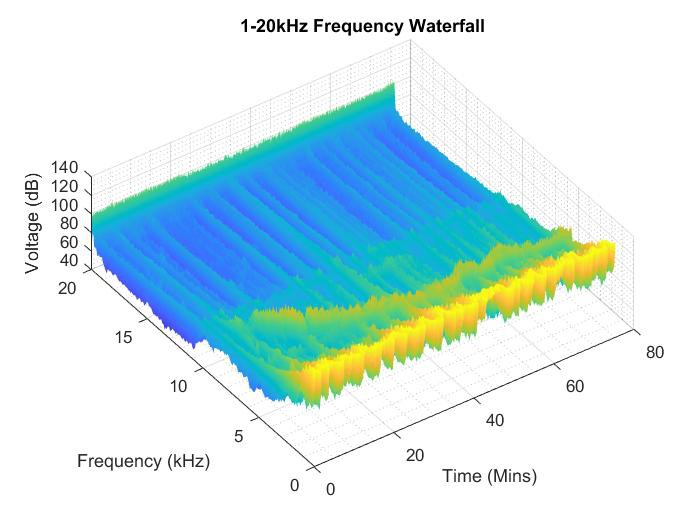
Now as with everything with MATLAB, there are some hidden conveniences! I can rotate the plot into 3D:
![]()
Just ignore the magnitude of the voltage though, I do not trust that it is scaled correctly!
Soon I'll match these plots up with the Vrms, THD and frequency plots to try and see what is triggering these signals (i.e. are they grid distribution control signals or just harmonics from something?).
EDIT:
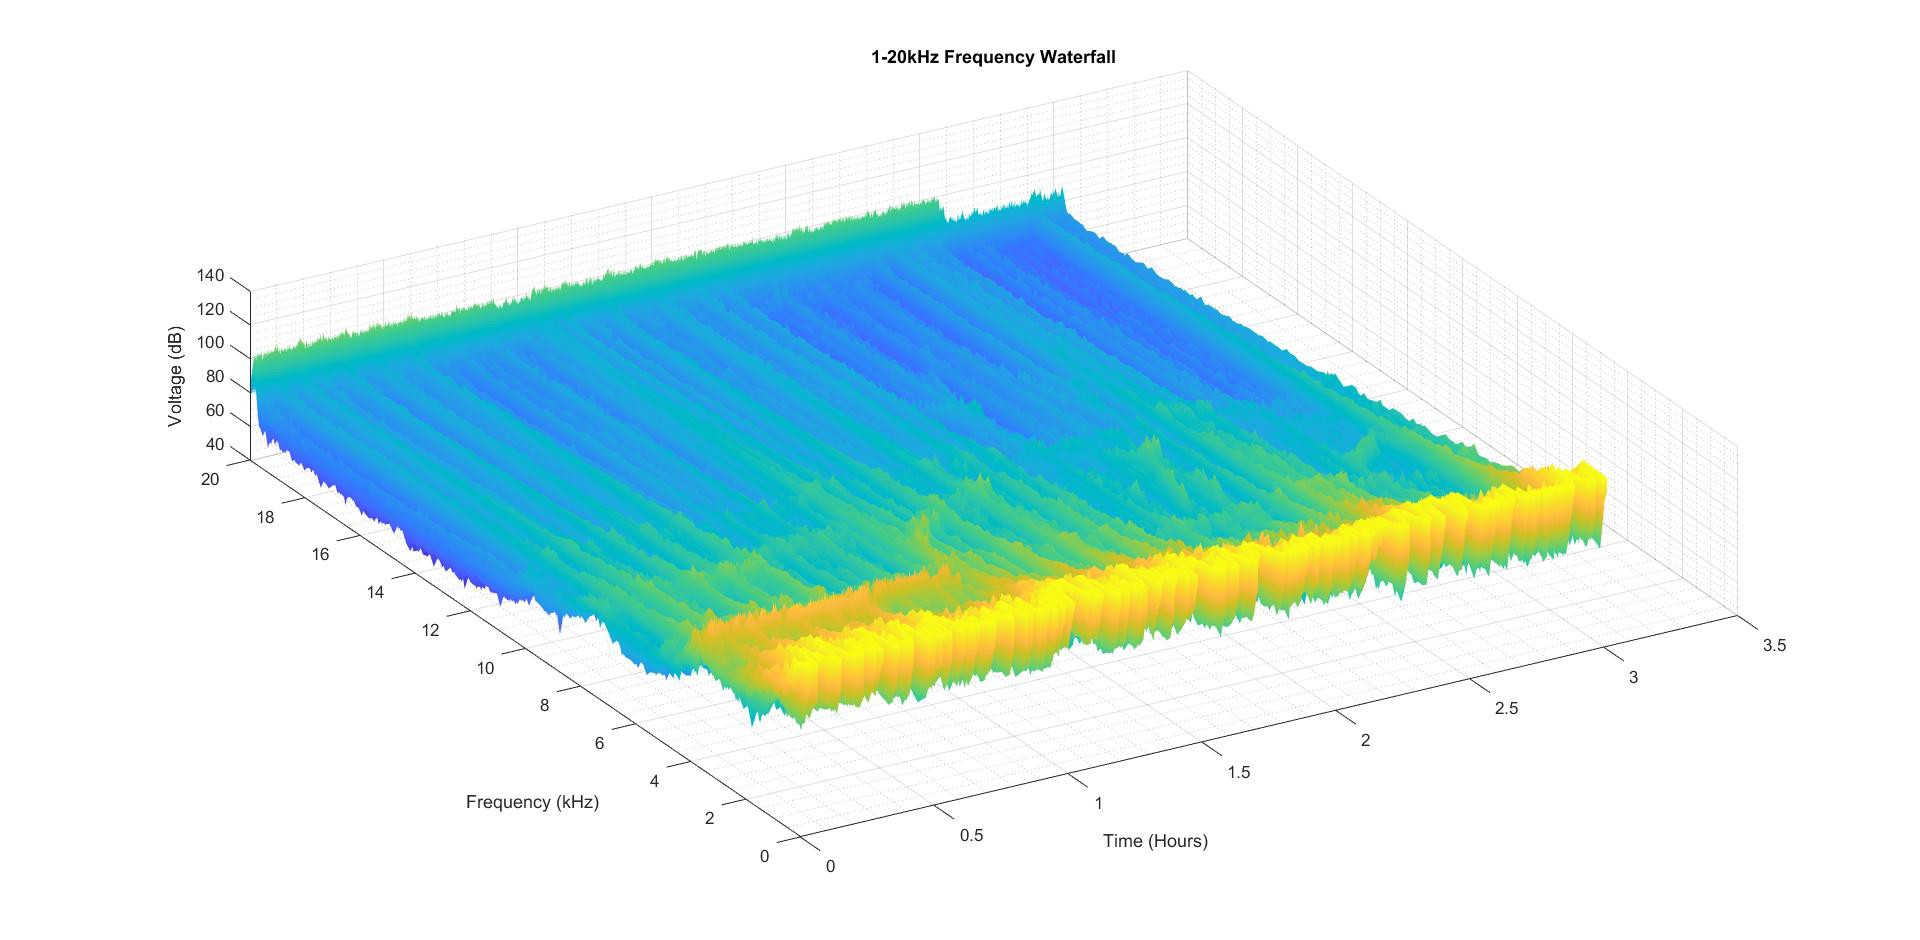
Here are some more!![]()
![]()
I'll just stick to the 2D view from now on as the 3D seems a bit useless (I really nailed the colour map tuning - go team me). -
A Good Set of Results!
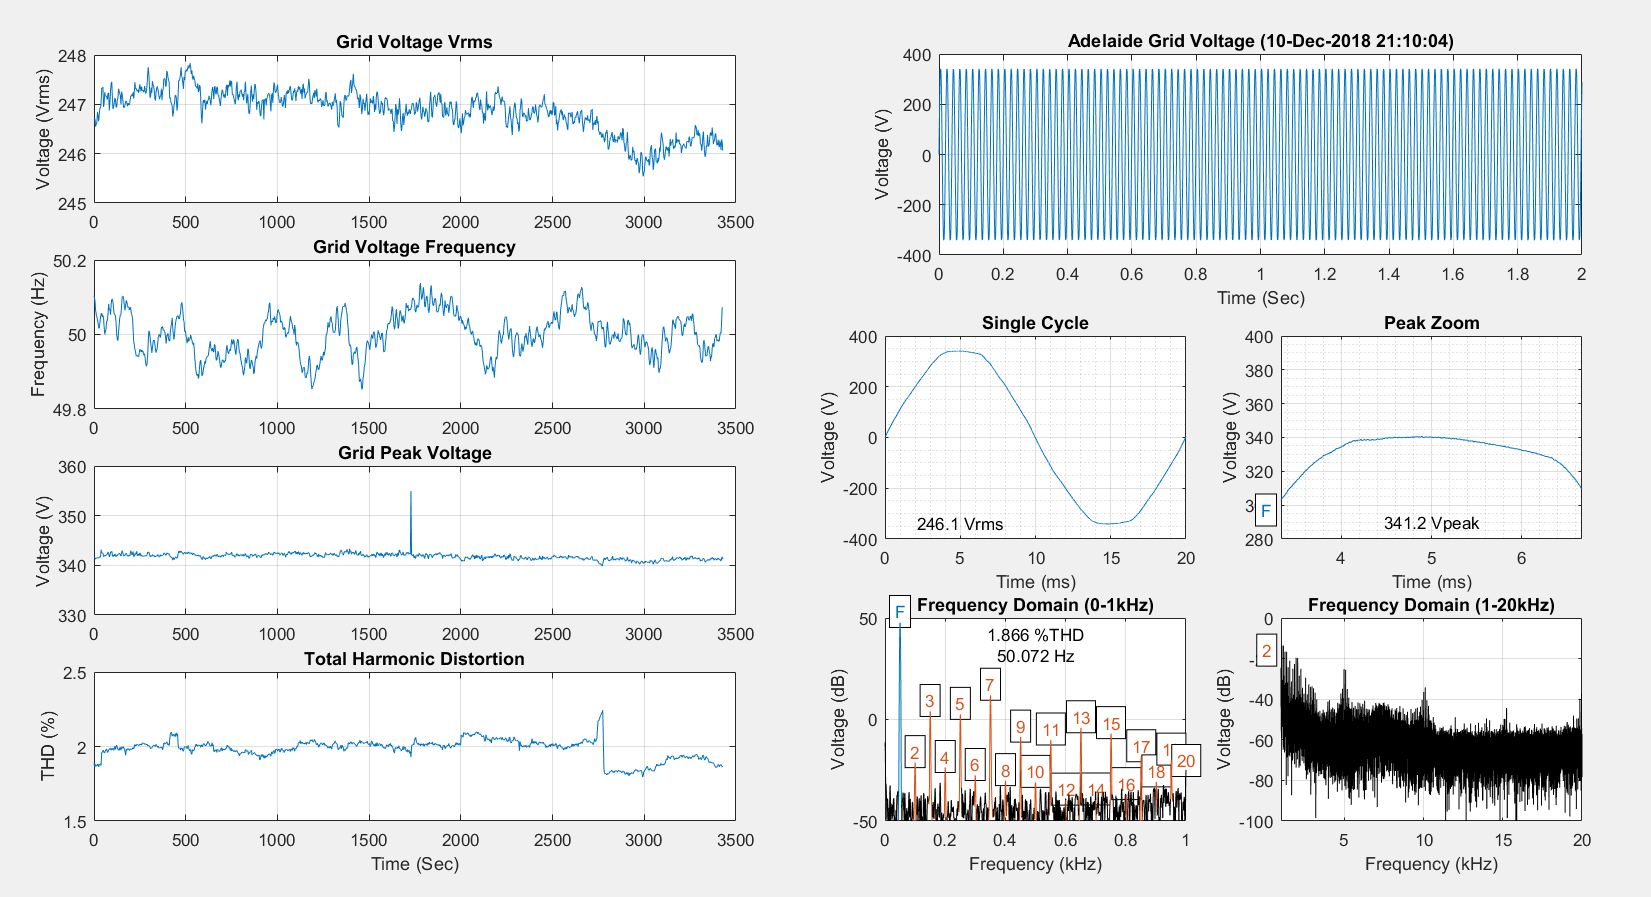
01/01/2019 at 02:36 • 0 commentsOkay, I know it's been a while (I'm a Daddy now!), but I have obtained the longest stretch of results that I possibly could without leaving the computer unattended.
Everything on the right side is just the final instantaneous snapshot of the measurement run and isn't that interesting. However, everything on the left is a running set of results where each time division (1x10^4) represents almost 4 hours of time.
The results started recording about 10am in the morning and ran till about 12am (~14 hours).
![]()
What I've learnt from this is that yes, I can see any time that a heavy load is turned on in the house (hair dryer, compressor, kettle or microwave). This can be seen on the Vrms plot as little sharp drops of 2-3 volts). I also see larger slower drops that must be from local industry (there is a vehicle works shop 3 houses down the road).
The grid frequency over that day is its own thing and is primarily controlled by the collective behaviour of all of the customers and the generation regulation.
The peak voltage is interesting in that is sometimes seems to capture some little transients. However, this will never be reliable as the sampling by MATLAB goes long periods without actually looking at the grid (it's luck if I grab a transient peak really).
The THD is great as it seems to vary in an interesting way in reaction to loads. For example, a linear load (resistor) like a kettle will simply drop the voltage across all frequencies. However, a heavy load with power factor correction and input filtering SHOULD (as far as I can casually comment) only draw fundamental current. Thus, the fundamental voltage component of the grid will sag a few volts, but the harmonic ripples will NOT. As a result, the ratio of the harmonics to the fundamental voltage (i.e. the THD) will increase. As a result, such fundamental current only devices should increase the grid voltage THD when they are turned on. Good luck observing this! And good luck separating such an effect from other variables that may overwhelm and make the opposite occur!
I'll also upload this MATLAB plot, along with others that are okay or decent.
When taking these results I have also noticed some very strange frequencies that seem to shift in reaction to THD or Vrms thresholds (cause and effect confusion maybe?). To show this to you I plan on getting the harmonic waterfall plotting working. This should allow a nice visual representation of what's going on over a day.As you may have guessed, I'm certainly looking to wrap this project up (it's been a long time and I've lost interest).
Before I finish I'd like to:
-->Have some waterfall plots.
-->Video output of the grid.
-->Some kind of audio representation.
-->Raw data file for others.
Oh and here's the hair dryer turning off:![]()
This also shows some mysterious 5kHz and 10kHz signals (bottom right black spectrum). -
More Results
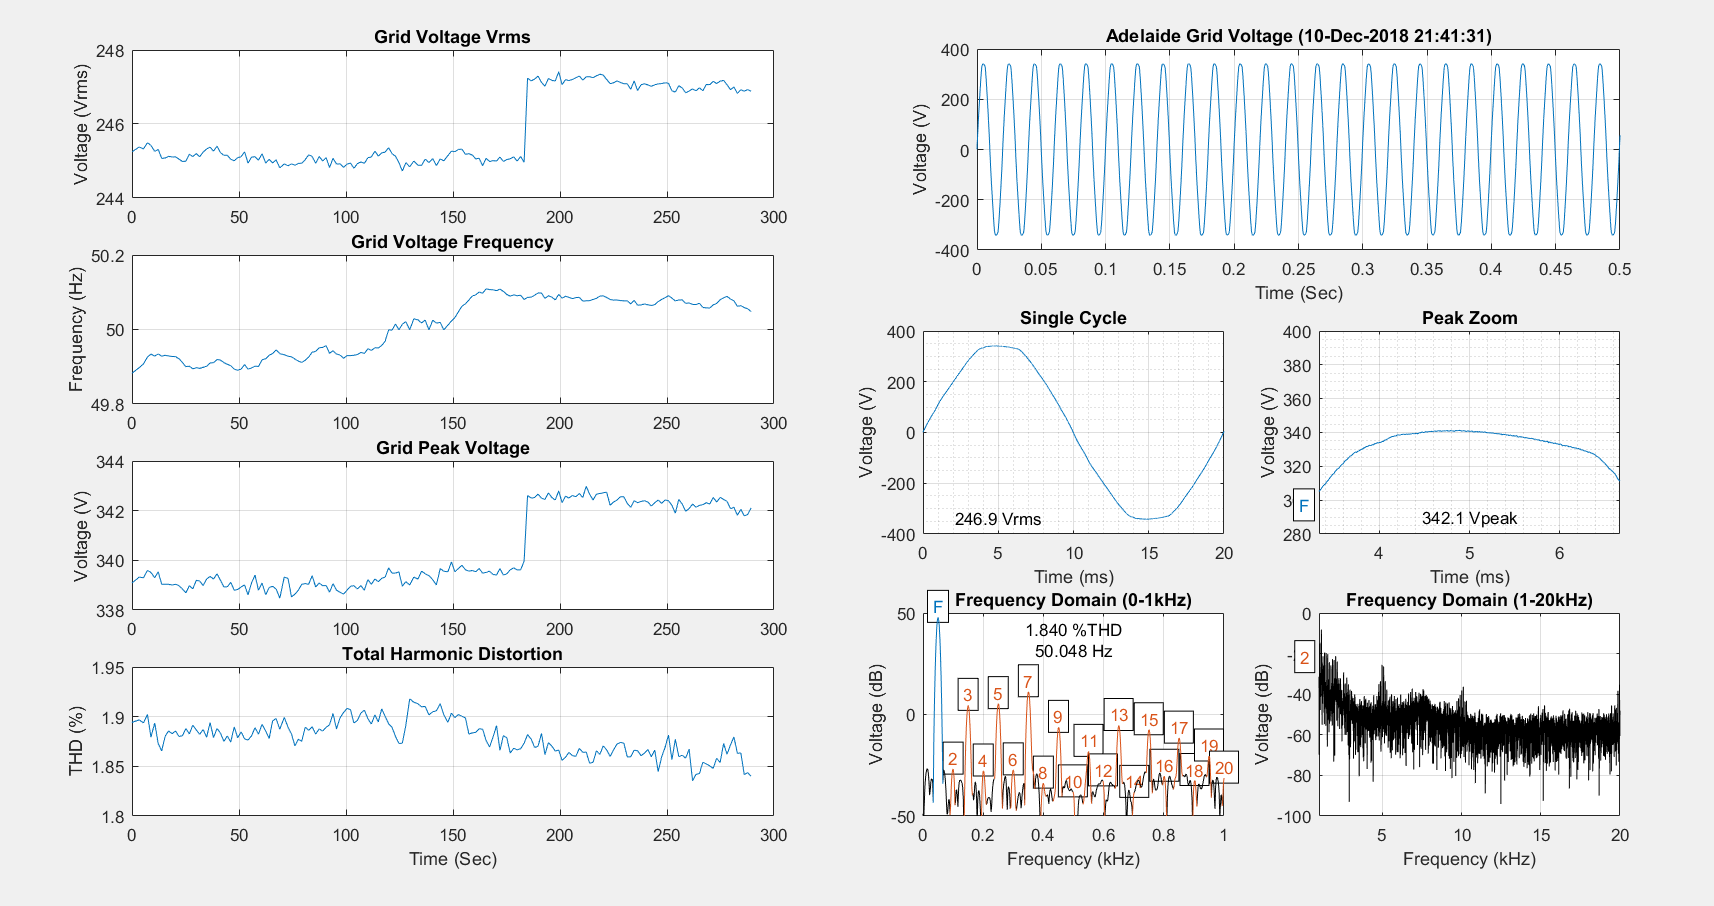
12/10/2018 at 11:07 • 0 commentsAfter leaving the computer on for an hour straight (and teaching MATLAB not to move the graph in front of my web browser) I have some interesting results:
![]()
I seems to have captured a significant peak voltage surge and 15 minutes later, a sudden rise and drop in the THD.
What's interesting is that the 5, 10 and 15kHz signals came in at exactly the same time that the THD dropped.
As the THD is calculated only from the first 40 harmonics (<2kHz), it is not the signals causing the THD change. Rather, this may be some kind of signalling from the energy distributor?
Anyway, I'm installing MATLAB on a laptop so I can monitor for longer periods of time (and have battery power to allow for the capture of blackouts!)
This plot is currently uploaded as a MATLAB figure file for a limited time.
-
It's all downhill now!
12/08/2018 at 11:12 • 0 comments![]()
-
Quick MATLAB Progress
12/04/2018 at 11:44 • 0 commentsSo, first of all, sound card samples through MATLAB look like this raw:
![]()
So I have to purge near 10 cycles (also not seen is the initial transient spike for the first 100 or so micro seconds).
After this though, I can grab some nice data!
![]()
I'll have a go at adding some FFT functionality over the next few days and get back to you.
-
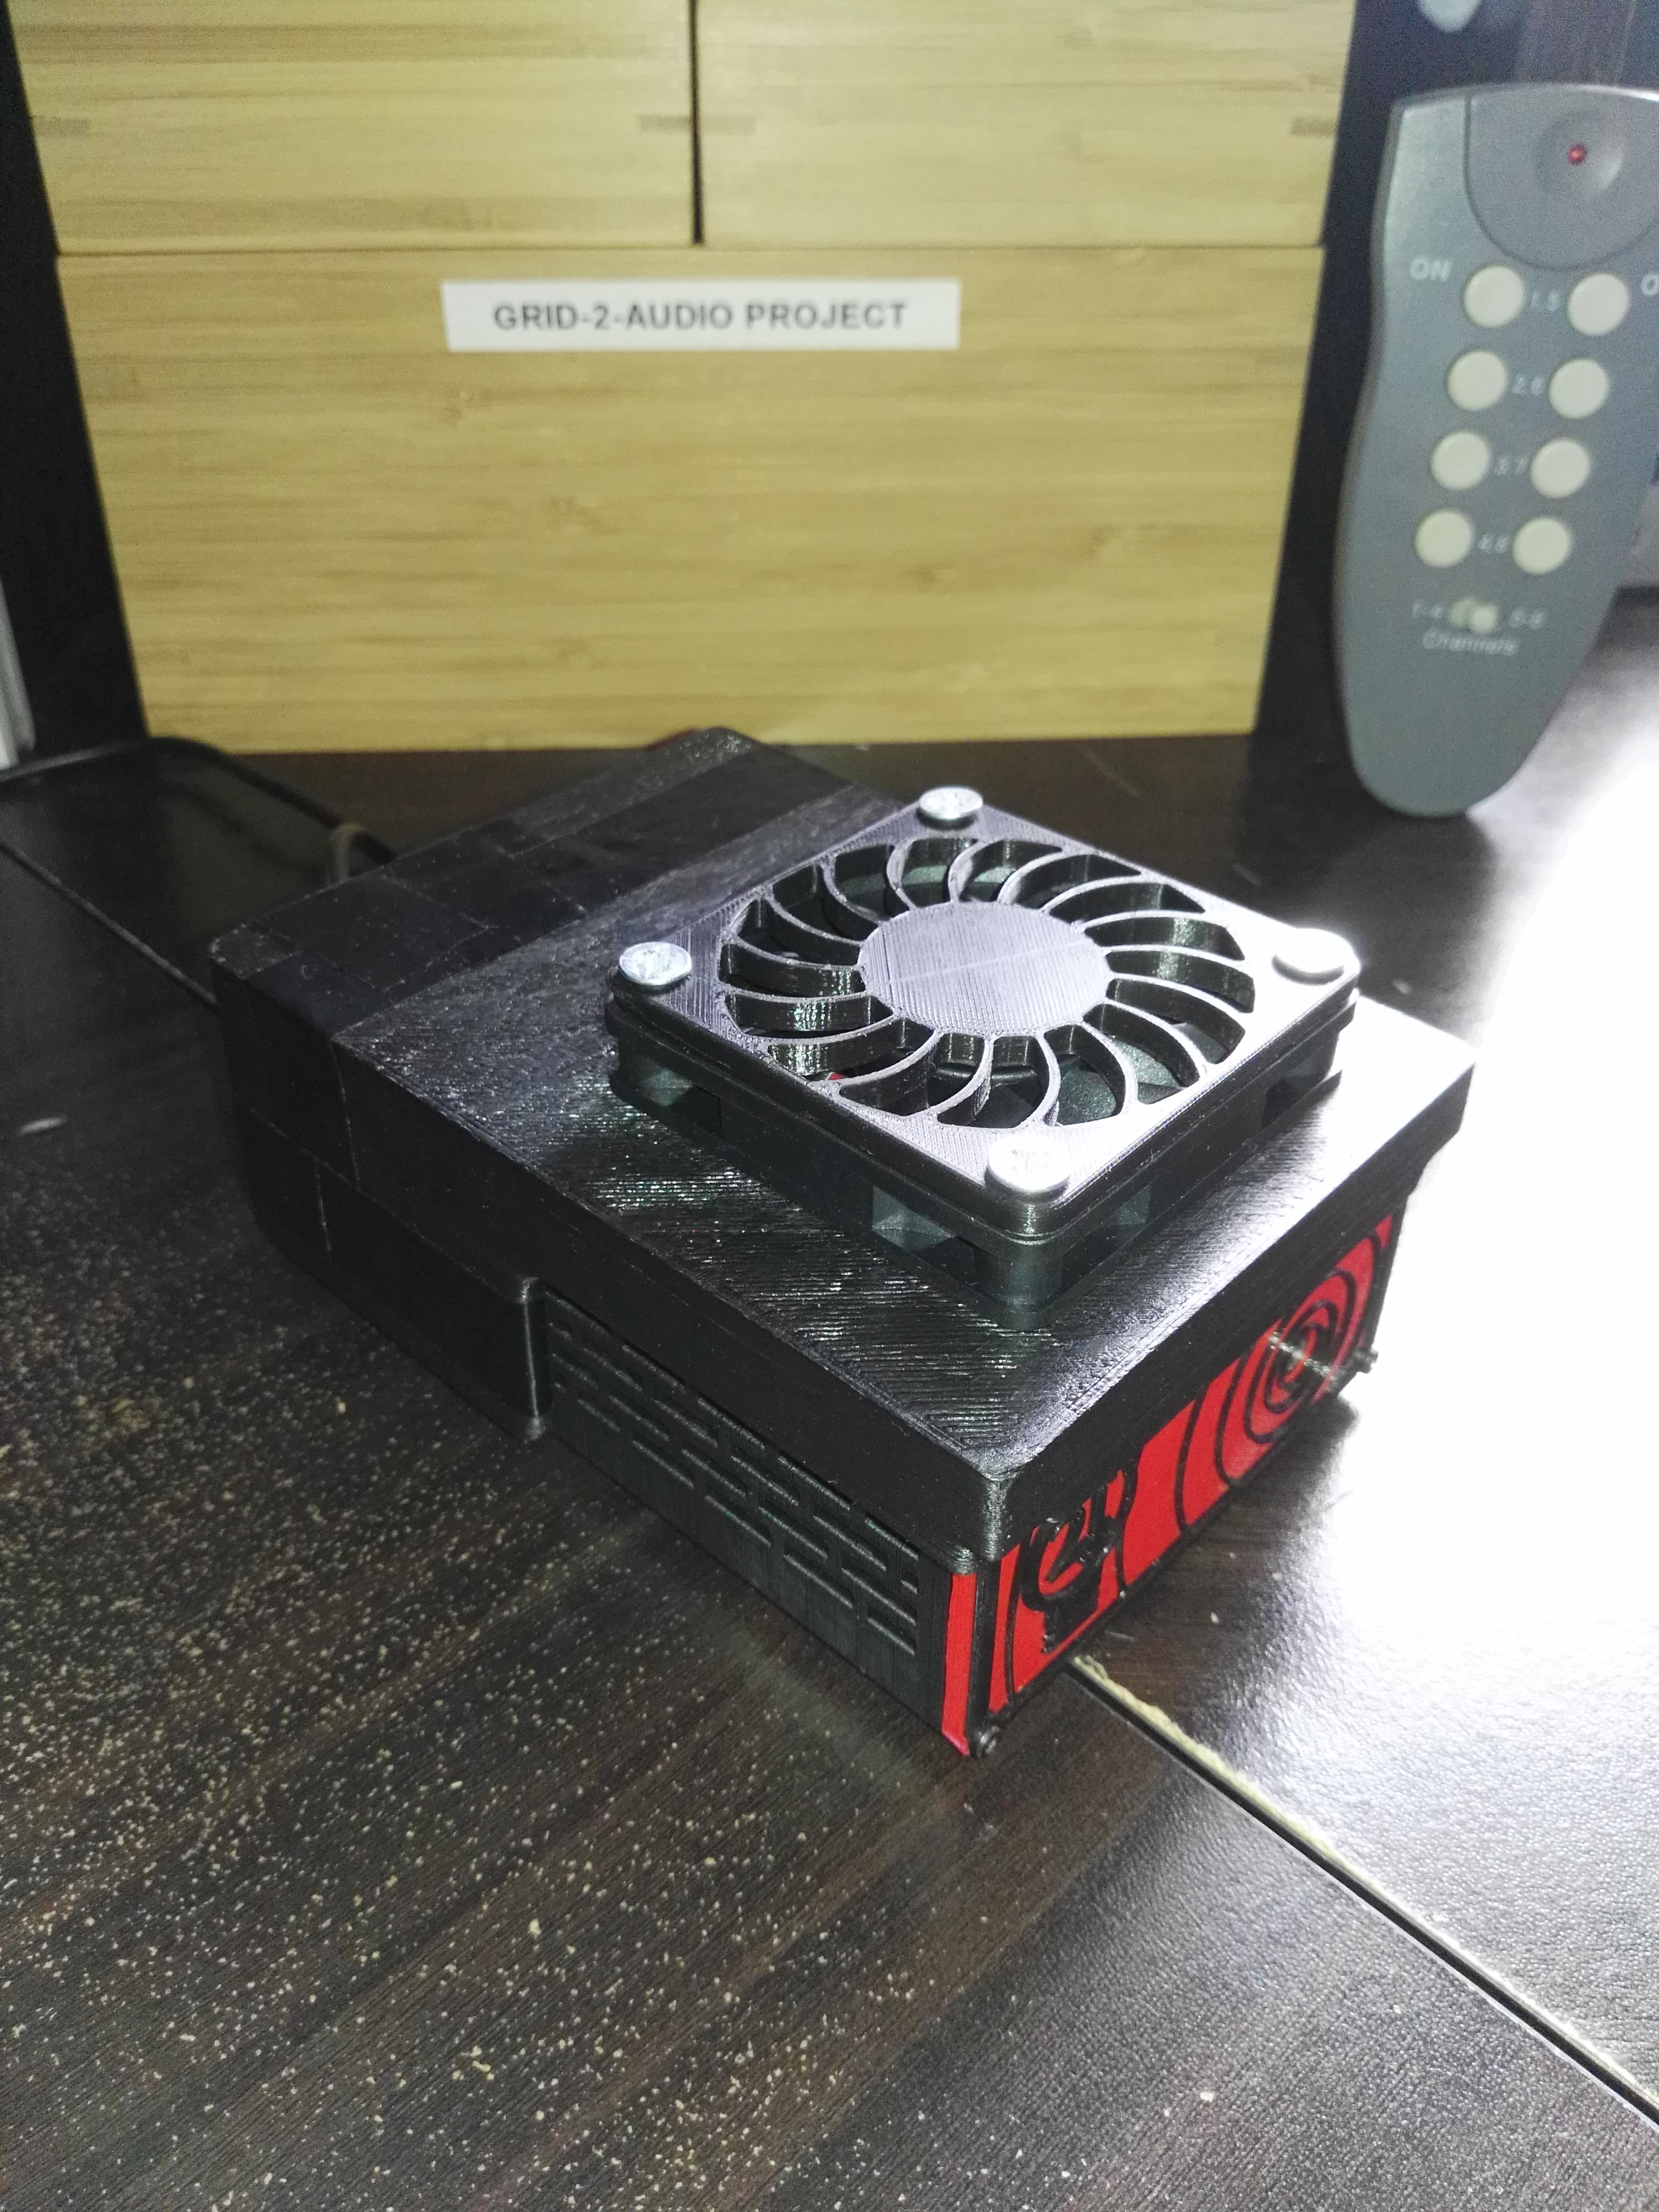
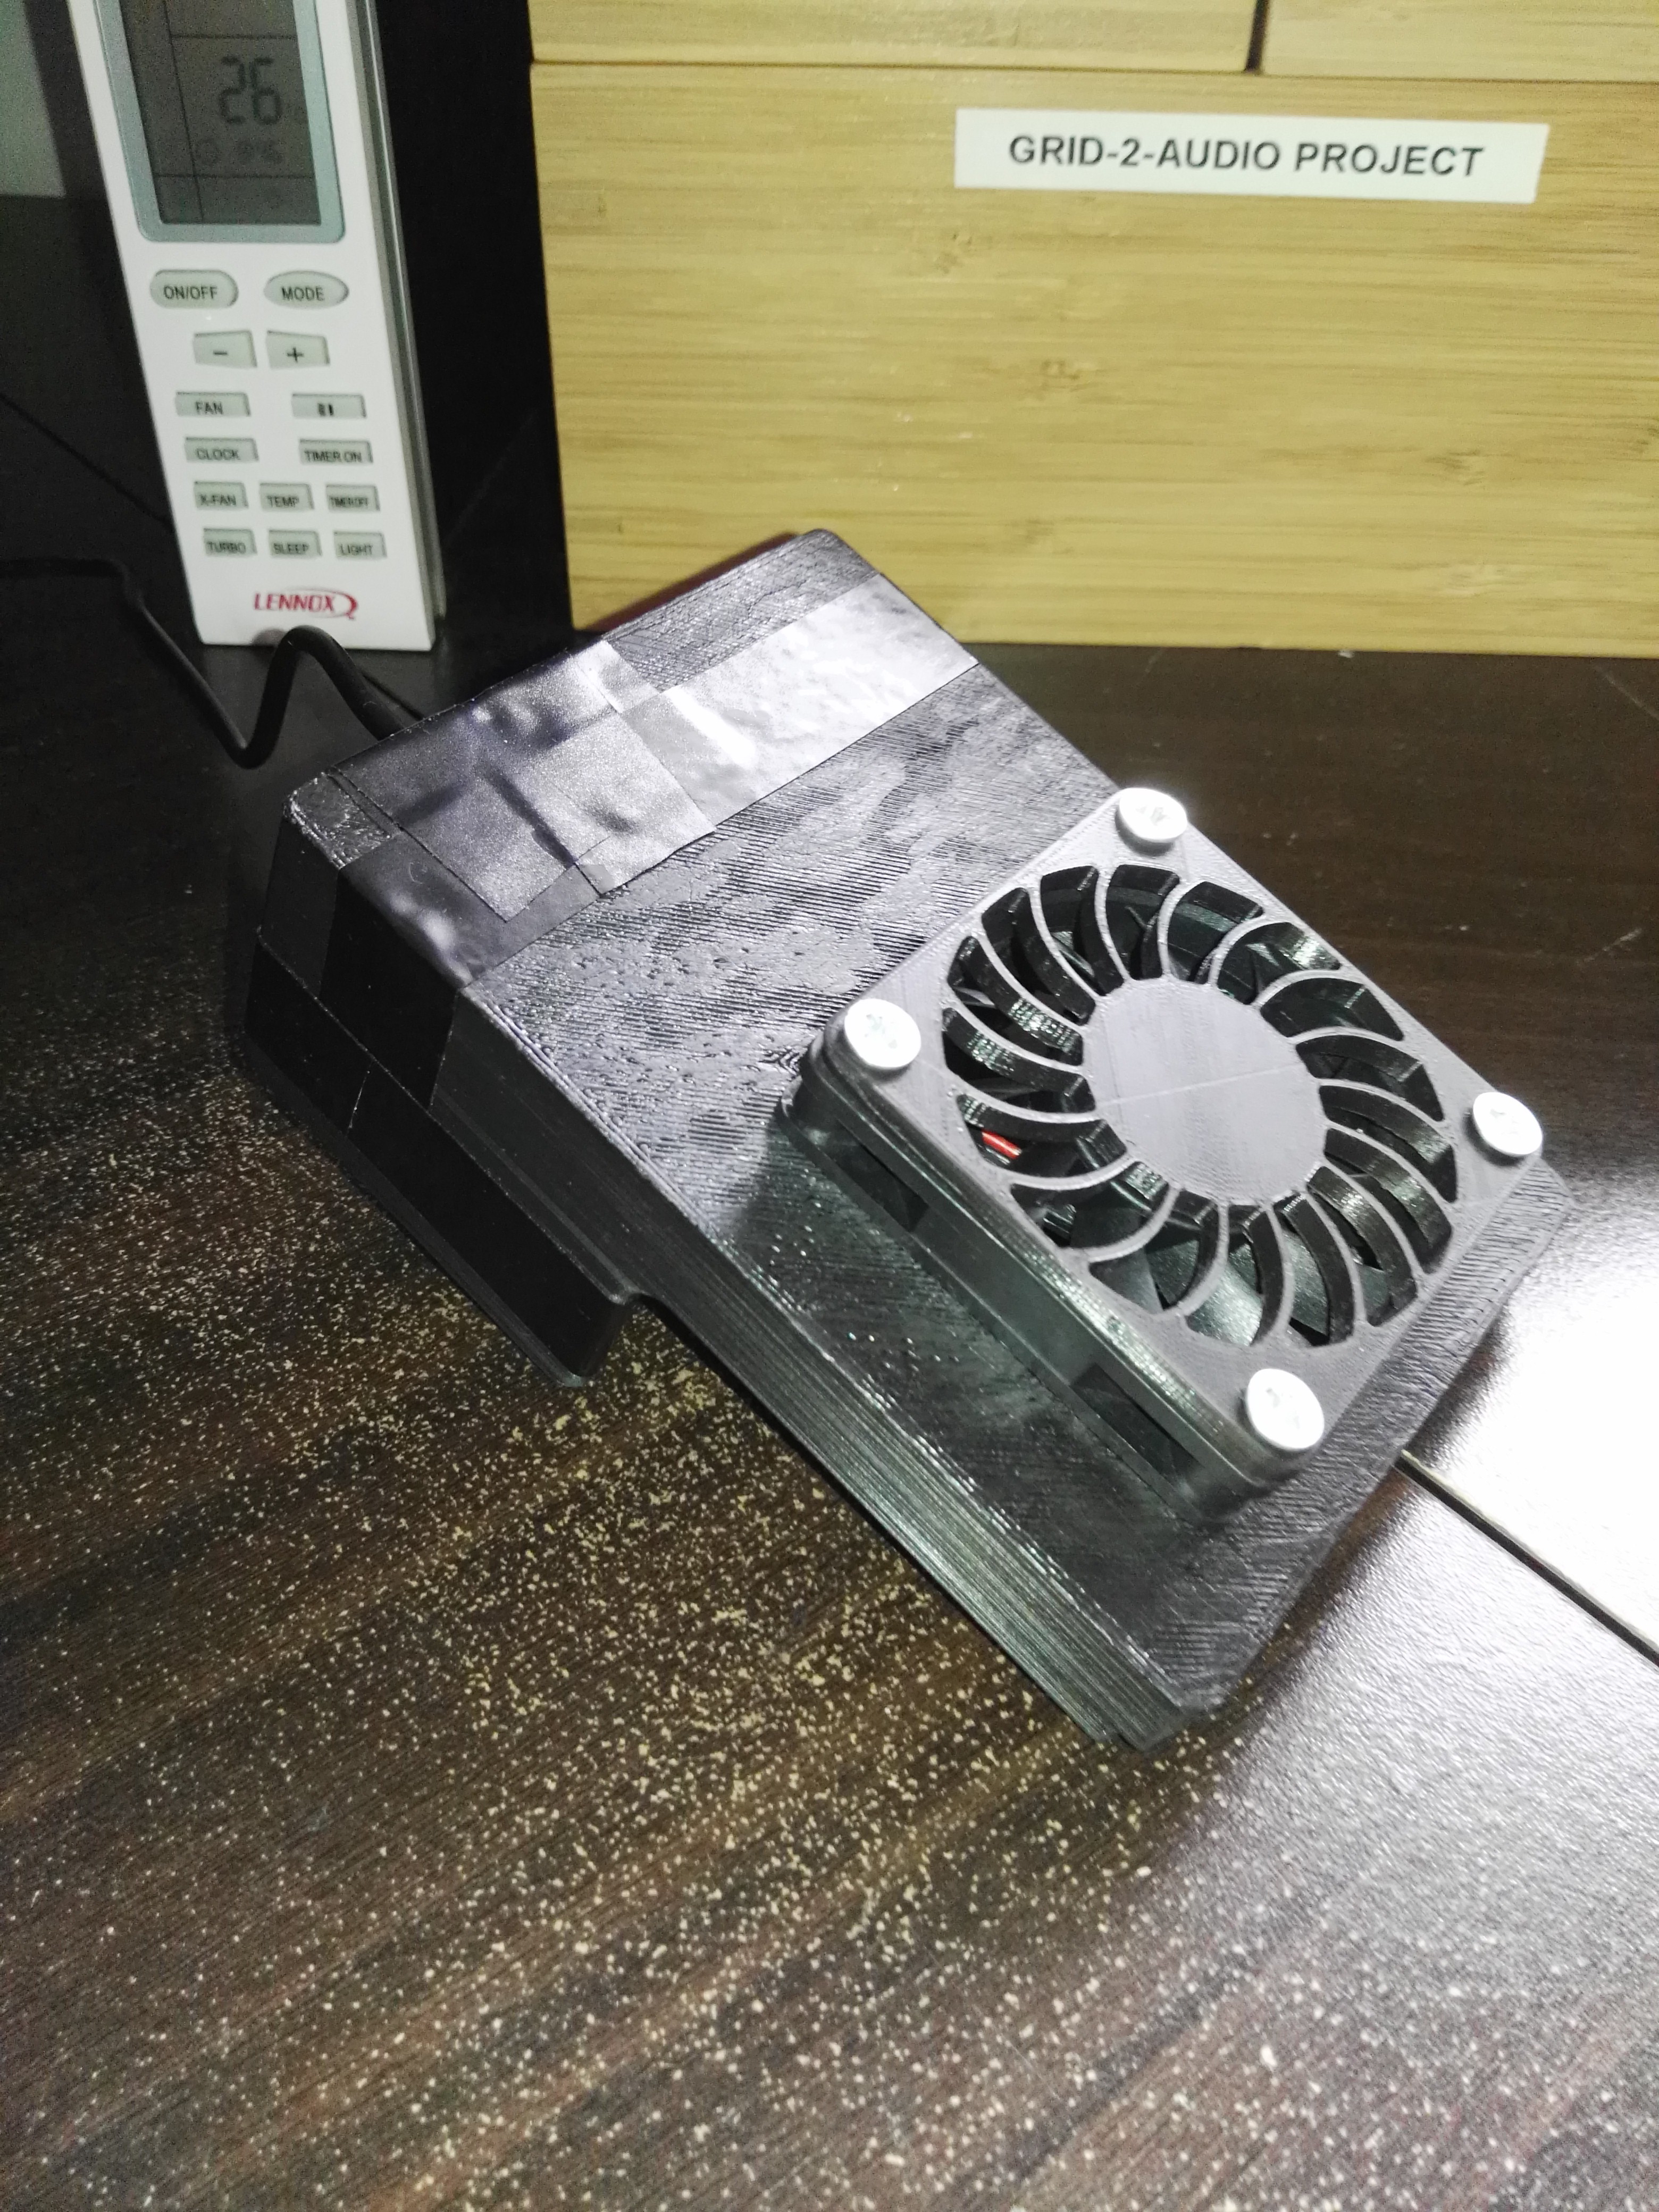
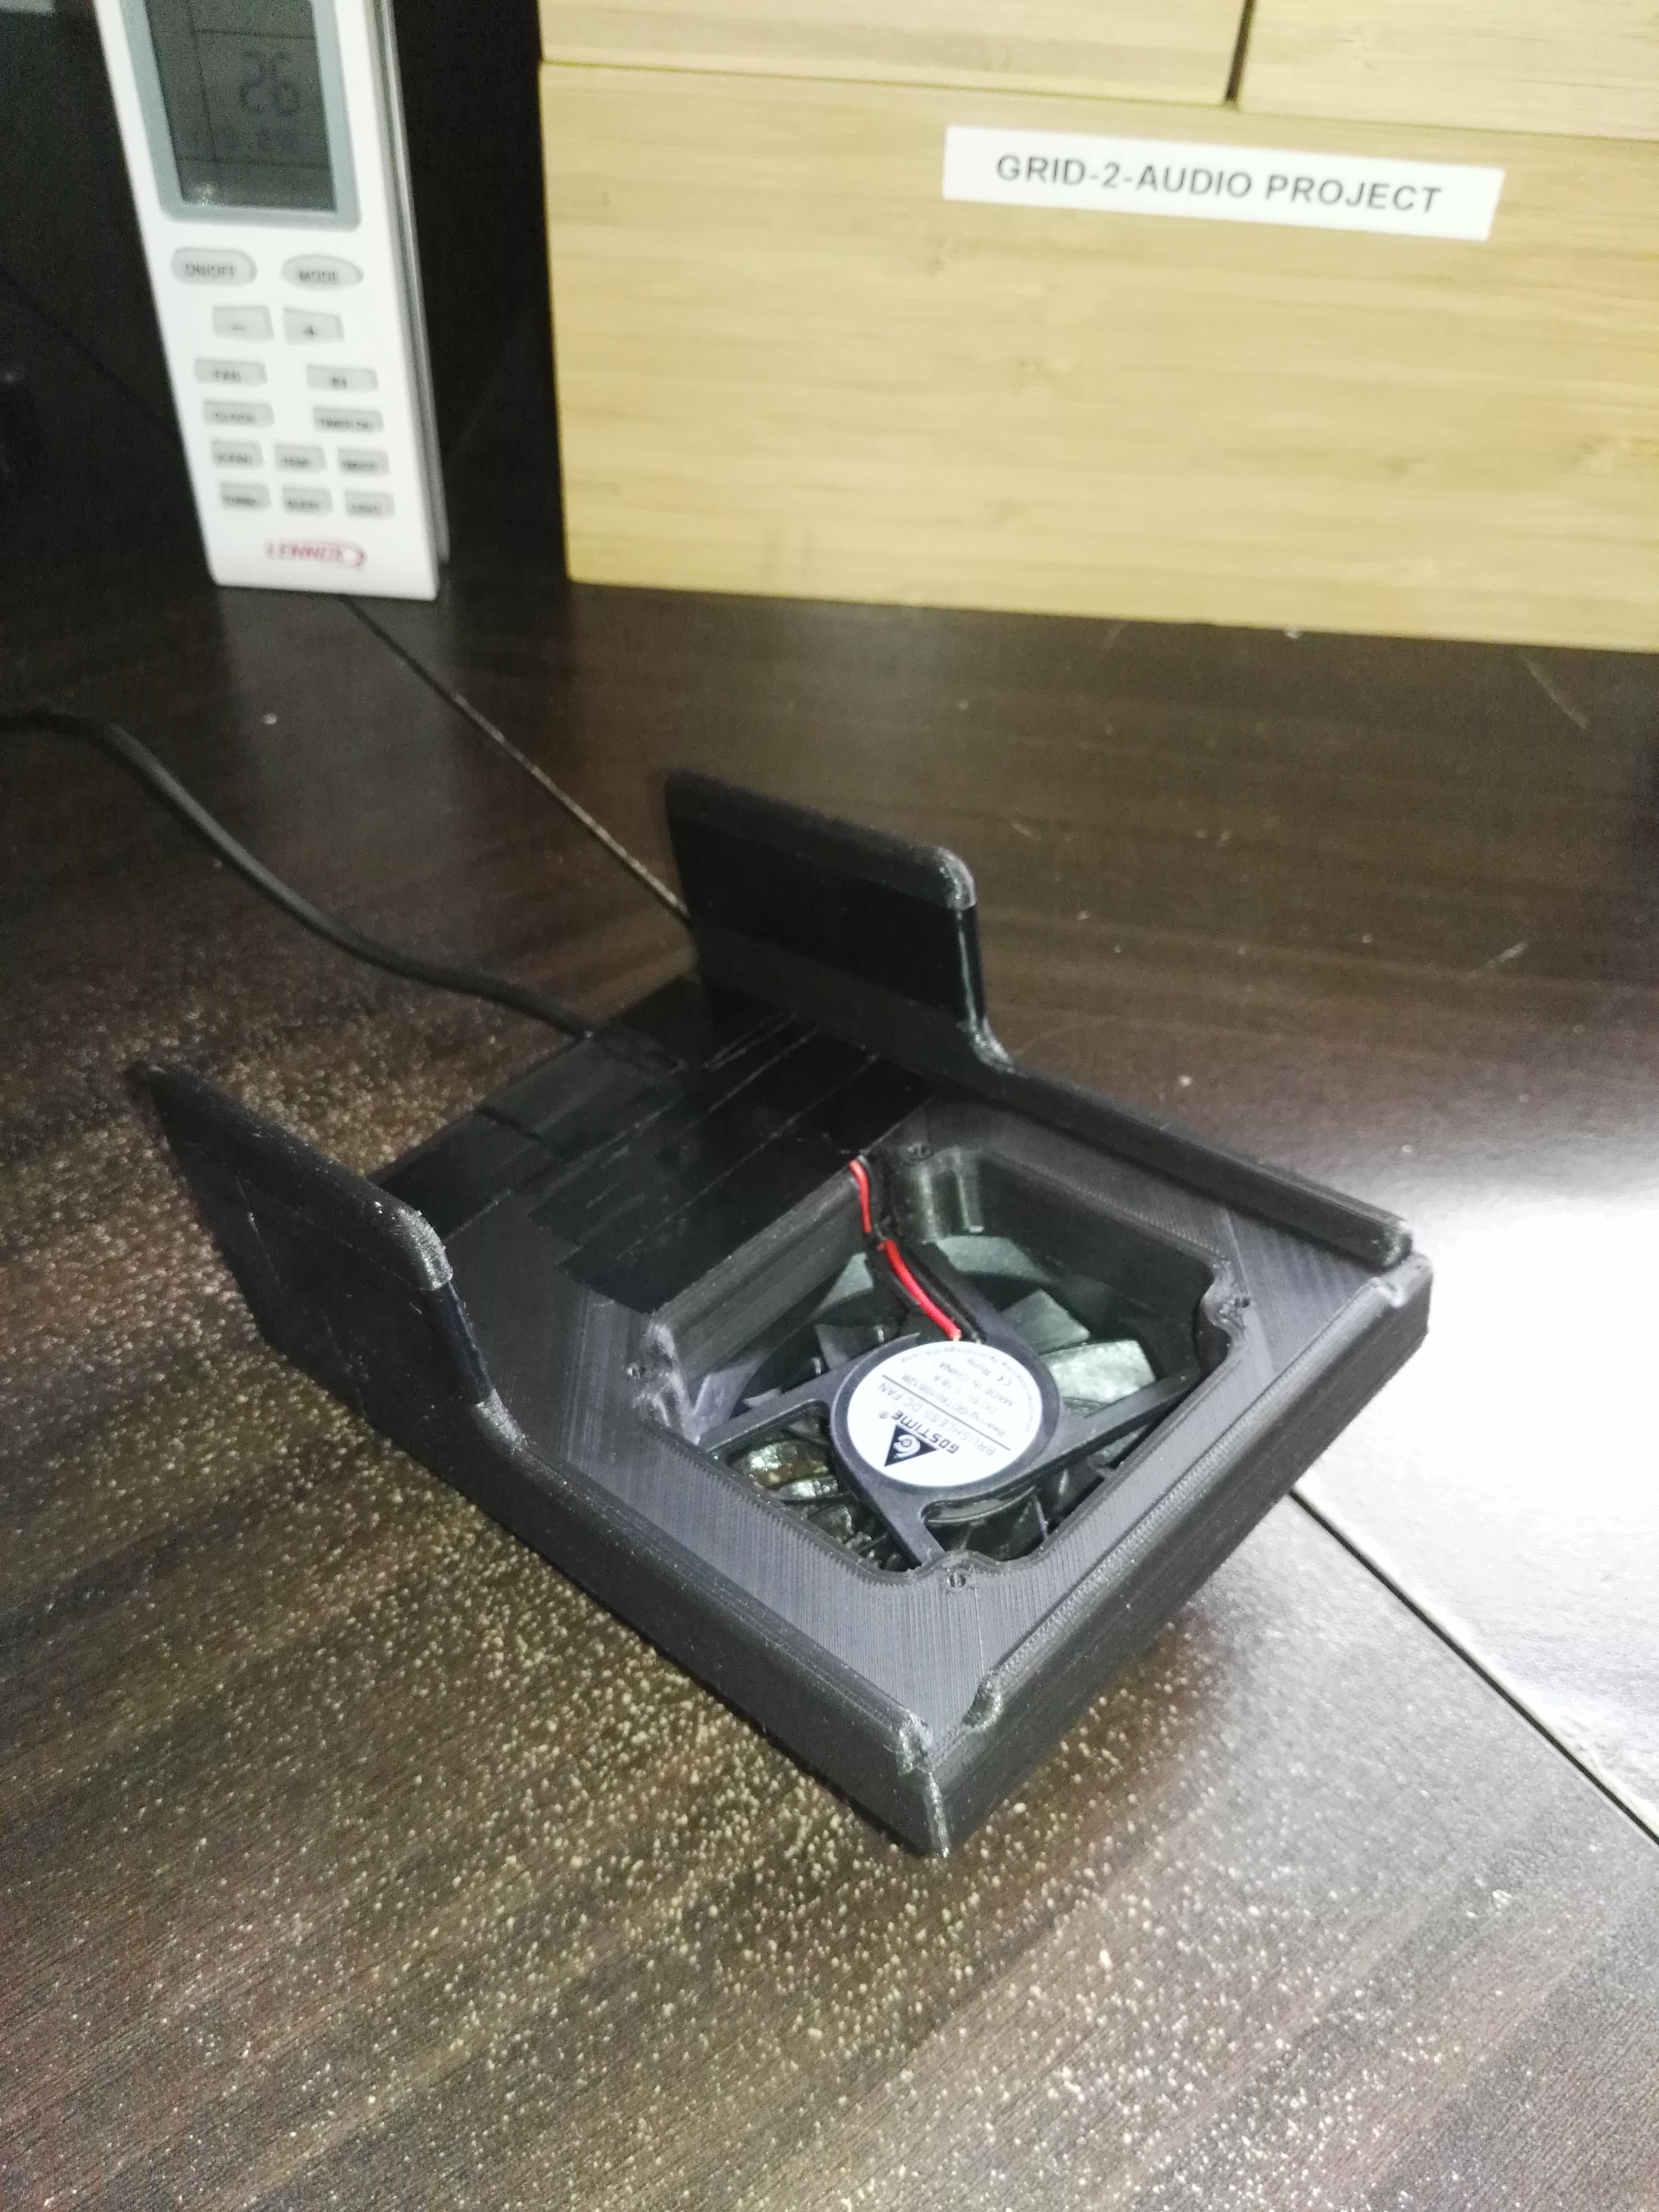
Heat Problem is Under Control
11/03/2018 at 07:04 • 0 commentsOkay, so after developing another version of the cooling add-on (that's far more mechanically robust and requires no printing supports), I have finally managed to keep the thing cool.
And by cool I mean stupidly cool - We're talking only a 5-10 degrees Celsius rise above the ambient.
It turns out it needed minimal air flow (of any amount) to move the little amount of heat it's producing.Here we go:
![]()
![]()
![]()
![]()
![]()
It's not the prettiest looking case accessory, but it certainly gets the job done via the 1W/5V USB fan. Now instead of going from 23C to 75C in 2 hours it goes from 23C to 30C in 20 minutes.
I also had a look at the waveform directly to see if the fan attachment was coupling any EMI to the measurement circuit. Turns out it isn't! I also tuned the output filtering pF capacitor a little to ensure that the RF/op-amp oscillation fluff was minimised.
Next step is the MATLAB stuff!
Grid-2-Audio
A convenient adapter to view the electrical grid waveform through your PC's sound card.