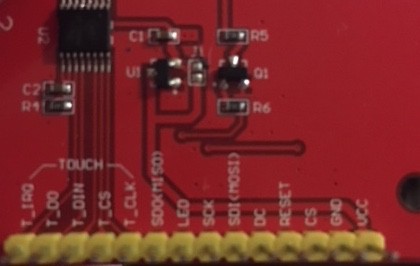
here are the pinouts for my display. might be in different order on other peoples versions but should be compatible with adafruit drivers. i did a side by side compare of my spi burst vs normal driver. it is already 2x speed (even without faster i/o). keep in mind that individual pixel writes will be slower unless using rectangle mode. rectangle mode only allows for one color at a time. i have methods that allow up to 256 colors at a time! (so far writing 16x16 pixels at a time with little command overhead, with this display resolution likely 32x32 at a time with scaling x2)
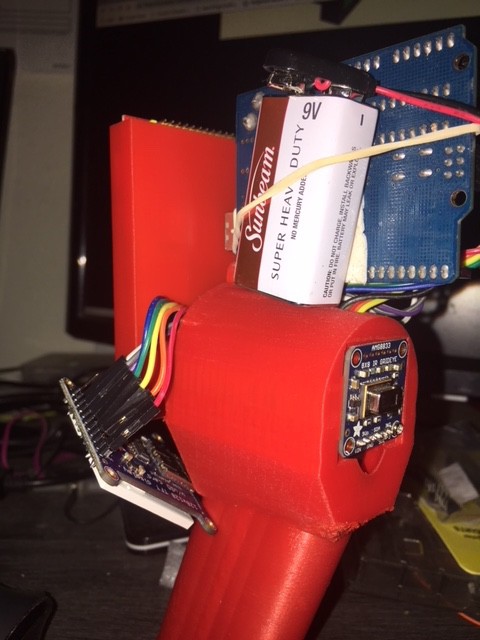
i used leds as voltage drop to pins, only. cs line requires pull down resistor in this case. (this also is why that led has enough current to light)
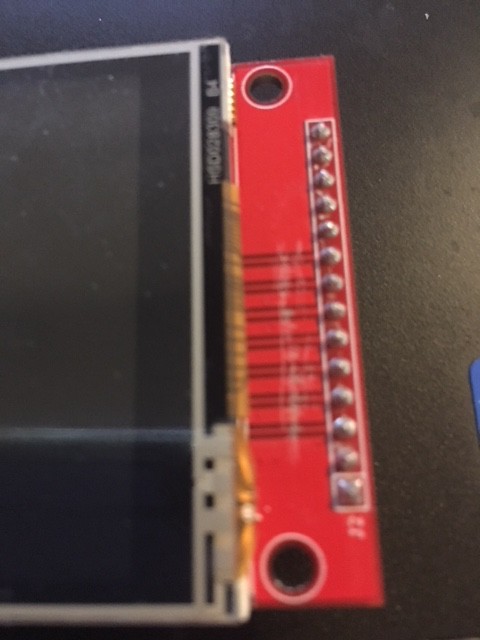
you can see i scratched surface to expose copper traces. i tested with continuity meter, and verified that wide traces are all to gnd, and narrow are to pins. will cut the traces except the one that is to backlighting, and solder in 2.2k surface mount resistors, and then another surface mount to gnd, this will half the voltage and i will no longer need to use a bread board or need the leds to lower voltage. read carefully when getting these displays. it was only 12$, but requires delicate work and at least 2 2.2k resistors per line that is input to display for devices that output 5v. adafruits displays have built in voltage shifters. (i'm not a sponsor, just pointing the headache free facts)
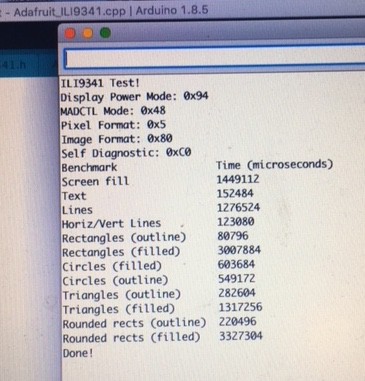
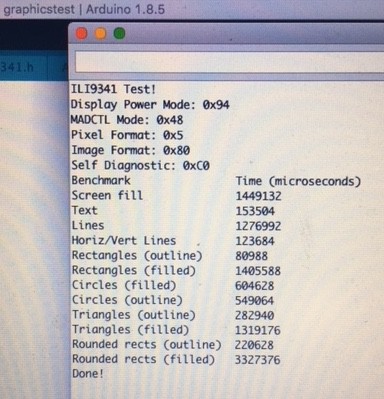
i tested adafruits drivers performance and rectangle fills writes time was about 3,007,884 microseconds
in the bottom picture with my optimizations just for spi burst, time was half that time. look st line for rectangles. this is the only one i used spi bursting in. what my method does is send spi, then do the work while spi is in process, when work is done it is ready for next spi. normal drivers send spi, wait for spi to complete, then process shifting and loading memory.
it will be a little faster once the i/o is pin writes is optimized as well. however since spi clock rate is the limiter beyond spi bursts, the i/o pin performance will not improve it as much.
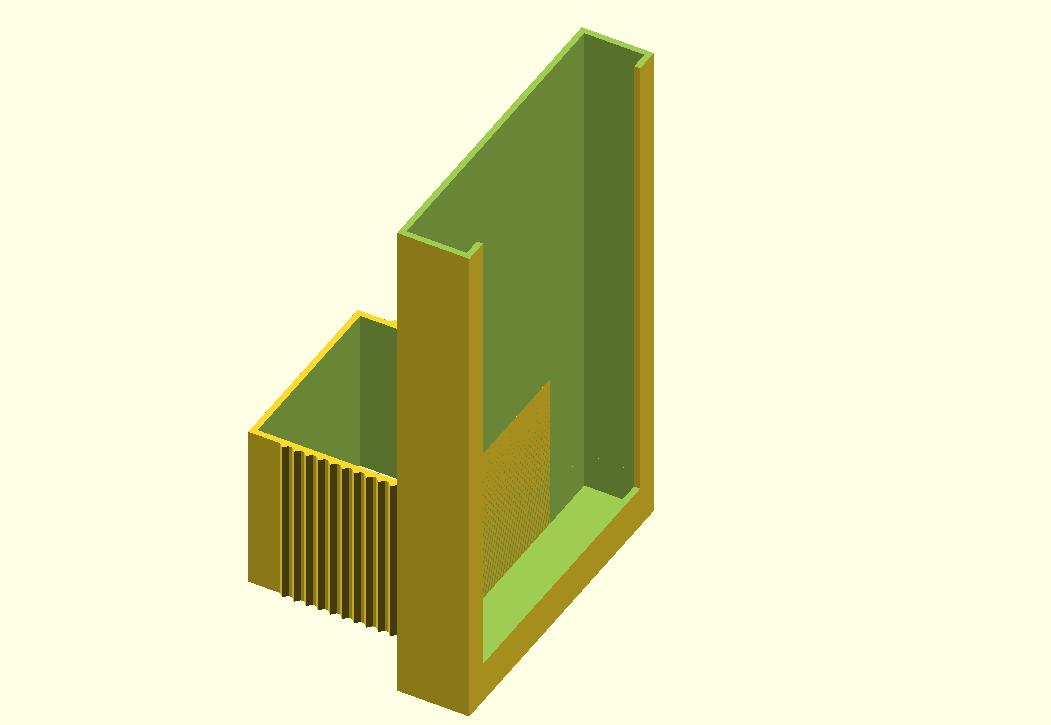
will be posting in mater of minutes to thingiverse file that has thermal camera files for printing. this allows a snap in component that holds in place a ili9341 or equivalent lcd display. since it is openscad a person can customize changes.
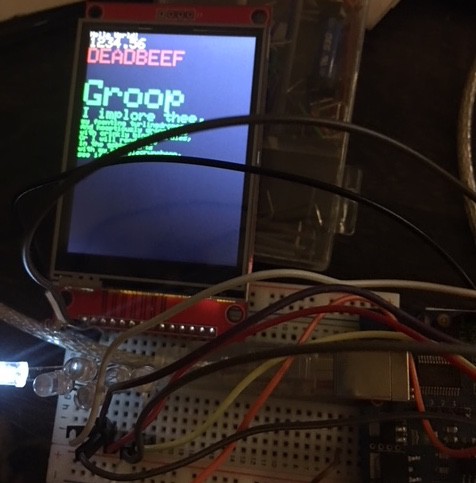
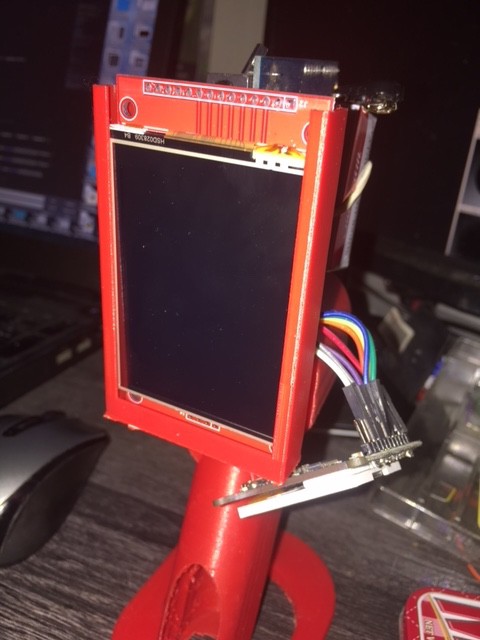
testing area, removing 128x128 and starting to hookup 320x240 display
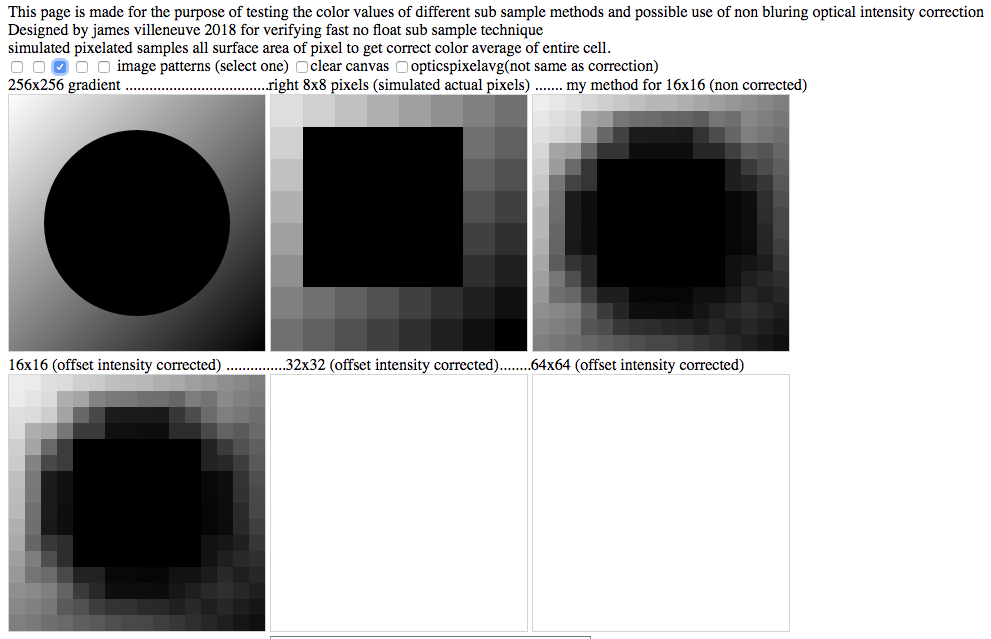
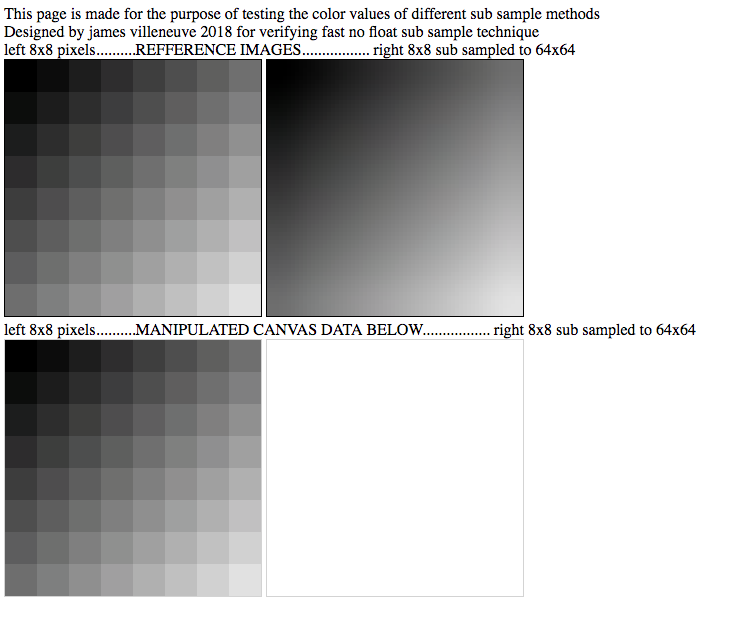
this does not effect the arduino sketch, this was an error in the simulation image. i made a mistake with image simulation on the java page i am making. as far as i can tell it is now fixed. today i was checking for bugs at why 8x8 simulation was not updating with certain effects, the mistake i made was the pixel per pixel averaging across the sensor was applied to the algorithm the image to the screen was processed with only 1 sample. so if it was center sampled this would be accurate, but not if entire area of pixel sample was averaged as in the algorithm. i'll leave my mistake in the log as it can happen during development. i will add comments to it as error, or errata. shit happens. sorry about that...... i look forward to feedback when i make the page avail for download.
this project has a lot of steps and complexities. i will directly support two display types with complete optimizations. these are the st77xx series (128x128) and the ili9341 series (320x240), for those with different displays use the wrapper that translates my commands into instructions that use setwindow() and pushcolor() are somewhat standard and universal commands on adafruit displays, since i will only spi optimize drivers for ili9341, and st77xx, other display types will only be able to do 3-7 fps, but parallel mode should work quicker as these do not use spi. again the wrapper instructions are used if this is set in my sketch file
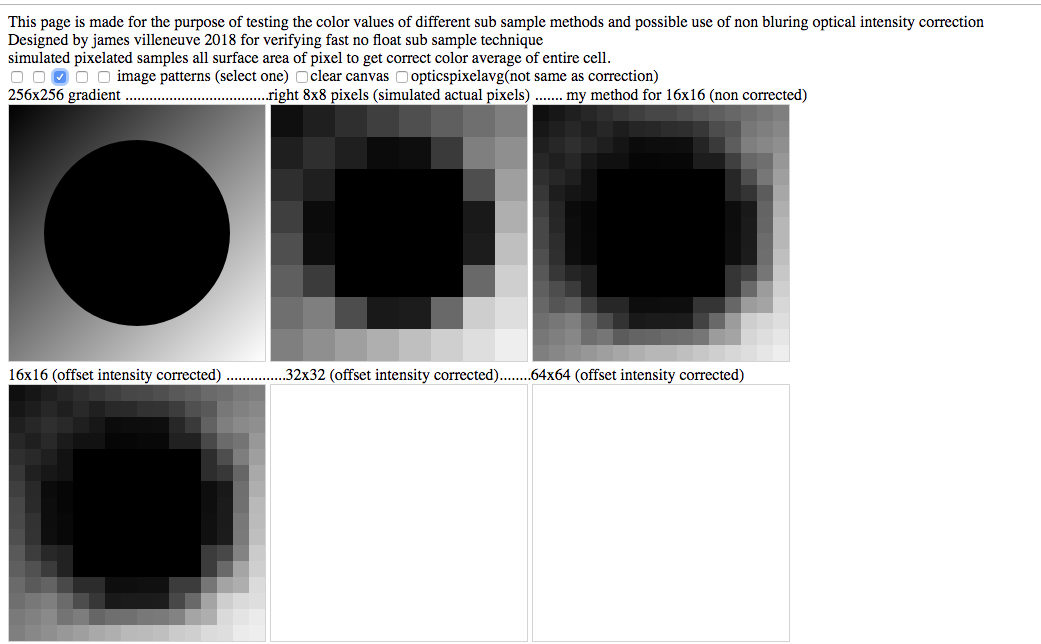
This log contains an image that has errata. specifically image 2 is not correctly show. i updated the algorithm to process image as a surface area so entire 8x8 grid each section is averaged depending on intensity, however the image was still processed using a single point sample. so in this case the top image middle should be only regarded as how a mistake can occur during development of tools, or processes. it has been fixed after testing and was changed within a day.
below is from original log file.
this shows a sample circle, and how the sensors read the data. it shows how useful interpolation can be to get it back (keep in mind that this sensor tool might change in how it looks when it is uploaded, but it does give a good argument of why you want to use interpolation.
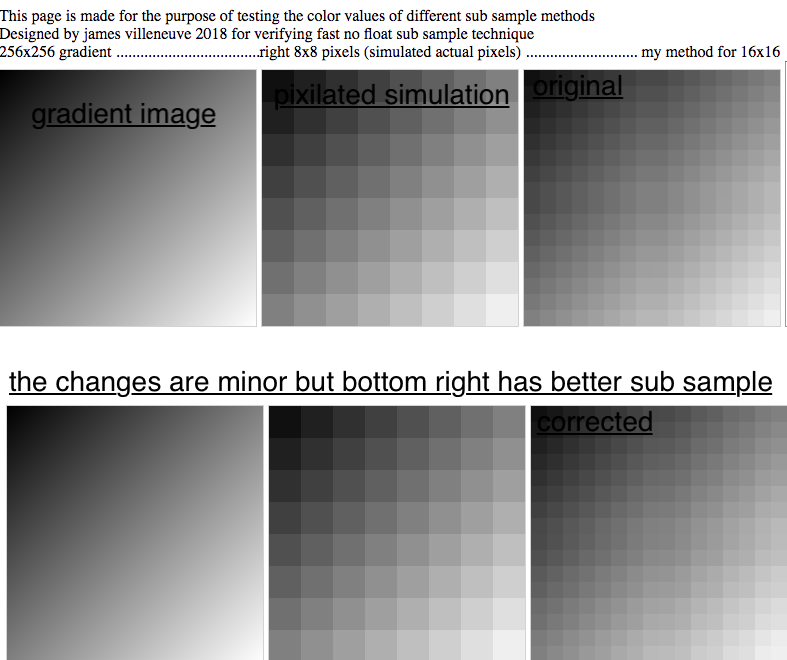
I'll be listing a page along with a new article soon on fast non float sub sampling. until now i've been fixing color errors by trial and error, sometimes taking several days and changing several variables to hack a fix together for different resolutions. this page will help anyone trying to increase resolution find how and if methods are sound. what this shows is how the original 16x16 sub sampling works on my non float method. (this is how it looks pre processed. you can start to see a + sign in center, and notice the center is too much averaged out. (i fixed this with a slight blur as a hack) but now i know it was that i need to offset the calculations on the left right up/down areas of display (my method goes from outside in in each quadrant)
This javascript page was created because without it i can not get 128x128 resolution or higher in sharper detail without causing artifacts, or significant blurring.
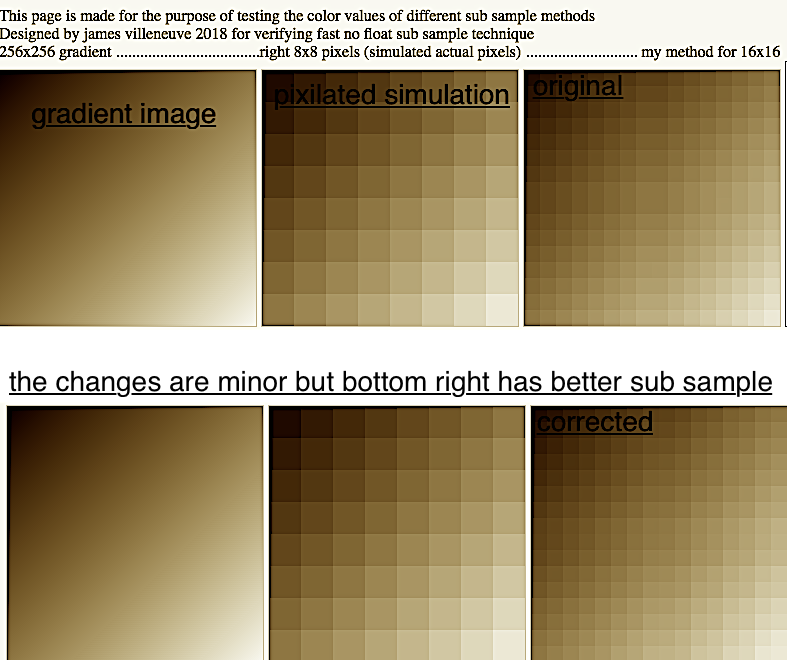
you can tell by the bottom picture the middle pictures are more defined. 32x32,64x64,128x128 modes are not in simulation yet..... so i expect improvements in the algorithms used for 64x64 and 128x128 that exist in thermal software currently
view image full size by clicking on it to see the gradient details. I'm also going to output numbers to compare results and import a color table and several gradient images to test.
I think this javascript web page will save a lot of time troubleshooting.
the pixel intensity is offset from measurement because the pixels are offset when processed. so it is more than just averaging in my method. and it needs a further offset for angle of image from sensor because it is looking at an orthogonal image (each pixel is at a slightly different angle in amg8833 it is 5.6 deg) now i can compensate the thermal camera interpolation with adjustments for angle that can be given from sensor specs. these changes will be in next version of software. i'll release it within a few days.
* as long as display driver includes pushpixel() and setwindow() commands
i've created a wrapper that converts my multi pixel commands into commands that are universally recognized by adafruit spi and parallel display drivers. they perform about 7-10 times faster on arduino that regular drivers and provide compatibility for test purposes. the spi optimizations are lost in this wrapper as doing the optimizations for spi requires modifying the drives themselves.
to allow this wrapper to work change
//#define workAnyAdafruitDisplay true
if you have an st77xx display set it to false because the other method is still 2-4 times faster
going to 64x64 sub sampling i had to fix some artifacts. this was done with some tricker in the image processing, but i want to see more about what is or is not going on. i'm creating a java program that will plot out differences in images from different sub sample methods. the goal is to improve color accuracy of pixels when iterated several times. it is important for 128x128 since this uses no buffer and all data in the end is generated from upscales of original data and side pixel information. the non floats method i use is less blurry but color differences per 8x8 or 16x16 space cause blockiness. i'm trying to resolve why this happens, and also have data for an article soon to be uploaded that shows how to quickly upsample data with almost no loss in performance, or memory footprint. it is more impressive to those that actually will use it. it has very little memory overhead and it is several times faster than other versions of sub sampling.
currently sensor outputs to terminal and shows a visualization of all sensors in a grid pattern similar to a picture. i have added ability to change hz, ad resolution and switch between continuous and step mode (single shot mode) as well as read sensor values and compare them to values stored in progmem (created another program that extracts them for cut and paste)