mick
mick-
Ui Design
10/24/2021 at 20:58 • 0 commentsI've designed the device with two modes, the default mode is passive where the device can sit listening for events, process and then repeat. The other mode is active or clinician mode which is intended for medical professionals to submit samples to help build out the model and test patients.
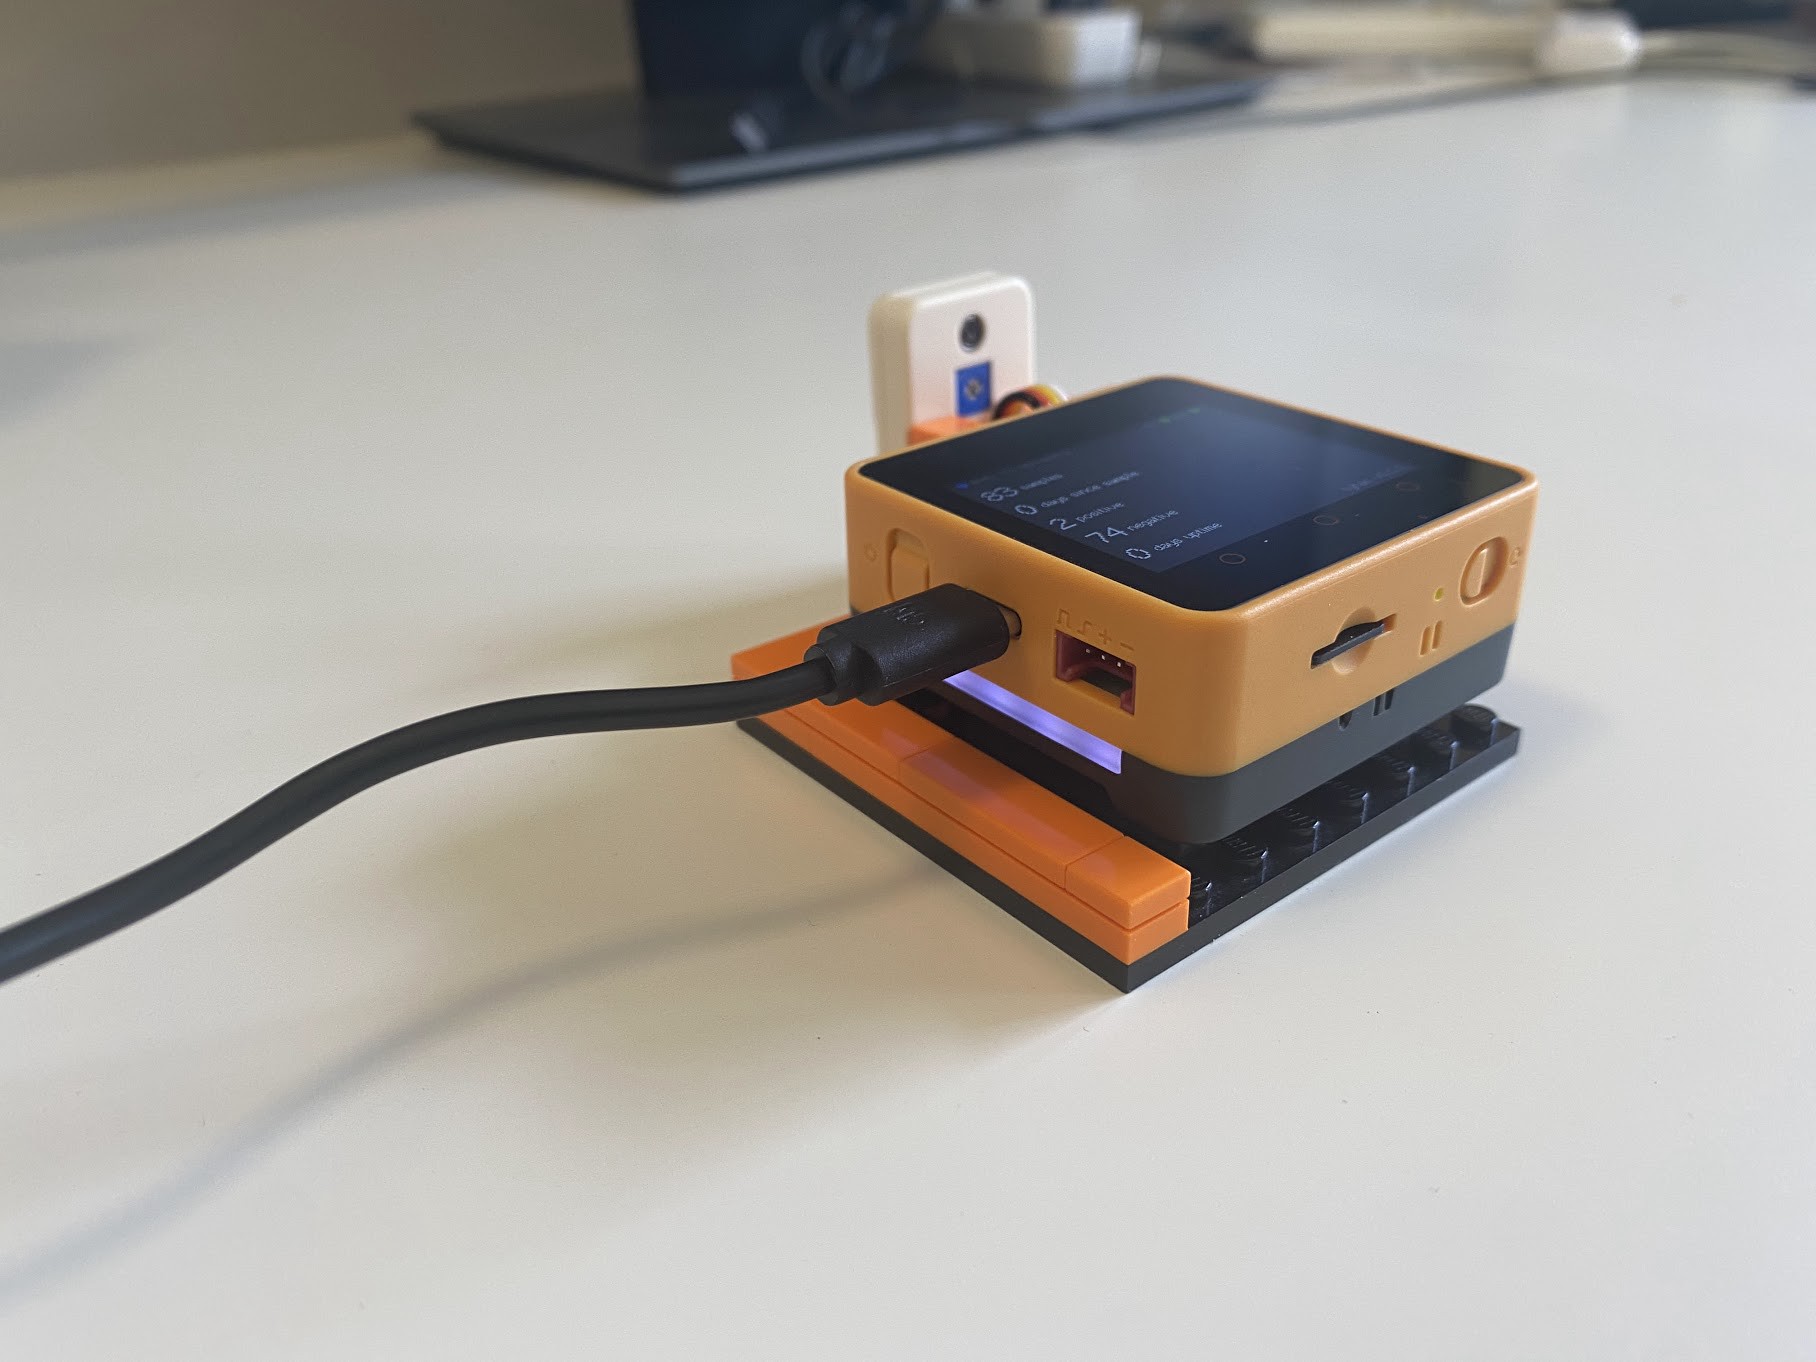
The M5 Core2 AWS EduKit has three circles at the bottom of the unit, these are intended to buttons. My initial tests to go through the different modes used these buttons so that I could keep developing. But, the buttons are also capactive touch buttons and use a simple co-ordindate based system to know when to activate. May as well have some fun and design a UI.
Library or roll your own?
I had a quick look to see if there was a library for Arduino already that could be used, I was after UI elements like buttons etc to help reduce time. I found a few that looked quite interesting but overkill for what I wanted. I went back through the examples for the EduKit and it ships with library that you can use that looks straight forward enough.
Buttons
It's actually pretty easy to draw objects with the EduKit and because we know that we can use the co-ordinate system for activation we know that linking the objects to actions will be simple enough.
M5.Lcd.setTextColor(WHITE);
M5.Lcd.drawRoundRect(50, 100, 100, 50, 10, tyhacBluePrimary);
M5.Lcd.fillRoundRect(50, 100, 100, 50, 10, tyhacBluePrimary);
M5.Lcd.setTextSize(2);
M5.Lcd.drawString("submit", 63, 107, 2);
I initially started with a plain rectangle but later found you can draw a round rectangle and provide a radius int as a pararmeter, gives the UI a more modern look I feel.
Status indicators
I've added a bunch of serial output logging to help troubleshoot how the device operates and understand the different steps it's going through. This is great while its plugged in but how do you know whats happening when the device has been deployed?
I like the idea of simple dot indicators which I had seen on one of the demo projects and though it was quite simple and effective. We know that drawing objects is straight forward and this is just a circle with different colors and some static text.
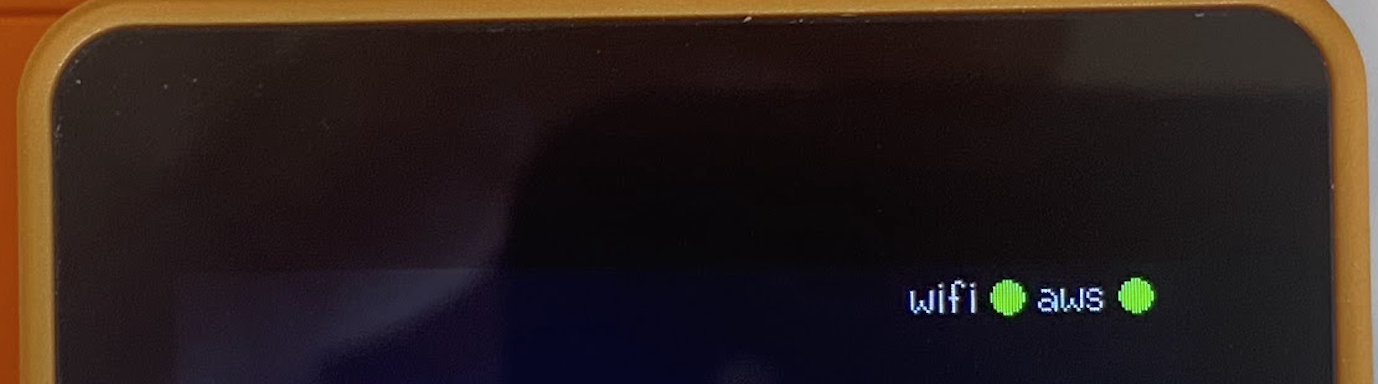
I've decided to use the whole top bar as the status area, I think this makes sense when you think about how people use devices like mobile phones.
The dots provide a status for the network connectivity, wifi for wireless network and AWS for the AWS IoT MQTT connection as it maintains a pub/sub messaging system. Both of the dots change color with the status e.g. green for OK, orange for connecting and red for critical error.
I've made the status bar common across all screens, which gives the user a consistent feel.
I ended up adding additional messages to the status area, this matched the serial output more or less. I did this after lots of use of the device, I personally wanted to know more about the current status and steps the device was going through and I didn't want it to block the display.
Again, I've tried to stick to what seems easier for the user, simple messages and blue dot indicating informational messages. The message bar will display messages like connecting, uploading, requesting url etc.
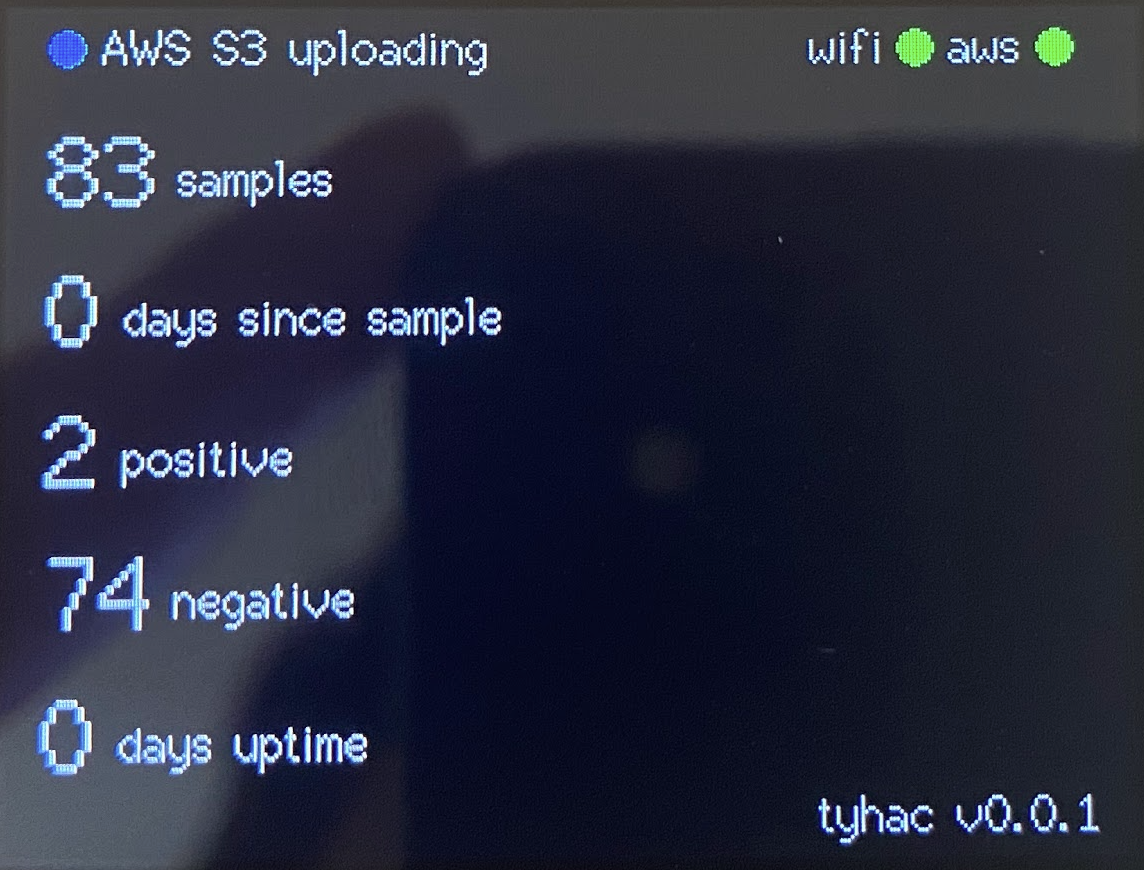
The Dashboard
After a lot of use I started to wonder about how many events had been through the device, I didn't want the user to have to go through a web page for basic stats so a simple dashboard displaying some simple metrics would be ideal.
The dashboard is a great overview of the samples, I'm really happy with how it turned out, it doesn't matter which mode you're in when you return to the dash the device will request the current stats via AWS IoT.
I had a bit of trouble with the text spacing, as you can imagine the integer and the string need to move relative to the size of the integer. I've created a simple function that is called when rendered to dynamically adjust the spacing based on the length.
 // 1, 10, 100, 1000
    // 1, 2, 3, 4

    if (text.length() == 1)
    {
        return 32;
    }
    if (text.length() == 2)
    {
        return 47;
    }...
The vertical spacing also took a while to position everything so that it looked correct.
Changing modes
As above, the default three circle buttons are being used to change modes. I liked this because it didn't rely on screen elements. I ended up expanding on the positioning system a little by creating "listeners" for all three buttons. I'm only using two, the left and the right but added the middle for future expansion.
void buttonListeners(TouchPoint_t pos)
{
    if (pos.y > 240)
    {
        if (pos.x < 109)
        {
            tyhacMode = 0;
            buttonLeftAction();
        }
        if (pos.x < 192 && pos.x > 109)
        {
            // Spare button not used
            buttonMiddleAction();
        }
I found the positioning system to be reliable and had no issues with the buttons or elements missing. You just need to
-
Inference
10/24/2021 at 10:27 • 0 commentsThe inference endpoint and deployment used in the notebook earlier creates a 24x7 endpoint using an ML EC2 instance. I'd prefer to do the inference using Lambda, with the previous s3 pre-sign we know that we can integrate with AWS IoT easily and provides a tidy little design.
Lambda Inference
The lambda inference program follows the same inference container I've supplied in the source code repo. This helps to reduce the code and understanding. The inference is simple enough:
def model_fn(model_dir):
    """
    Loads model into memory.
    """
    logger.info('model_fn')
    path = Path(model_dir)
    learn = load_learner(model_dir + '/export.pkl')
    logger.info('TYHAC: Model has been loaded')
    return learn
As you can see above, it's just loaded the pickle file. This file is the trained model discussed eariler in the logs.
Once the model is loaded it follows this simple flow:
- Input object
- Load the object (audio sample)
- Predict
- Run the prediction against the object
- Output
- Return the prediction results
This works well enough and only takes a second or two. Perfect for this use case and proves that for this the ML EC2 instance isn't needed.
- Input object
-
RGB light strips, essential
10/24/2021 at 09:39 • 0 commentsI did a bit of a side step to have some fun with the device after the AWS S3 upload saga which was a bit of nightmare. The AWS EduKit comes with RGB light strips either side of the device which I think would be good status indicators.
Fastled
Looking at the M5 examples, a popular Arduino library fastled appears to be a good fit and is pretty simple to use, a simple example from the fastled repo:
void loop() {
   // Move a single white led
   for(int whiteLed = 0; whiteLed < NUM_LEDS; whiteLed = whiteLed + 1) {
      // Turn our current led on to white, then show the leds
      leds[whiteLed] = CRGB::White;

      // Show the leds (only one of which is set to white, from above)
      FastLED.show();

      // Wait a little bit
      delay(100);

      // Turn our current led back to black for the next loop around
      leds[whiteLed] = CRGB::Black;
   }
}
This looks easy enough, if we look further there is a neat little enum with a bunch of common colors that should make it easy to use and it is...but, there appears to be an issue with the RGB order in the M5. This means, I know I need to pick RGB colors and it's best to split the code out further, github bug.
The cool thing is that each led is set one after the other, setting a delay can add a pretty cool effect that shows almost like a loading lights which you can again loop. I've done this for the bootup and other sequences.
Green Blue Red
The order is actually green, blue, red for the M5, a simple change to the order is all that is needed:
void setRgbColor(uint8_t green, uint8_t blue, uint8_t red)
{
    for (int i = 0; i < LEDS_NUM; i++)
    {
        ledsBuff[i] = ledsBuff[i].setRGB(green, red, blue);
        FastLED.show();
        delay(100);
        FastLED.setBrightness(100); // turn down the brightness, blinding at night
    }
}
RGB lights
Here are the lights working showing the white lights which I've configured to be sleeping / idle mode lights:
![]()
-
Arduino S3 upload, should be easy?
10/24/2021 at 07:33 • 0 commentsWhy is this so difficult!!! I've managed to create a few different working sets so far, one to trigger an audio event, one to record a wav file and now I need to upload that file to s3.
There are several projects on the internet that are based on the ESP32 but file uploading to s3 seems to be rare. I guess it's an odd use case?
Headers!!
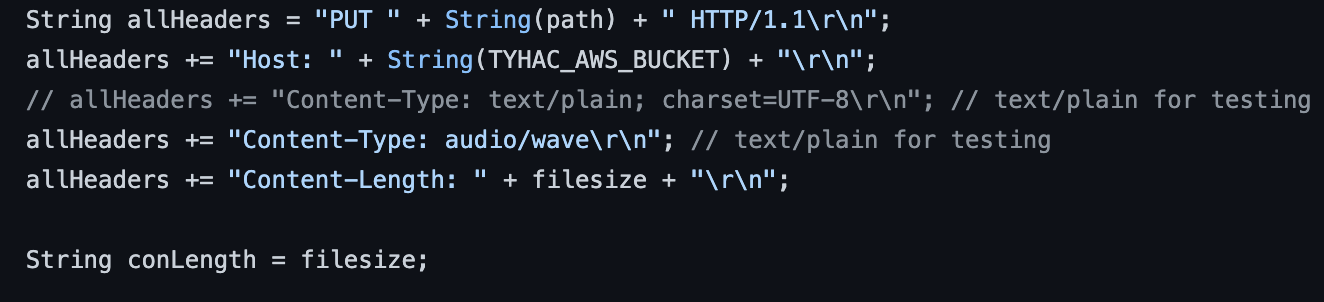
After looking at every examples on the internet and reading over the AWS documentation it was clear that headers play a huge part here. What I mean is the HTTP headers that are sent during the upload:
You can the headers here, now, the other thing noting is the size, many of the examples on the internet calculated the size including the headers this did not work for me. Simply using the file size from the object on the SD Card and using that for the content-length did the trick!
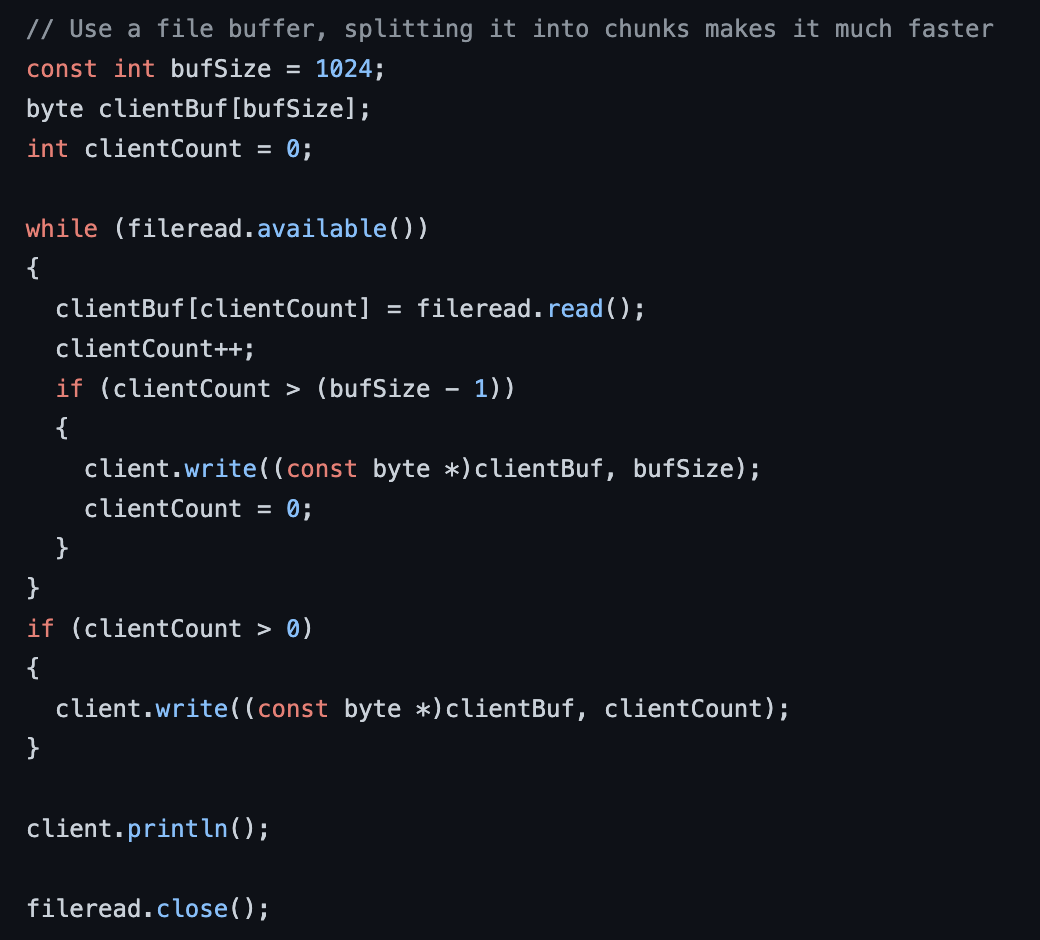
Chunking
Splitting the file into chunks for the upload was also required for the esp32, I could not simply upload the single file:
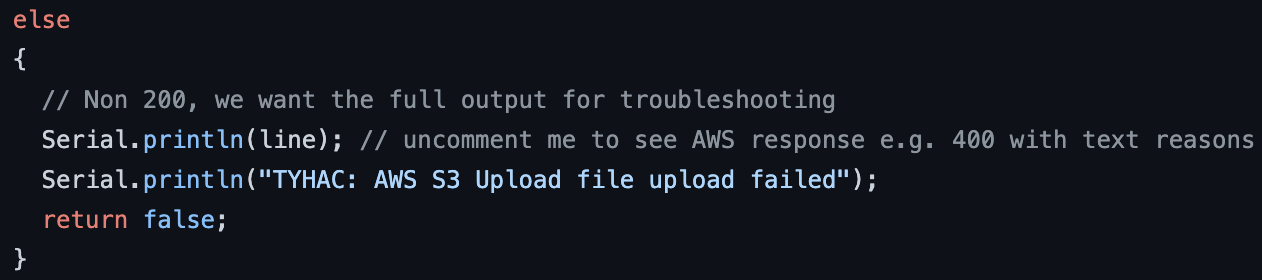
Debugging was key
Many of the examples on the internet remove the useful output from the remote server, this information is key to troubleshooting. Think about when you upload a file, often you get an error code back but sometimes you'll a text string as well. AWS provide both and the information is very useful:
I did still have issues once the file was uploaded but after downloading the files and inspecting the header I could see additional carriage returns that weren't meant to be there, simply updating the upload code fixed the problem.
-
AWS API GW vs AWS IoT
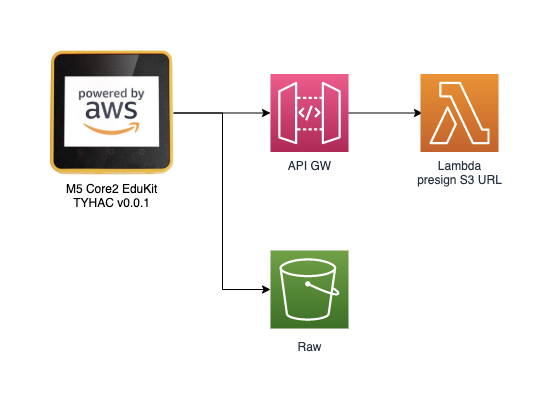
10/24/2021 at 07:18 • 0 commentsI'm pretty familiar with the AWS products, I know that the tyhac device will need to upload audio samples to the cloud. To do this I would like to store them in an S3 bucket, to use an s3 bucket I want to make sure it is protected.
I need a way to ensure the right users or devices are uploading the bucket. The API GW can be used with an API-KEY and a Lambda function to generate an S3 pre-signed URL, this URL could then be used by the device to upload the file. Sounds easy enough:
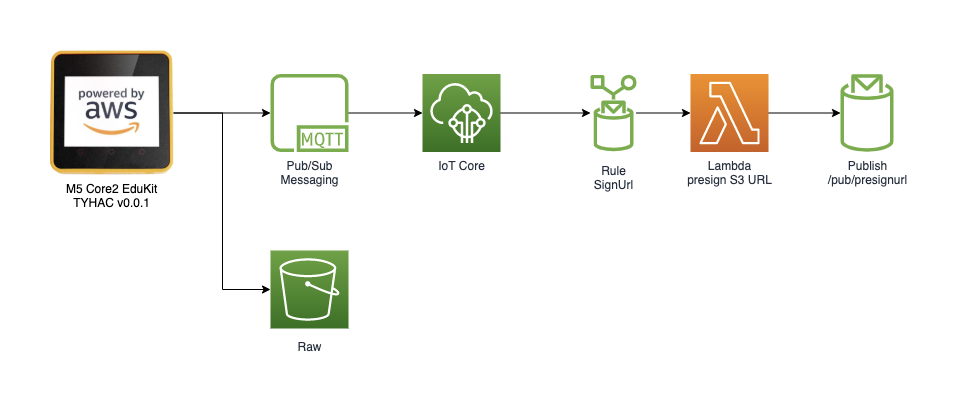
AWS IoT
I want the device to be securely enrolled as an IoT device. The device itself should use certificate based authentication, AWS IoT provides this service and more. Can we just use AWS IoT instead of API-GW to handle the pre-signed url? Yes, there are many actions you can perform using rules and because I want to instead data into a database as well this will provide a single service entry point that is more secure and easier to maintain:
-
M5 Stack Core2 python or Arduino?
10/24/2021 at 07:10 • 0 commentsWhen I originally purchased the M5Stack Core2 AWS EduKit I noticed that you cloud choose a few different languages. Because the machine/deep learning part would be developed in python and I was comfortable with it I wanted to use python this would just make it faster to prototype and move on.
M5 UiFlow
So, M5 UiFlow is like a blocky web tool to develop with the M5, this IDE lets you drag and drop or you can write with python. It's pretty basic and startin to understand what the project requires I felt this was not going to work for me. The initial test with the LM393 proved that, the Mic Unit was not supported which meant I'd have to develop something to support it. After doing some initial testing with the internal mic I also found that python was not going to be a good fit here. Arduino was the next best thing as I had used it in the past so figured this would be an easier transition.
LM393 Mic Unit
I bought the mic sensor thinking I would be able to record audio with it. Boy was I wrong, after many failed attempts it was clear this was not possible. The purpose of the device is a sound sensor, which is still good in my case as this would reduce cycles listening for events, instead I should be able to use it to trigger the recording.
-
More data and data imbalance
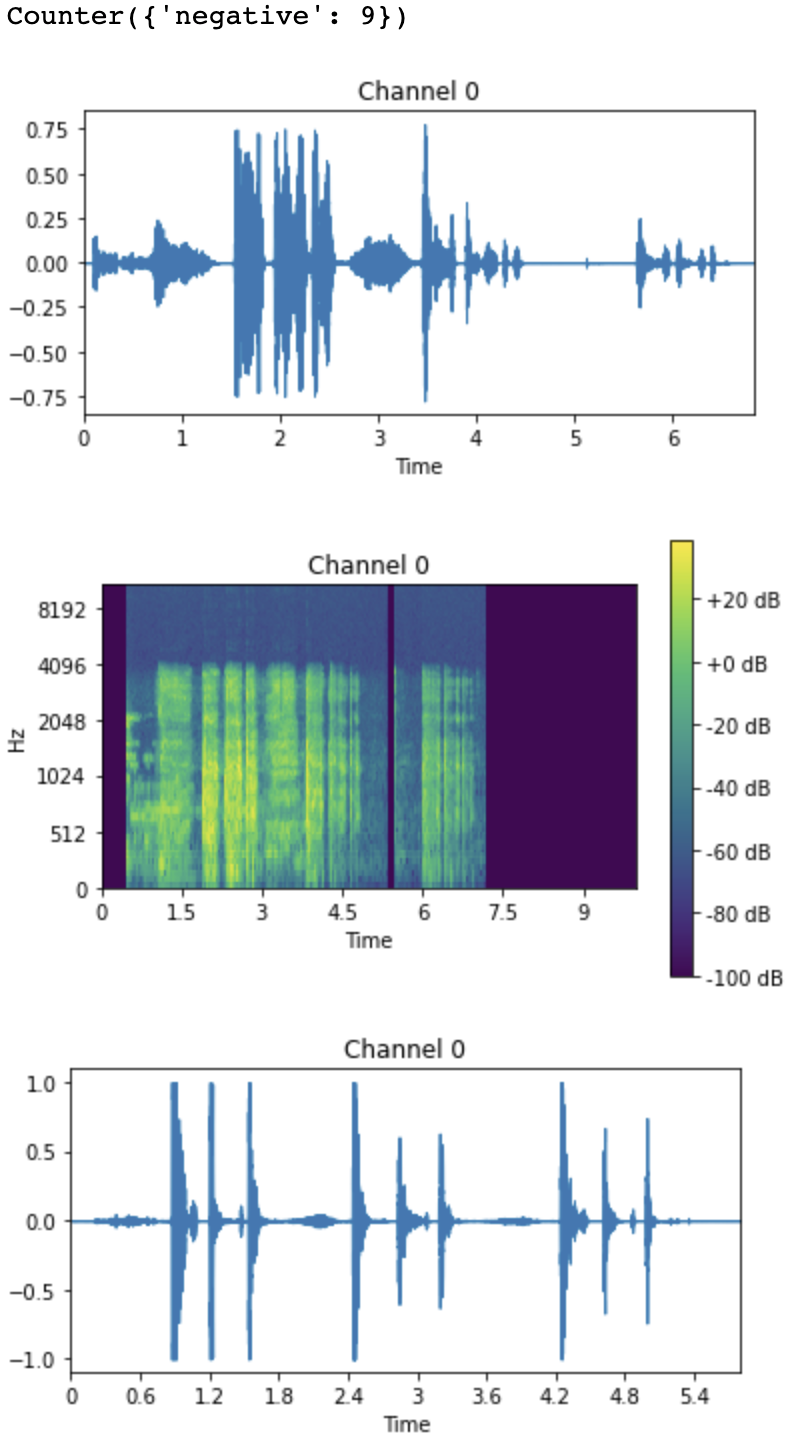
10/24/2021 at 06:57 • 0 commentsThere just isn't enough data, I've combined both the datasets from virufy and coughvid and there is little data, the early results from fastai are better but still not great.
More data
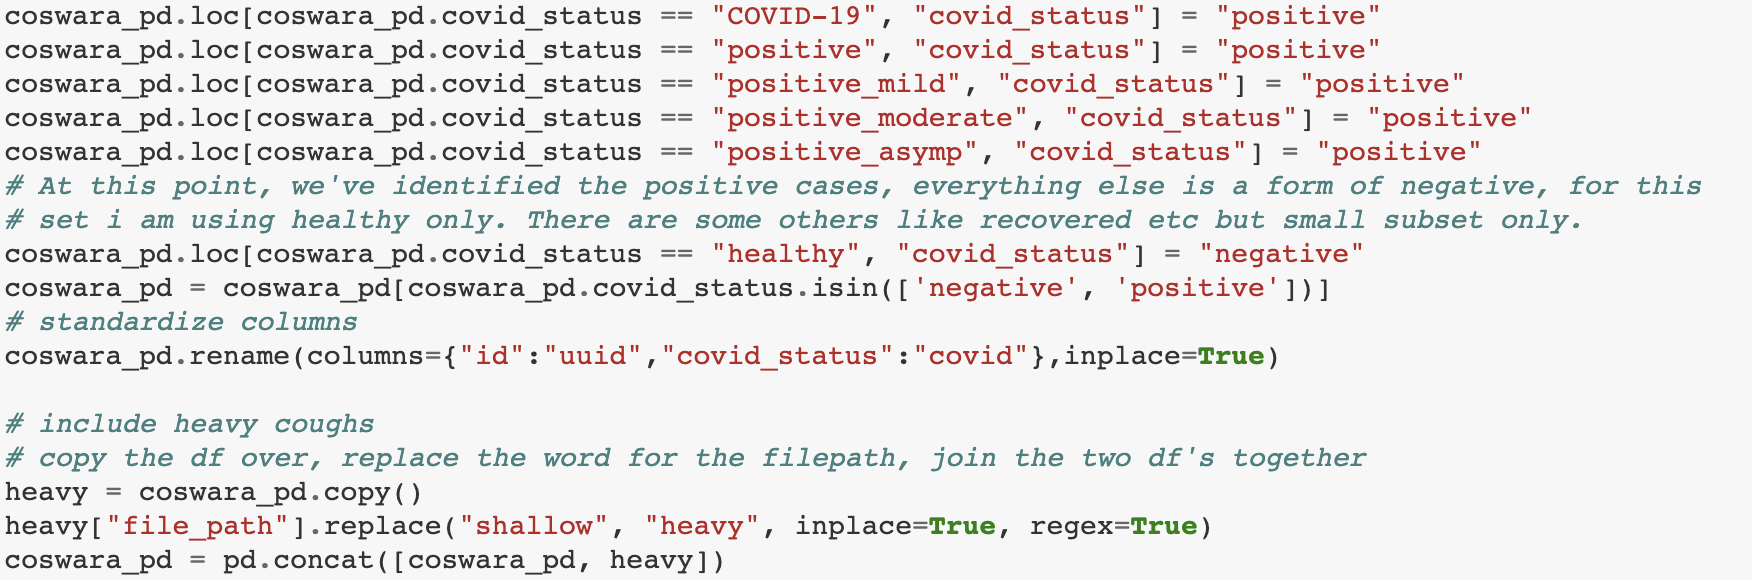
If you look at the datasets in the source repo from virufy you'll notice the coughvid dataset has lots of audio samples. People speaking, breathing etc, what is worth noting is that there is both shallow and heavy coughs. I noticed this early on and I recall reading a research paper where another reseacher impoved the results by including both. I've redeveloped the data preperation notebook to capture both:
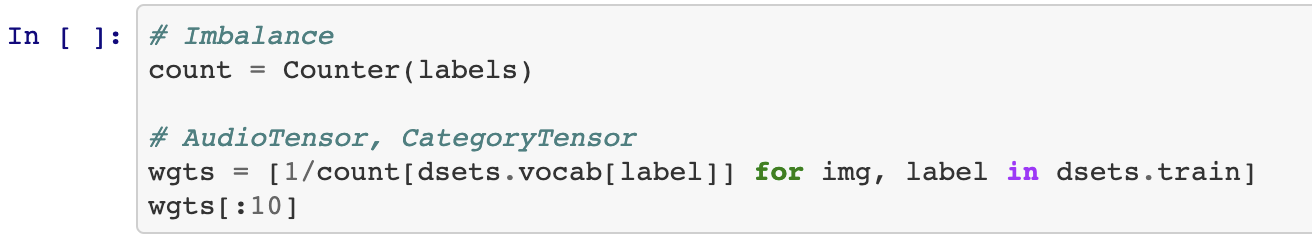
Imbalance
This is not an uncommon problem, often you will have a dataset where you have more of one type than the other. In this case, we have way more negative samples than positive so we need to try and work around that. We've added more data with the heavy and shallow coughs but some research shows weighting the samples can help. I found a nice examples of weighting, here we'll use that to help out:
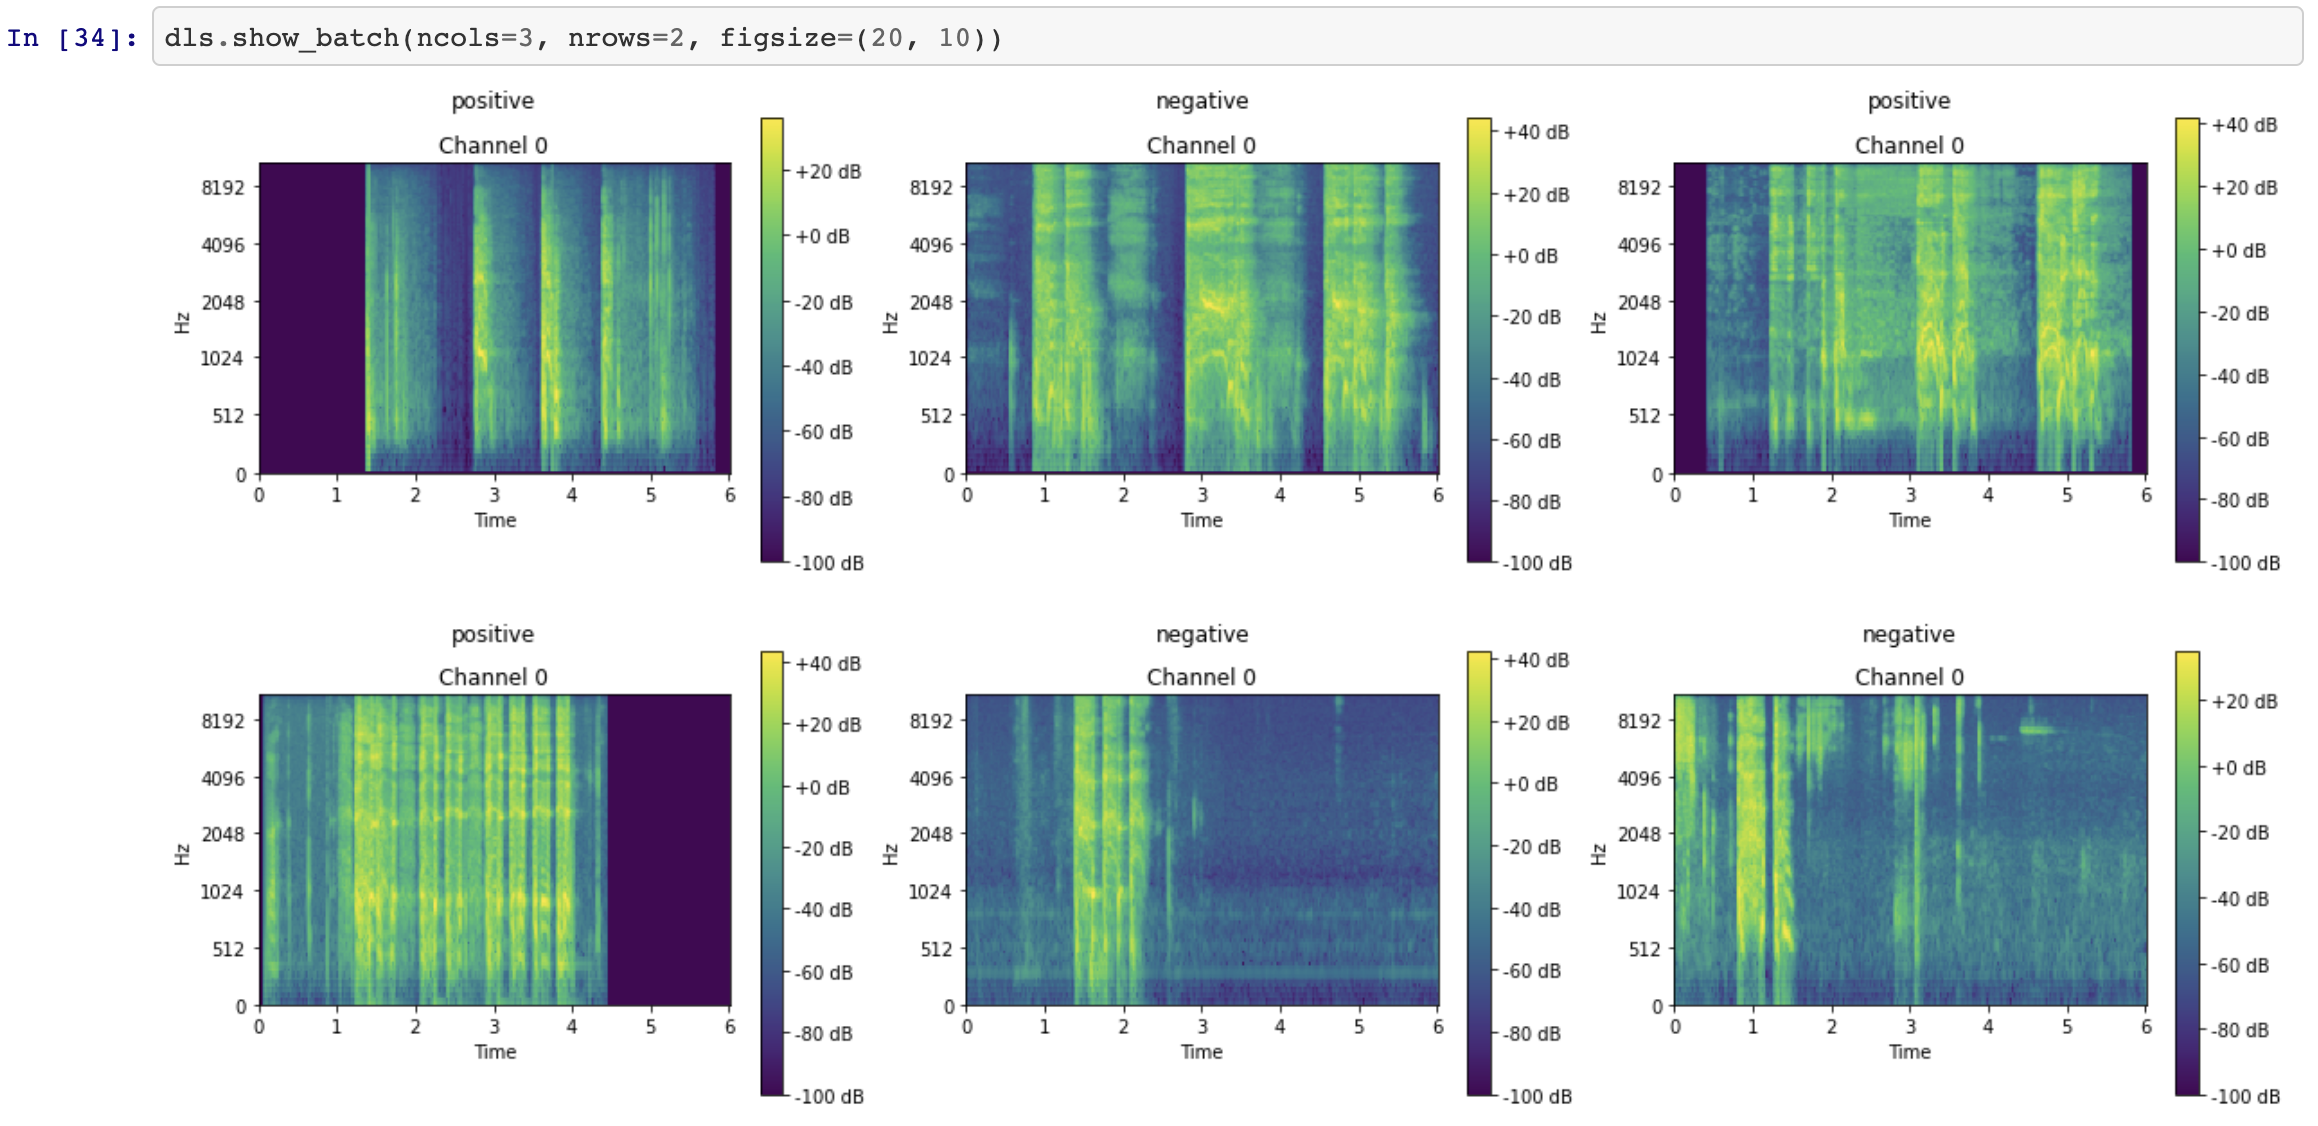
Because we've spent time getting our data visualization down ;) we know we want to check this out before committing:
We can see the weighting appears to work, how cool is that! What I'm looking for is a more evenly distributed sample during training as above.
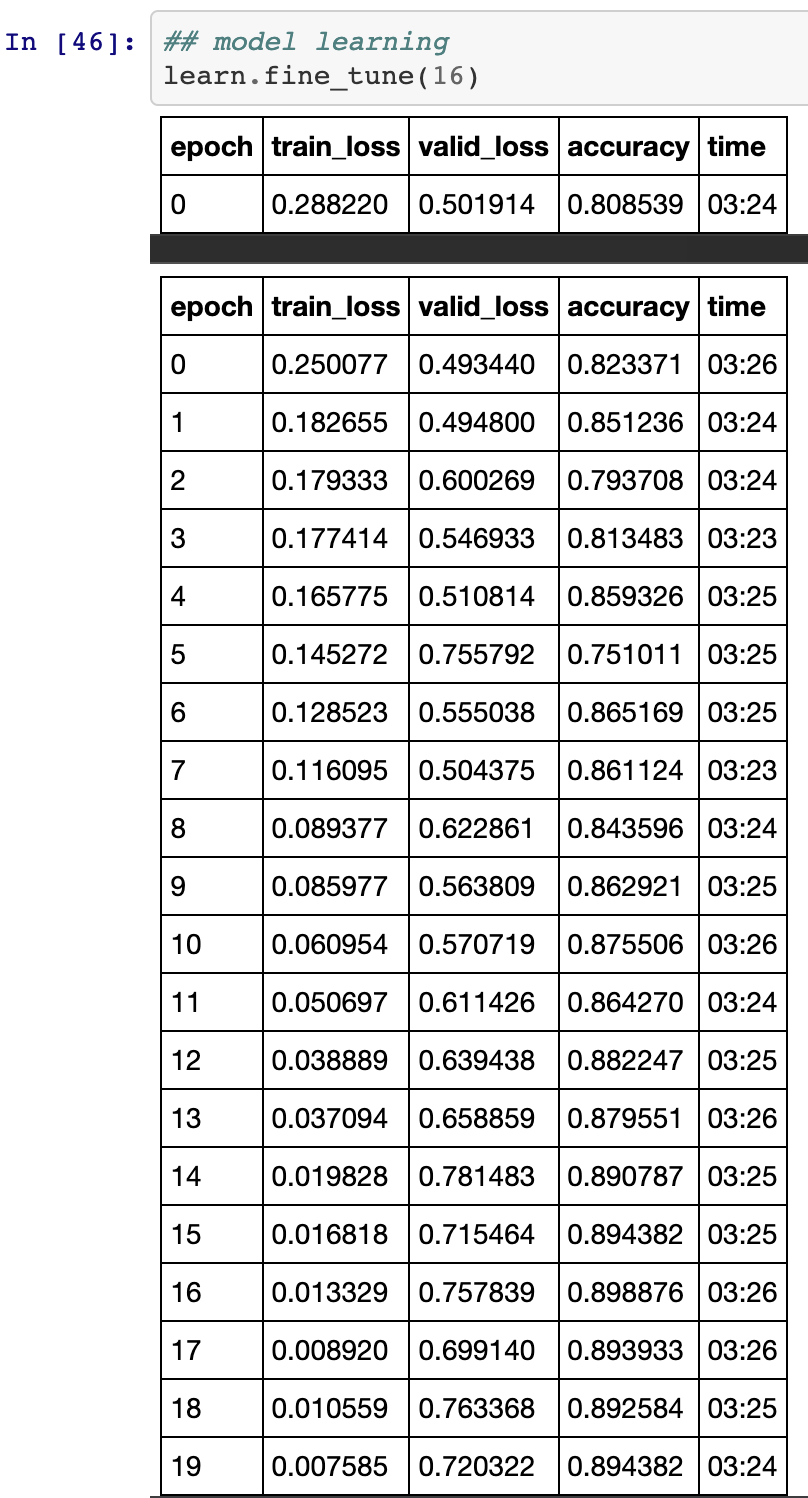
Retraining we more data and weighting:
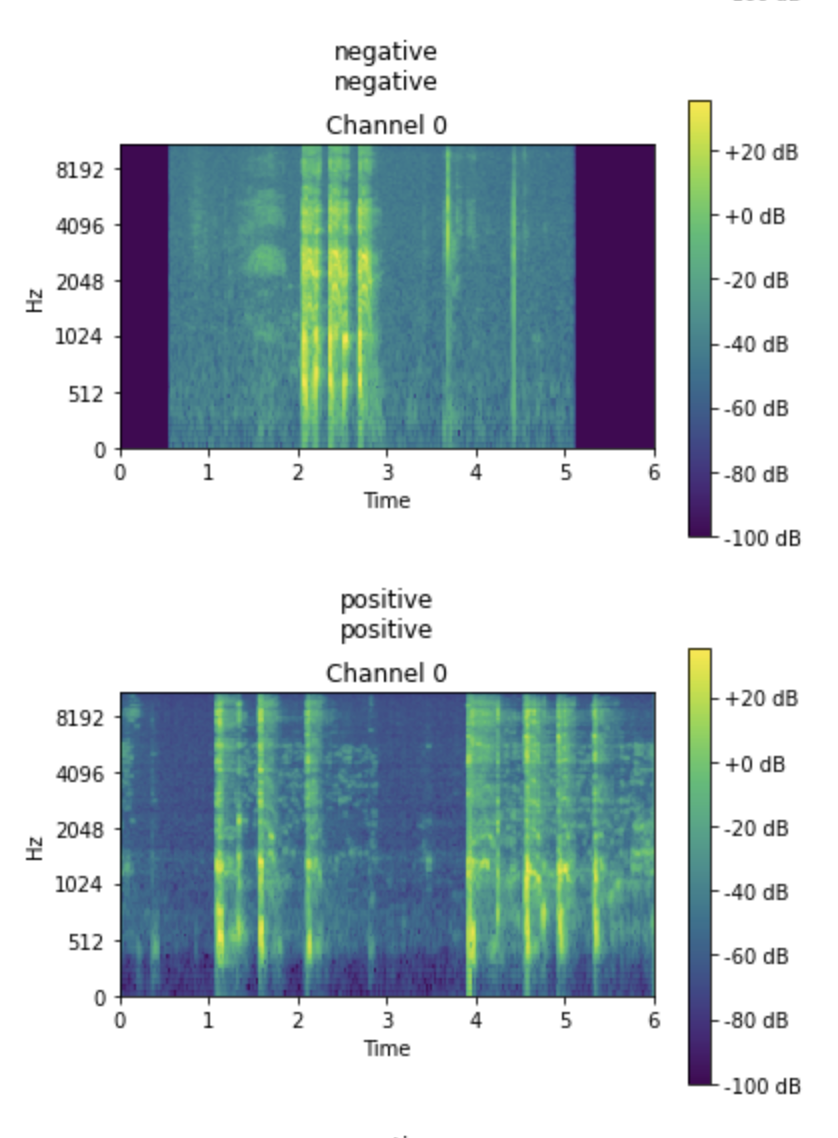
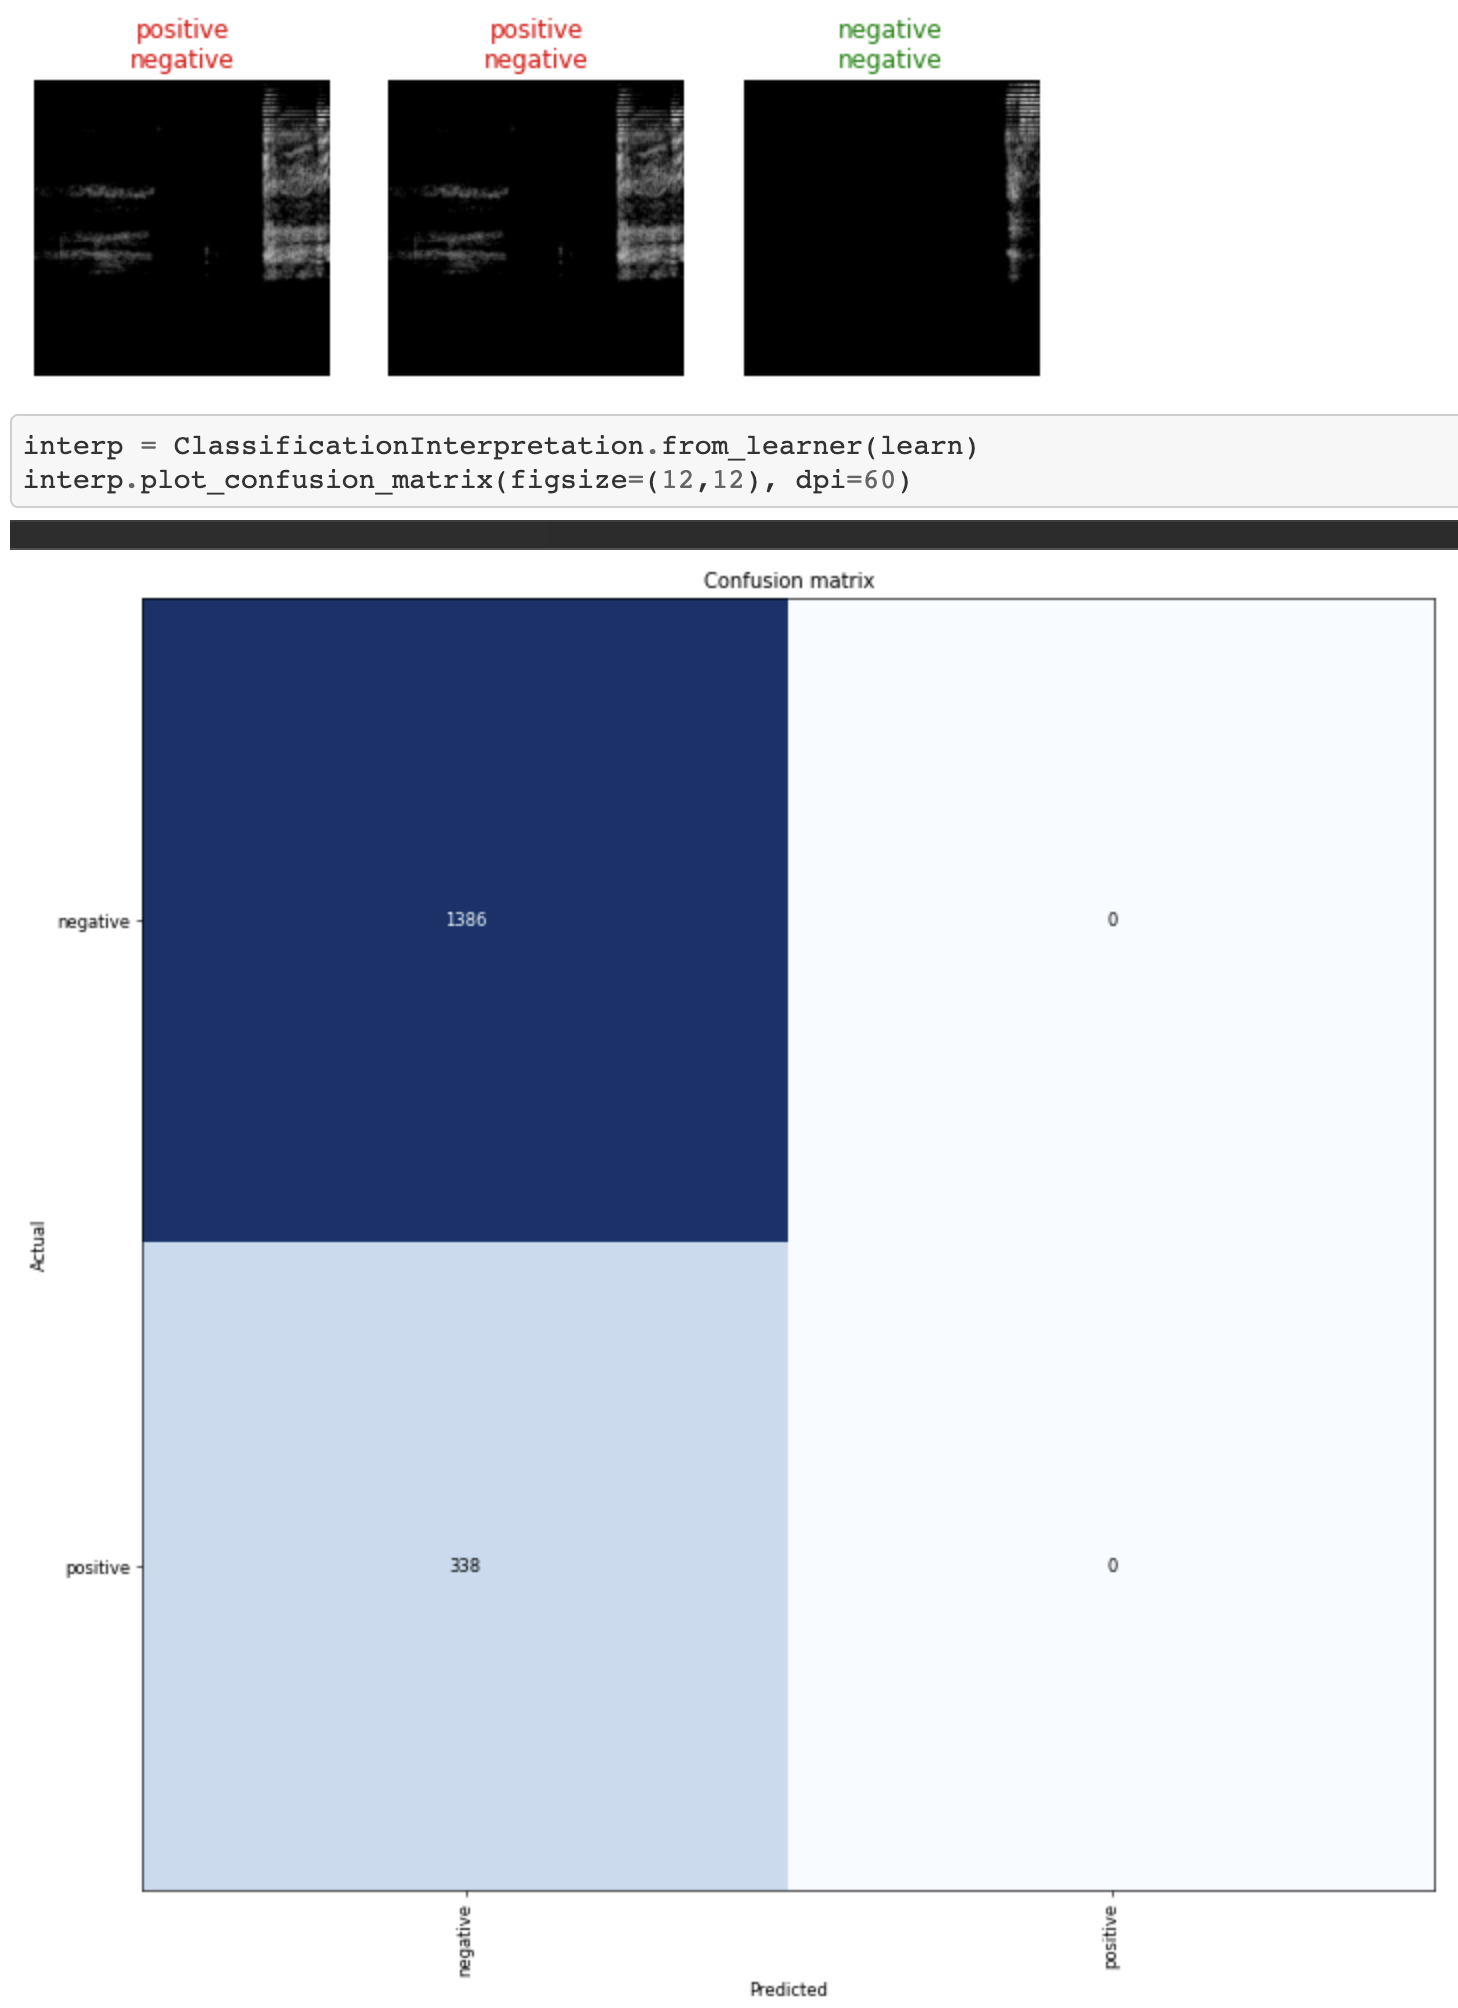
Viewing some of the results, we can see the actual label vs the predicted label, not all will be correct but it's something:
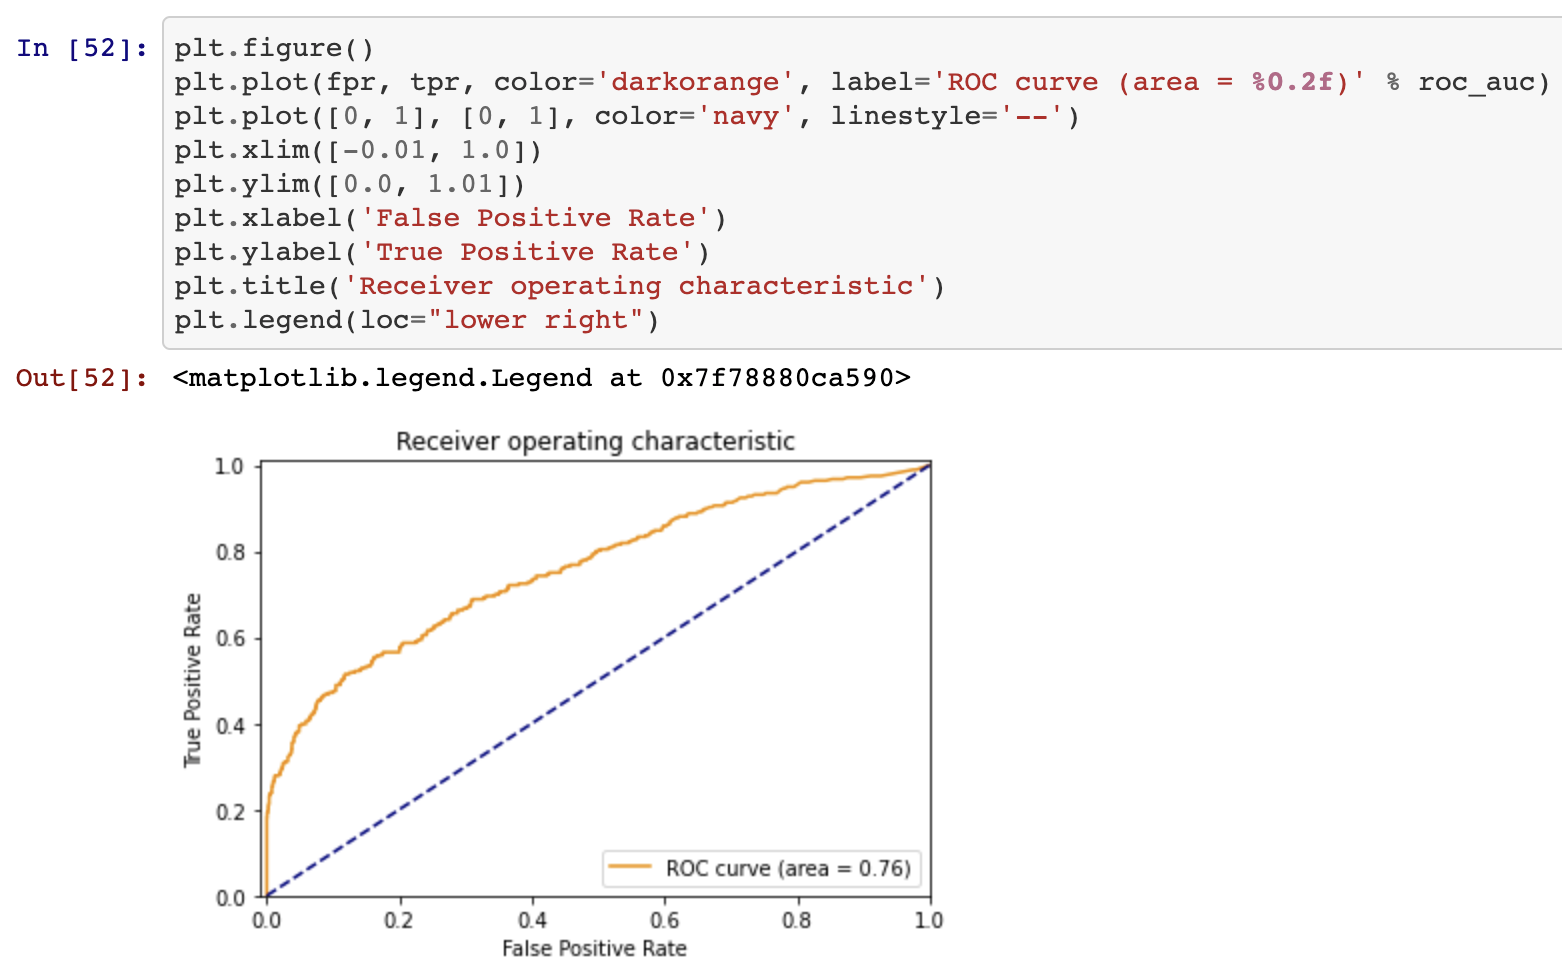
Woooo!!! An acceptable RoC!!!
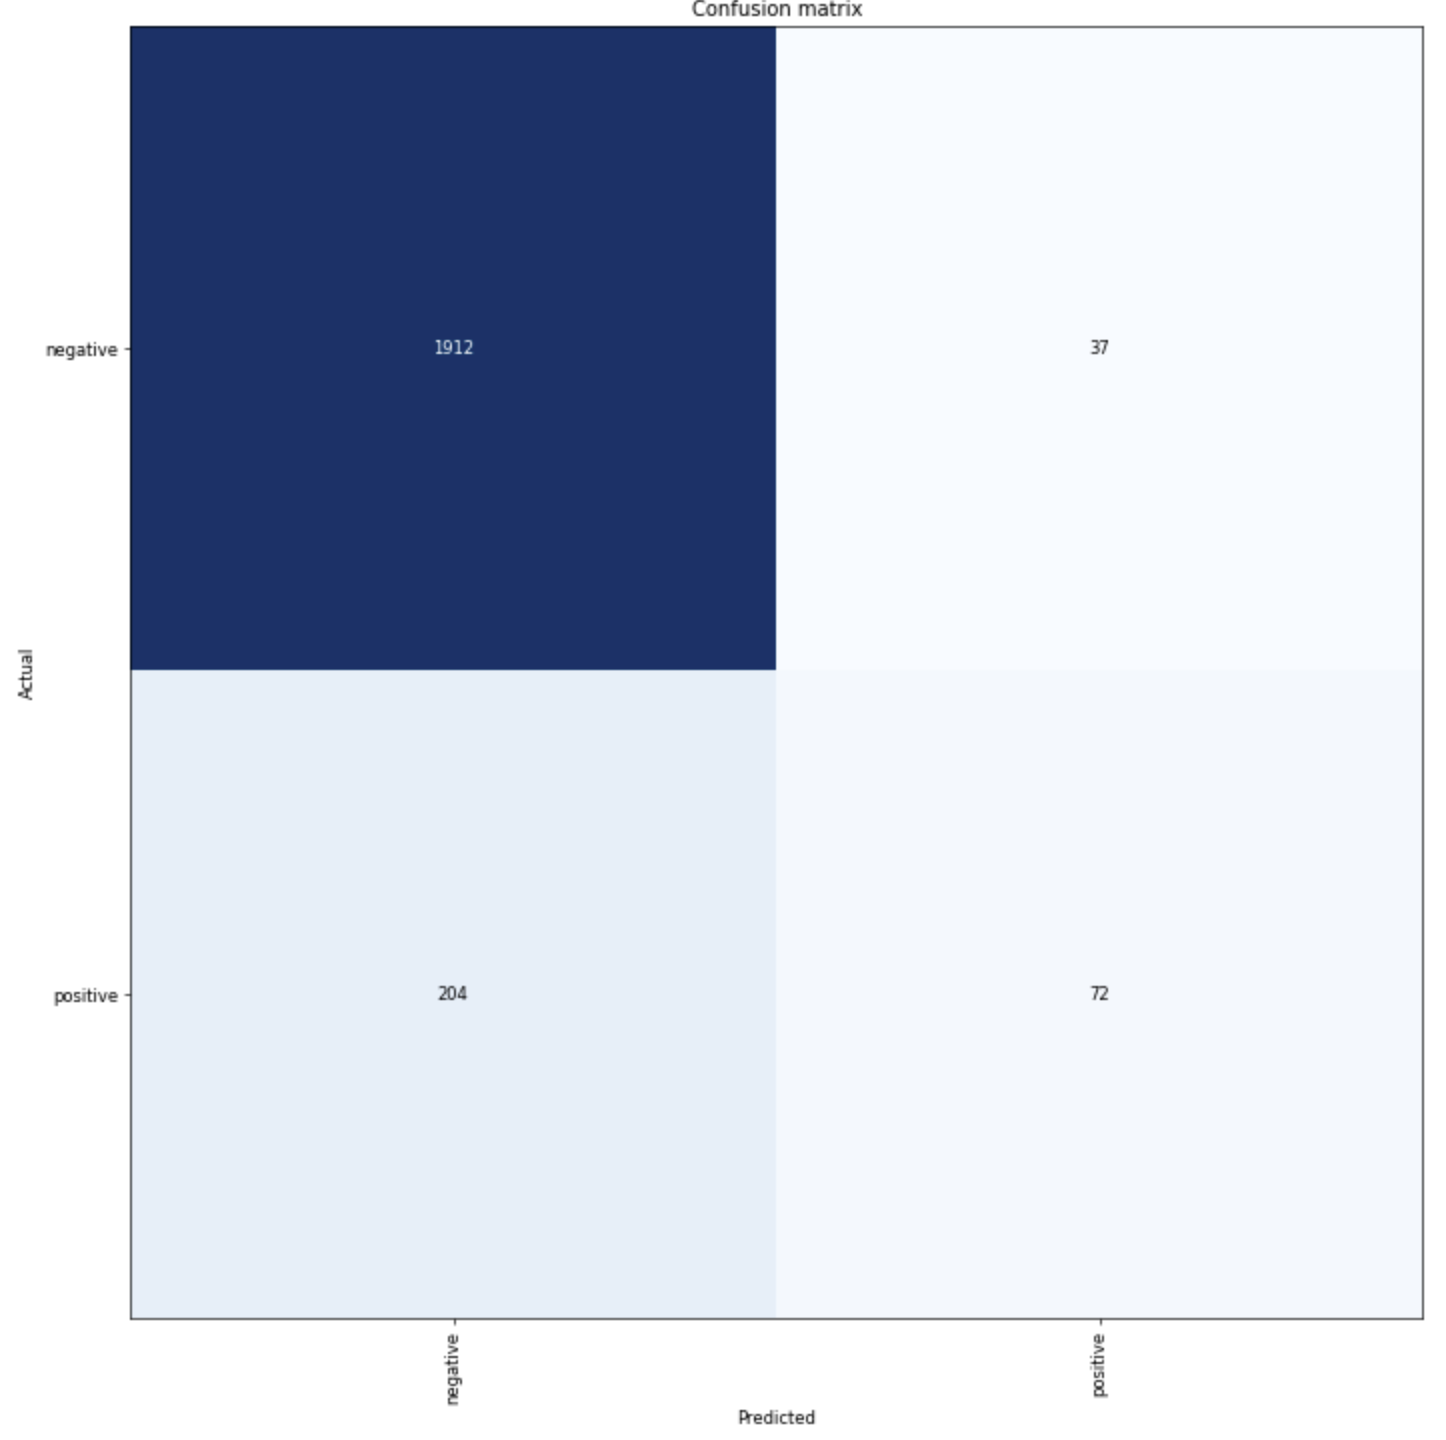
Not a bad confusion matrix, could be better, could be worse:
Thats it for model training, I have a working set of notebooks and a workflow to retrain the model wit
-
Fastai and fastaudio
10/24/2021 at 06:41 • 0 commentsAfter lots of trial and error I gave up on using the standard tensorflow framework, It didn't seem to matter which optimizer, which learning rate, how many epochs, I just could not generate anything usable. I spent quite a bit of time on the mel-specs and reviewing what I could, the other issue here was the visibility of the data before the training. This made it time consuming to interate over.
Regigging the notebooks
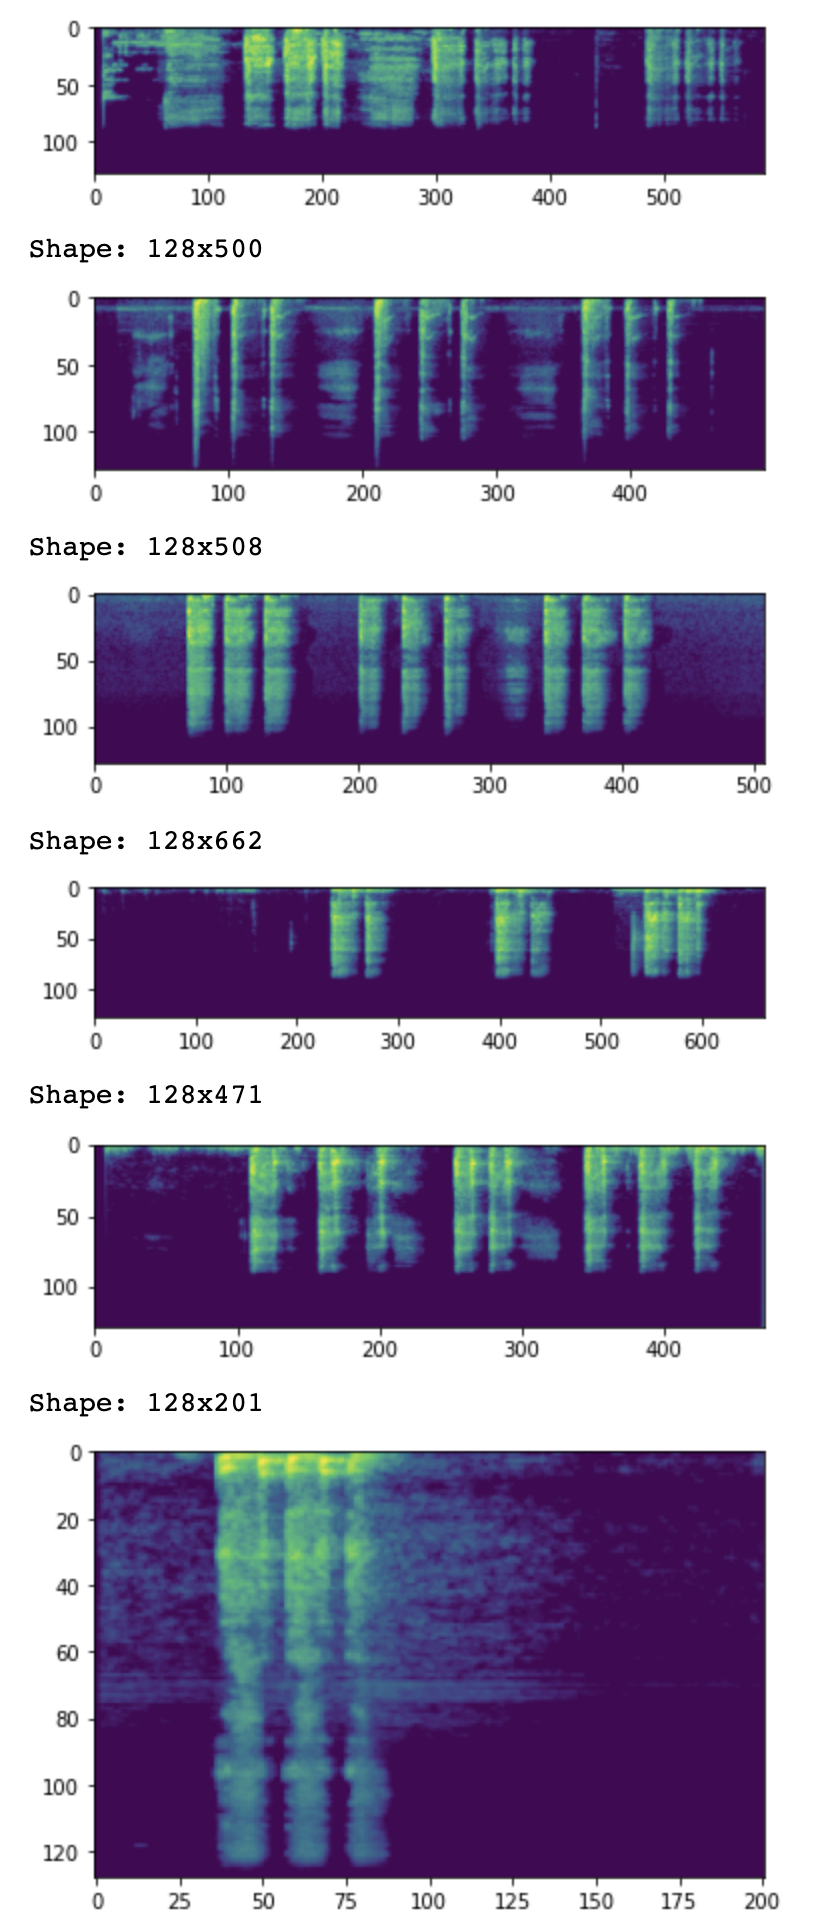
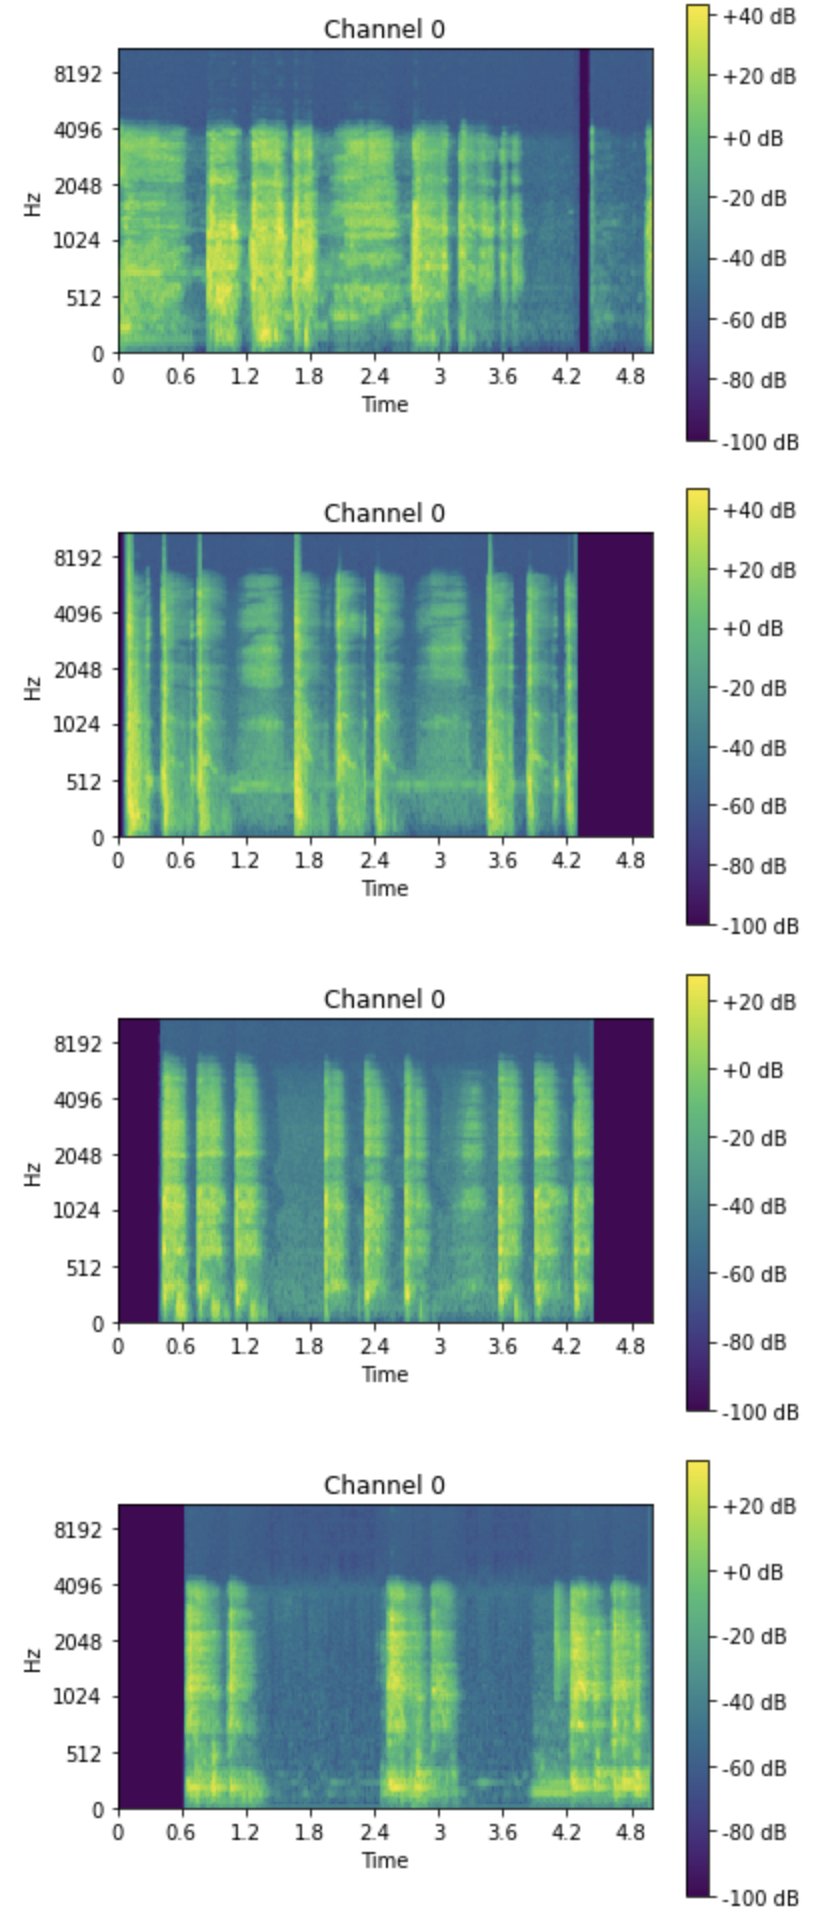
I became paranoid about data quality and wanted to make sure that the data that had been sorted into the training folders was indeed correct. Data visualizatiion before training became pretty important to me. I spent some time making sure I could review samples before training started and now I get a consistent output to review.
Mel-specs output:
Fastai and fastaudio early training
Fastai and fastaudio try to abstract alot of the detailed requirements from the training so that you start with a good base level. You can still tweak it but you are less likely to end up with results like i did with tensorflow.
Needs more tweaking, but in general a much more positive expierence and higher level of confidence that we are on the right track.
The other key thing to note here, we no longer generate mel-specs or need to do preprocessing. This is done on the fly. Fastai and fastaudio are the waty to g
-
Sagemaker preprocessing & training
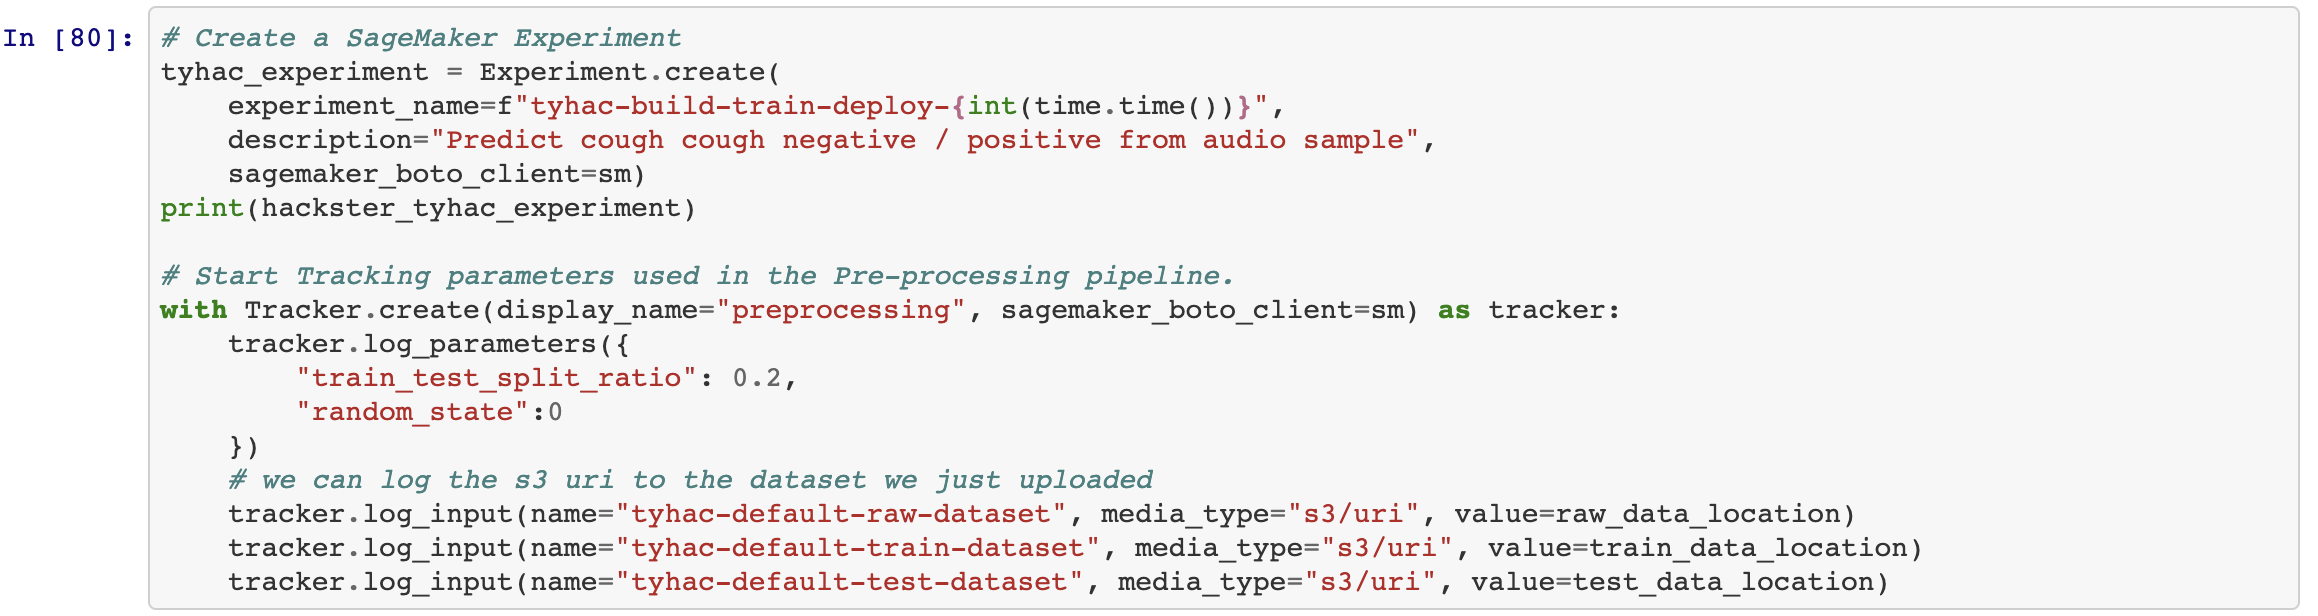
10/24/2021 at 05:59 • 0 commentsI've managed to pull down data samples, label and sort the data and upload that data to an s3 bucket. Once the data has been made available we need to generated the mel-spectrograms, to do this we'll be using librosa to make the spectrogram and saving that to a file which will end up in a bucket for training.
To do this I've created a processing job to go through each sample and generate the spectogram:We can also see here the training is split, from my reading I had found that it's not good to run training and validation on the same data set. This method will split it so that only validation is run on "unseen" data which should help with the results.
Training
I'm using tensorflow to help out with the training, a seperate training job is submitted to sagemaker and results are saved to s3. The initial training results were pretty bad, I was unable to really to anything with the model. I tried various hyperparameters and many data preprocessing tweaks and verification without any luck.
Pre train loss: 0.6990411281585693 Acc: 0.5088862180709839
Epoch 1/200
93/93 - 79s - loss: 0.6429 - auc: 0.5088 - val_loss: 0.5533 - val_auc: 0.4560
Epoch 2/200
93/93 - 78s - loss: 0.5998 - auc: 0.4971 - val_loss: 0.6015 - val_auc: 0.5000
Epoch 3/200
93/93 - 77s - loss: 0.6017 - auc: 0.4744 - val_loss: 0.5525 - val_auc: 0.4427
Epoch 4/200
93/93 - 76s - loss: 0.5788 - auc: 0.5350 - val_loss: 0.5710 - val_auc: 0.4553
Epoch 5/200
93/93 - 77s - loss: 0.5807 - auc: 0.5307 - val_loss: 0.5465 - val_auc: 0.4724
Epoch 6/200
93/93 - 77s - loss: 0.5366 - auc: 0.5319 - val_loss: 0.5375 - val_auc: 0.4668
Epoch 7/200
93/93 - 77s - loss: 0.5437 - auc: 0.5724 - val_loss: 0.5726 - val_auc: 0.5067
Epoch 8/200
93/93 - 76s - loss: 1.2623 - auc: 0.5143 - val_loss: 0.6618 - val_auc: 0.5000
Epoch 9/200
93/93 - 77s - loss: 0.6556 - auc: 0.5066 - val_loss: 0.6495 - val_auc: 0.5000
Epoch 10/200
93/93 - 76s - loss: 0.6440 - auc: 0.5041 - val_loss: 0.6380 - val_auc: 0.5000
Epoch 11/200
93/93 - 76s - loss: 0.6334 - auc: 0.5327 - val_loss: 0.6285 - val_auc: 0.5000
Epoch 12/200
93/93 - 77s - loss: 0.6243 - auc: 0.4078 - val_loss: 0.6197 - val_auc: 0.5000
Epoch 13/200
93/93 - 76s - loss: 0.6156 - auc: 0.5306 - val_loss: 0.6113 - val_auc: 0.5000
Epoch 14/200
93/93 - 77s - loss: 0.6081 - auc: 0.4703 - val_loss: 0.6042 - val_auc: 0.5000
Epoch 15/200
93/93 - 77s - loss: 0.6011 - auc: 0.4222 - val_loss: 0.5975 - val_auc: 0.5000
Epoch 16/200
93/93 - 77s - loss: 0.5948 - auc: 0.4536 - val_loss: 0.5911 - val_auc: 0.5000
24/24 - 15s - loss: 0.5339 - auc: 0.4871
Post train loss: 0.5339470505714417 Acc: 0.48713698983192444
To make matters worse, I continued to research how to test models and what metrics to use to make sure I didn't rely on false numbers. The models I trainined would consistently achieve an RoC of 0.5, which is useless.
Deploying an endpoint
Because I was using tensorflow deploying the endpoint was easy, the endpoint is used for interfence. We can see the model training above was no good, this is custom script I wrote just to test known labels using the endpoint:
Testing endpoint ... begin positive sample run negative: 1.25% negative: 0.16% positive: 99.82% negative: 7.50% negative: 0.40% begin negative sample run negative: 1.28% negative: 0.19% negative: 40.46% negative: 29.63% negative: 0.51% -
Data preparation for the model
10/24/2021 at 05:48 • 0 commentsI know we have some data accessible in the virufy repo, we need to process this data and workout the label scheme and get it ready for training.
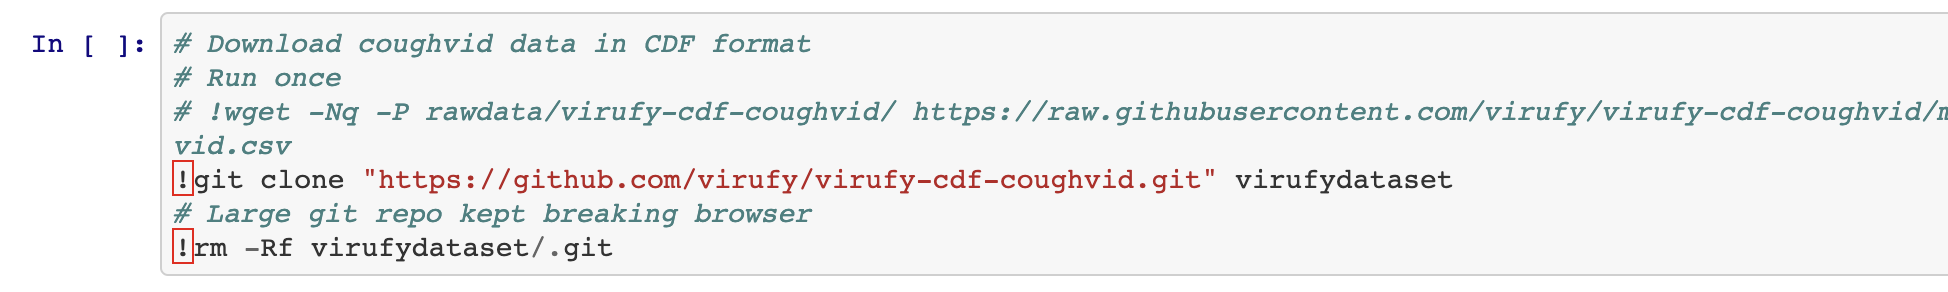
Downloading the samples
First I need to create a notebook to do the data prep, this will download the samples, sort, filter etc and store them in an AWS S3 bucket to be used for training. Here I'm pulling down the samples and preparing the buckets, I'm also starting to work on a csv data set for tyhac to use later:
Here I'm starting to sort the data and look at the shallow and heavy cough samples. This notebook is outputing a custom tyhac dataset rather than using the virufy schema. While the virufy schema is good, it contains alot of extra information I don't want right now and makes it more difficult to merge data. Designing a custom basic data format for tyhac makes it easier to translate into.File conversion
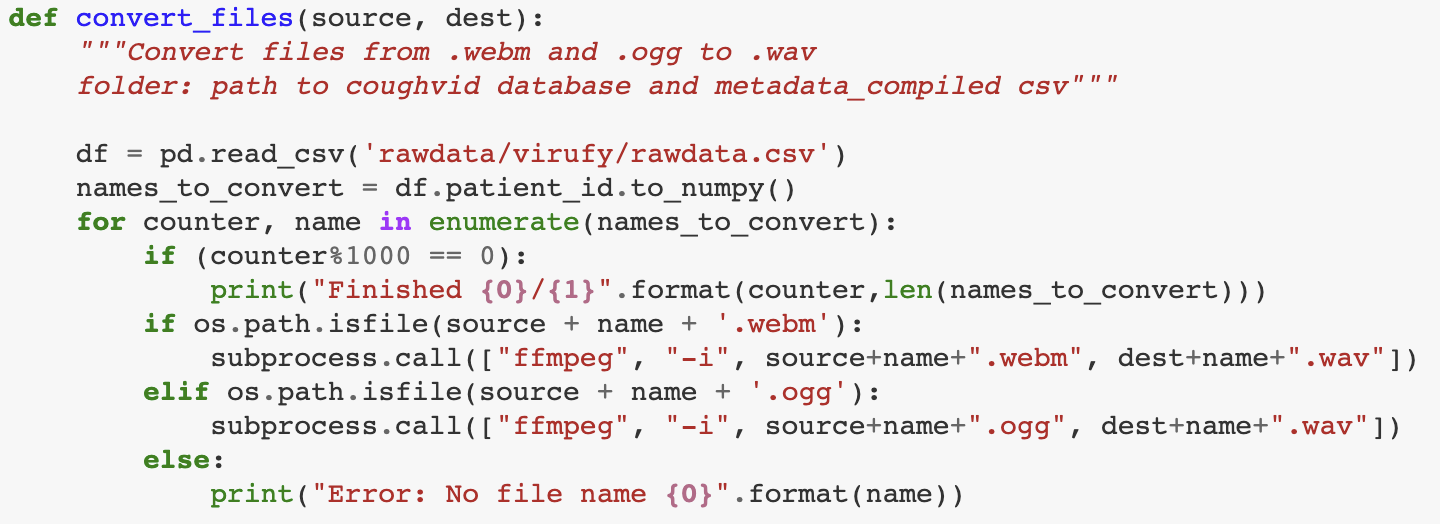
I found that the librosa package didn't really support formats other than wav files, the samples I've found are a mix of webm, ogg and wav. So I need to convert the files before we can create images of the audio samples:
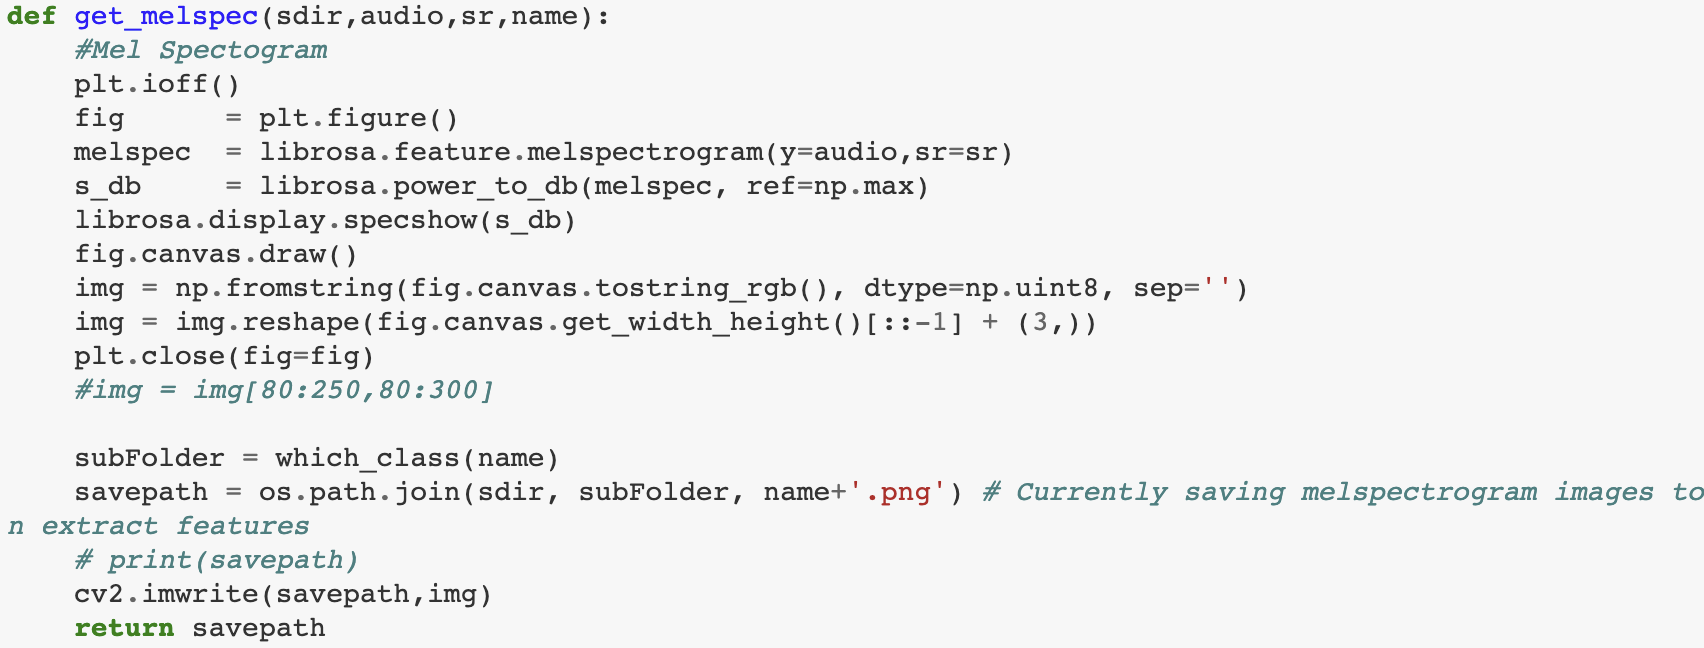
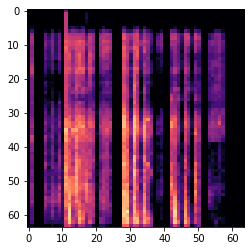
To create an image of an audio sample I'm using mel-spectrograms, this was what I found during my research and seems to be common. We can also see examples of this in the virufy repo which is helpful:
One of the generated mel-specs:
![]()
Tyhac covid-19 audio diagnostic stack
Tyhac is a multi-mode device made possible by deep learning and AWS. The stack stores and predicts covid-19 audio cough samples in realtime.