-
Repeated measurements
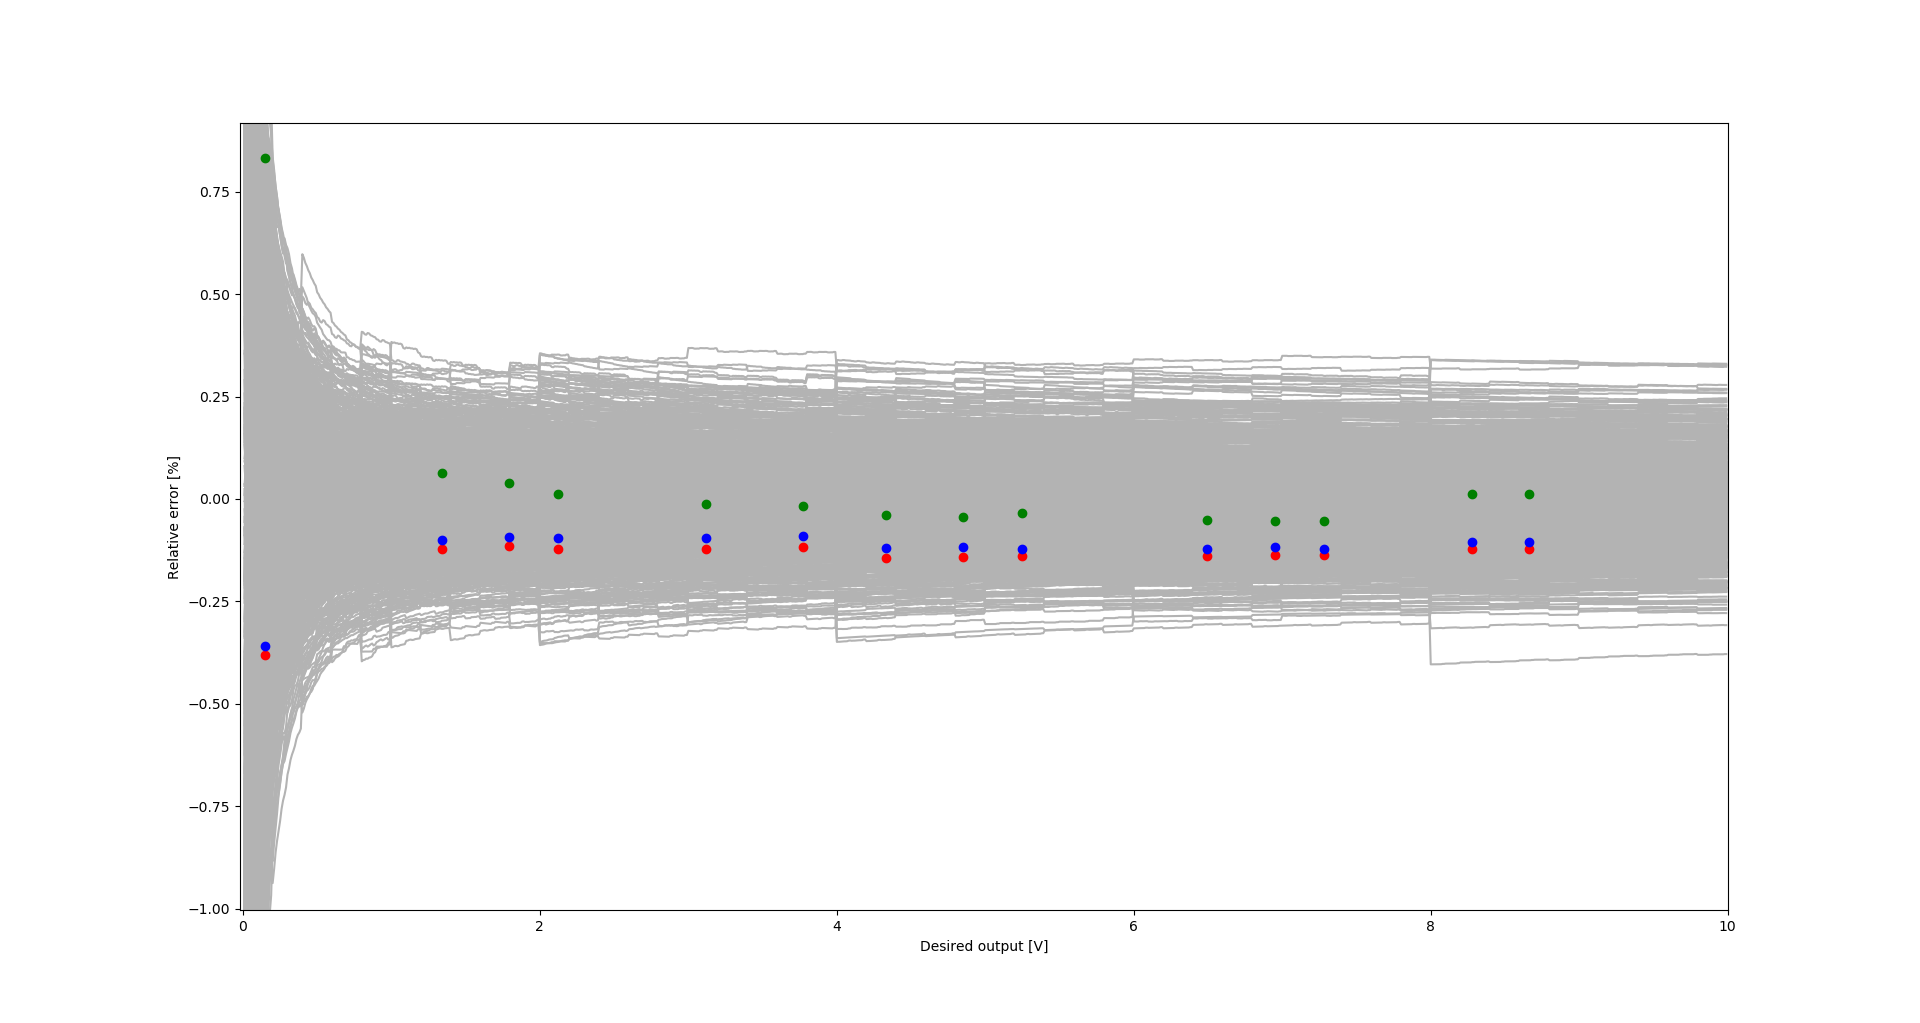
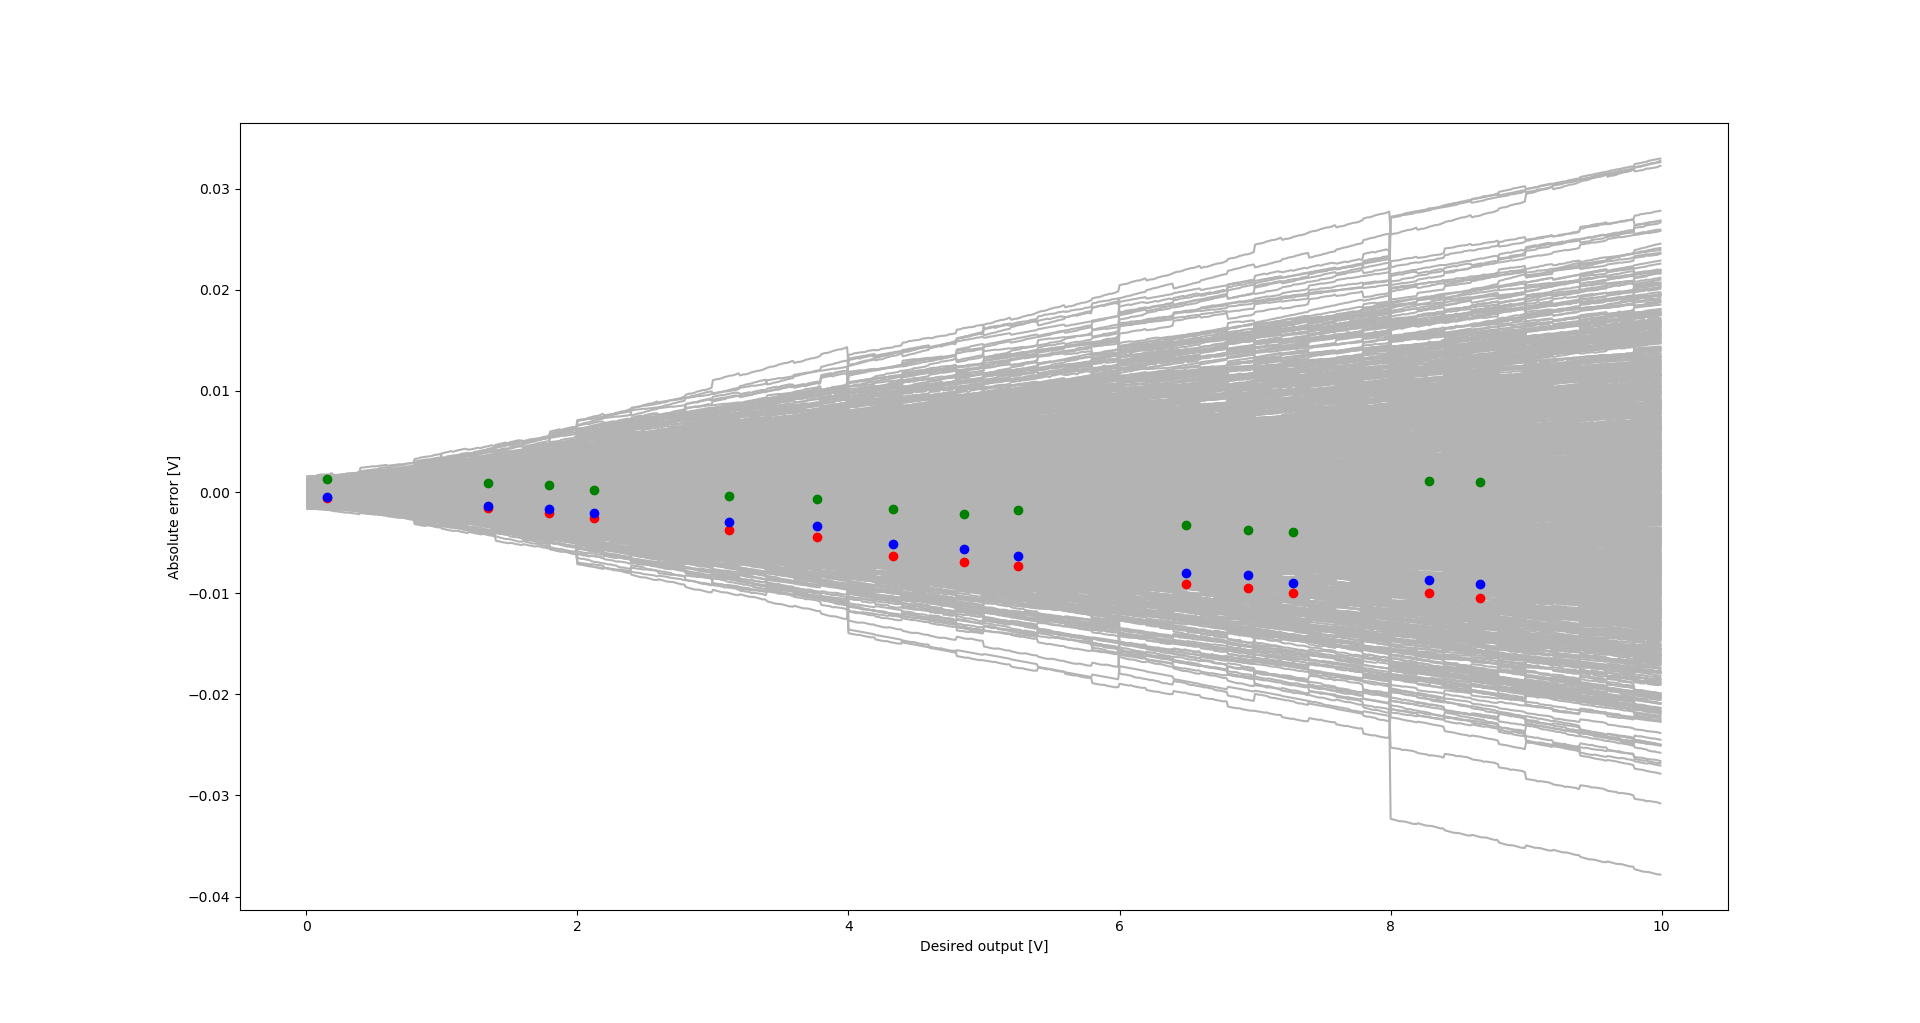
06/04/2023 at 15:46 • 0 commentsI performed an additional set of measurements for the second prototype using a different voltmeter: Solartron 7150+.
Below you can find results and the graphs with new measurements added. The new measurements seem to confirm the previous measurement results.
Ambient temperature during measurements: 23°C
Supply voltage: 9.99V
Voltmeter used: Solartron 7150+
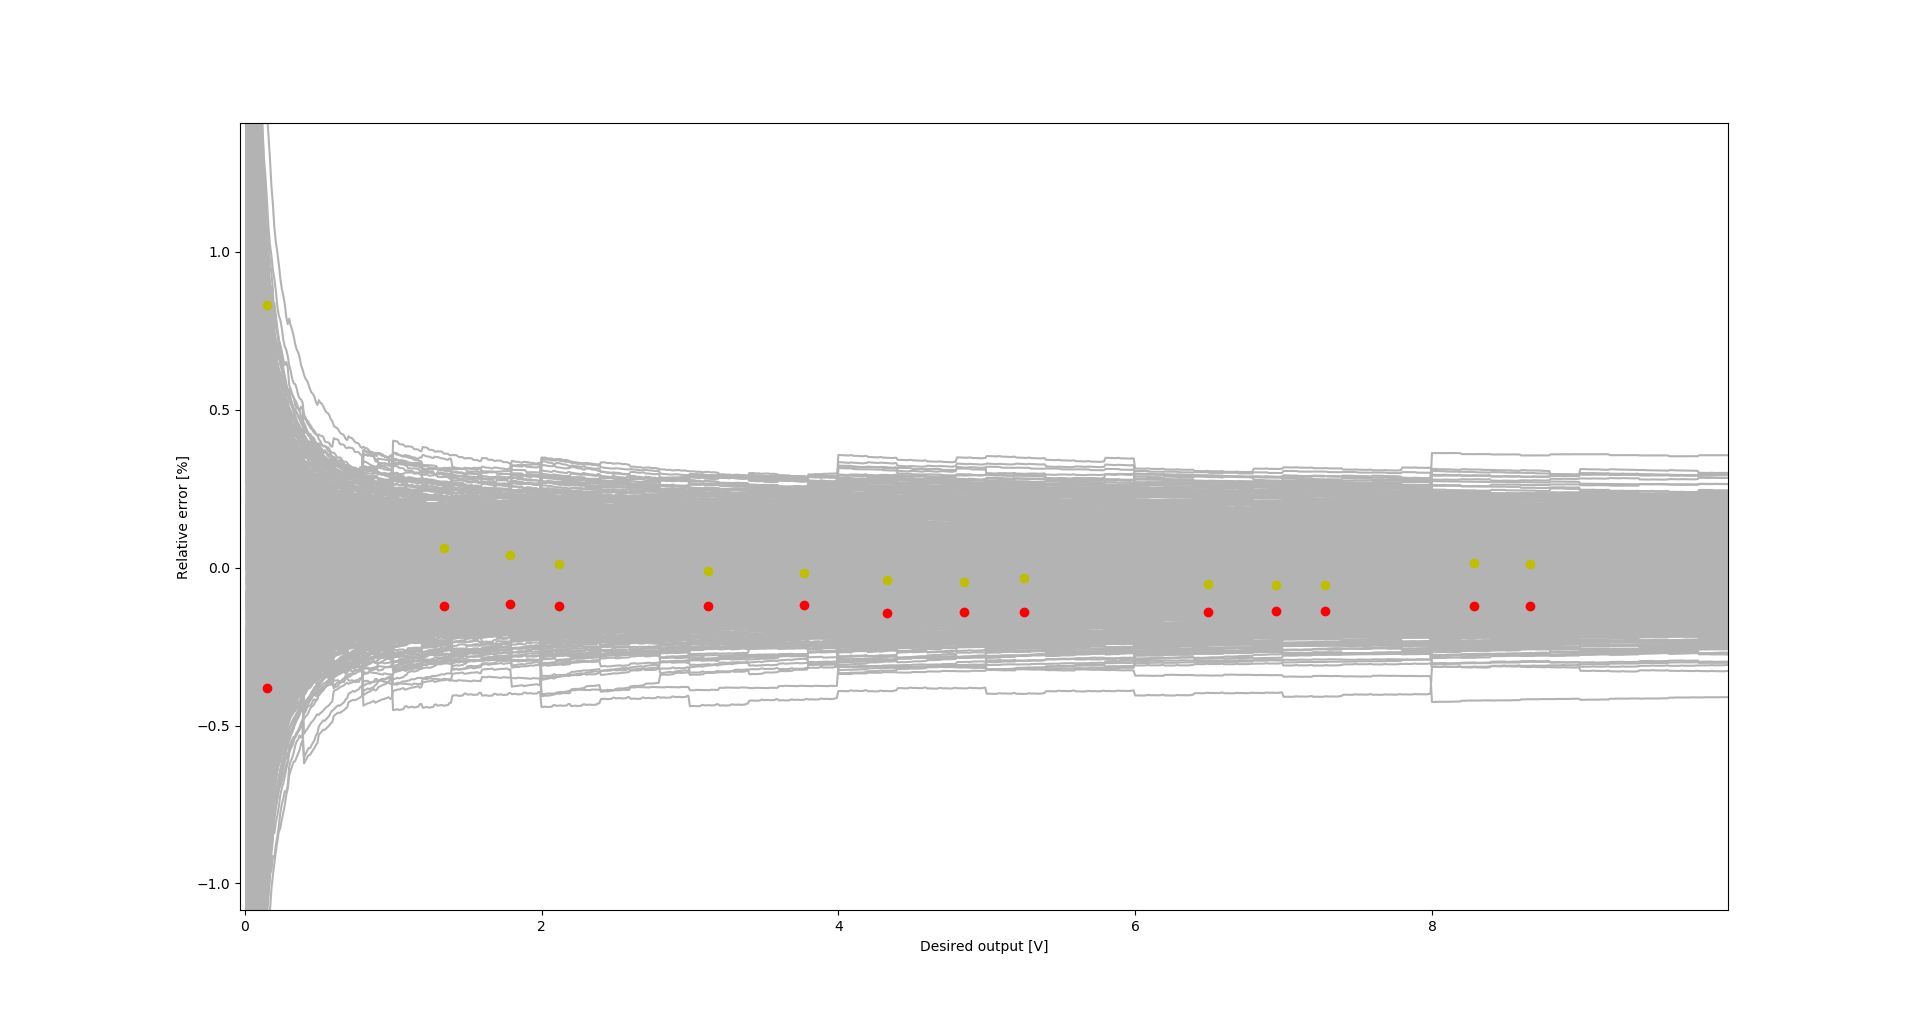
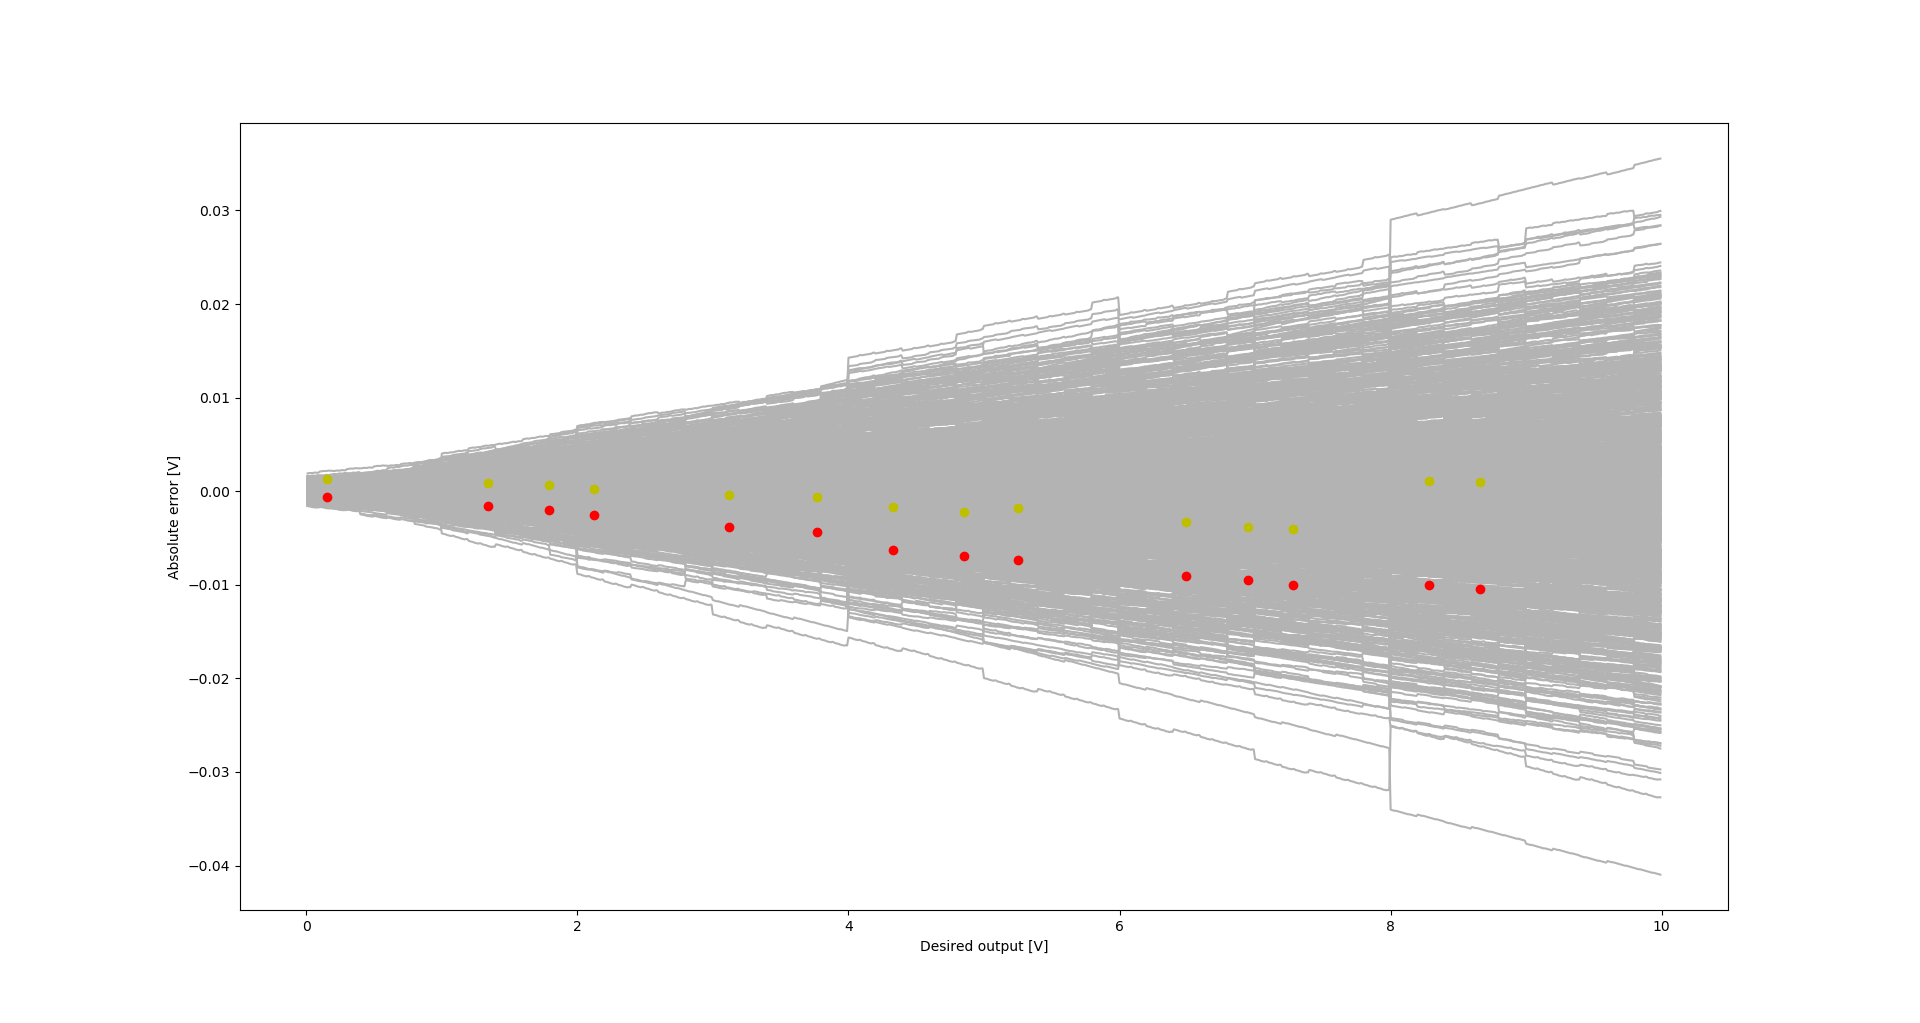
Prototype #2 set value [V] measured value [V] error [mV] error [%] 0 0.003369 3.369 --- 0.15 0.149463 -0.537 -0.358 1.34 1.338665 -1.335 -0.100 1.79 1.788334 -1.666 -0.093 2.12 2.11797 -2.030 -0.096 3.12 3.11701 -2.990 -0.096 3.77 3.7666 -3.400 -0.090 4.33 4.32482 -5.180 -0.120 4.85 4.84432 -5.680 -0.117 5.25 5.24366 -6.340 -0.121 6.49 6.48202 -7.980 -0.123 6.95 6.94179 -8.210 -0.118 7.28 7.27105 -8.950 -0.123 8.28 8.27135 -8.650 -0.104 8.66 8.65086 -9.140 -0.106 
Relative error with dots indicating measurement results: green - prototype #1, red - prototype #2, blue - prototype #2, Solartron voltmeter Absolute error with dots indicating measurement results: green - prototype #1, red - prototype #2, blue - prototype #2, Solartron voltmeter -
Monotonicity
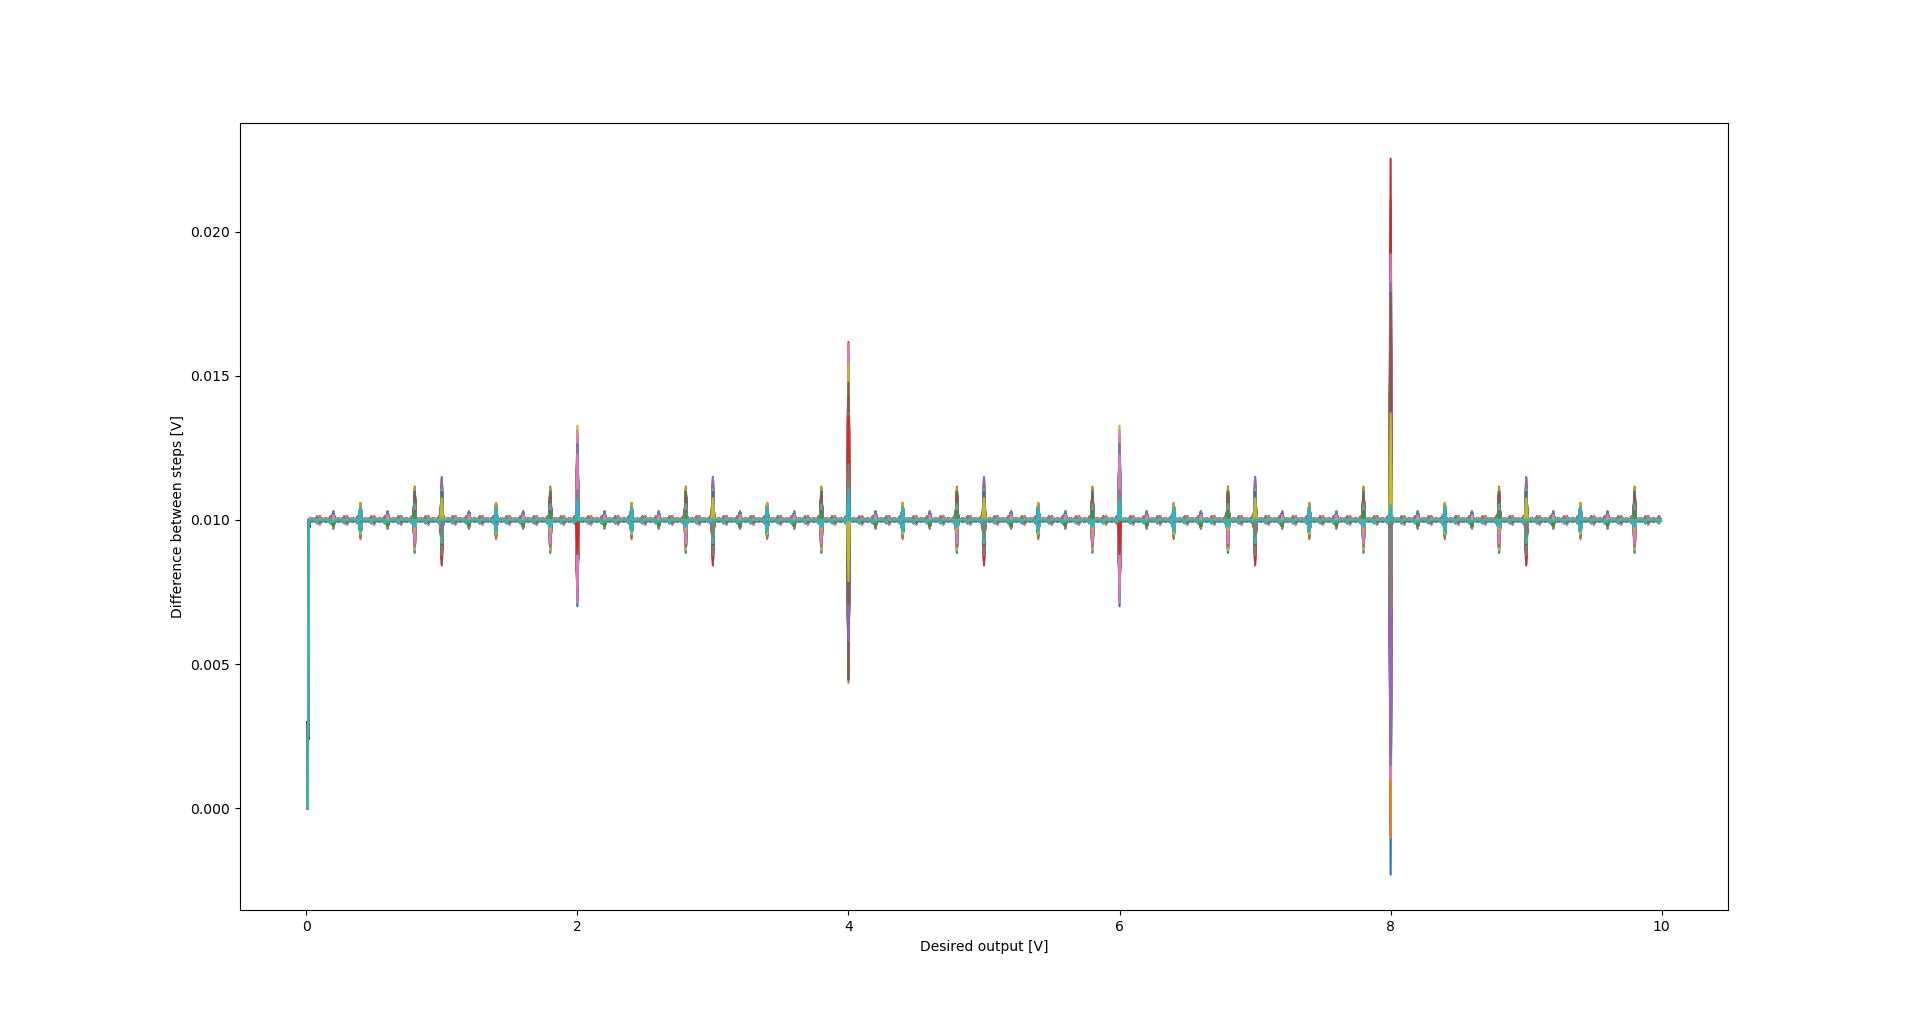
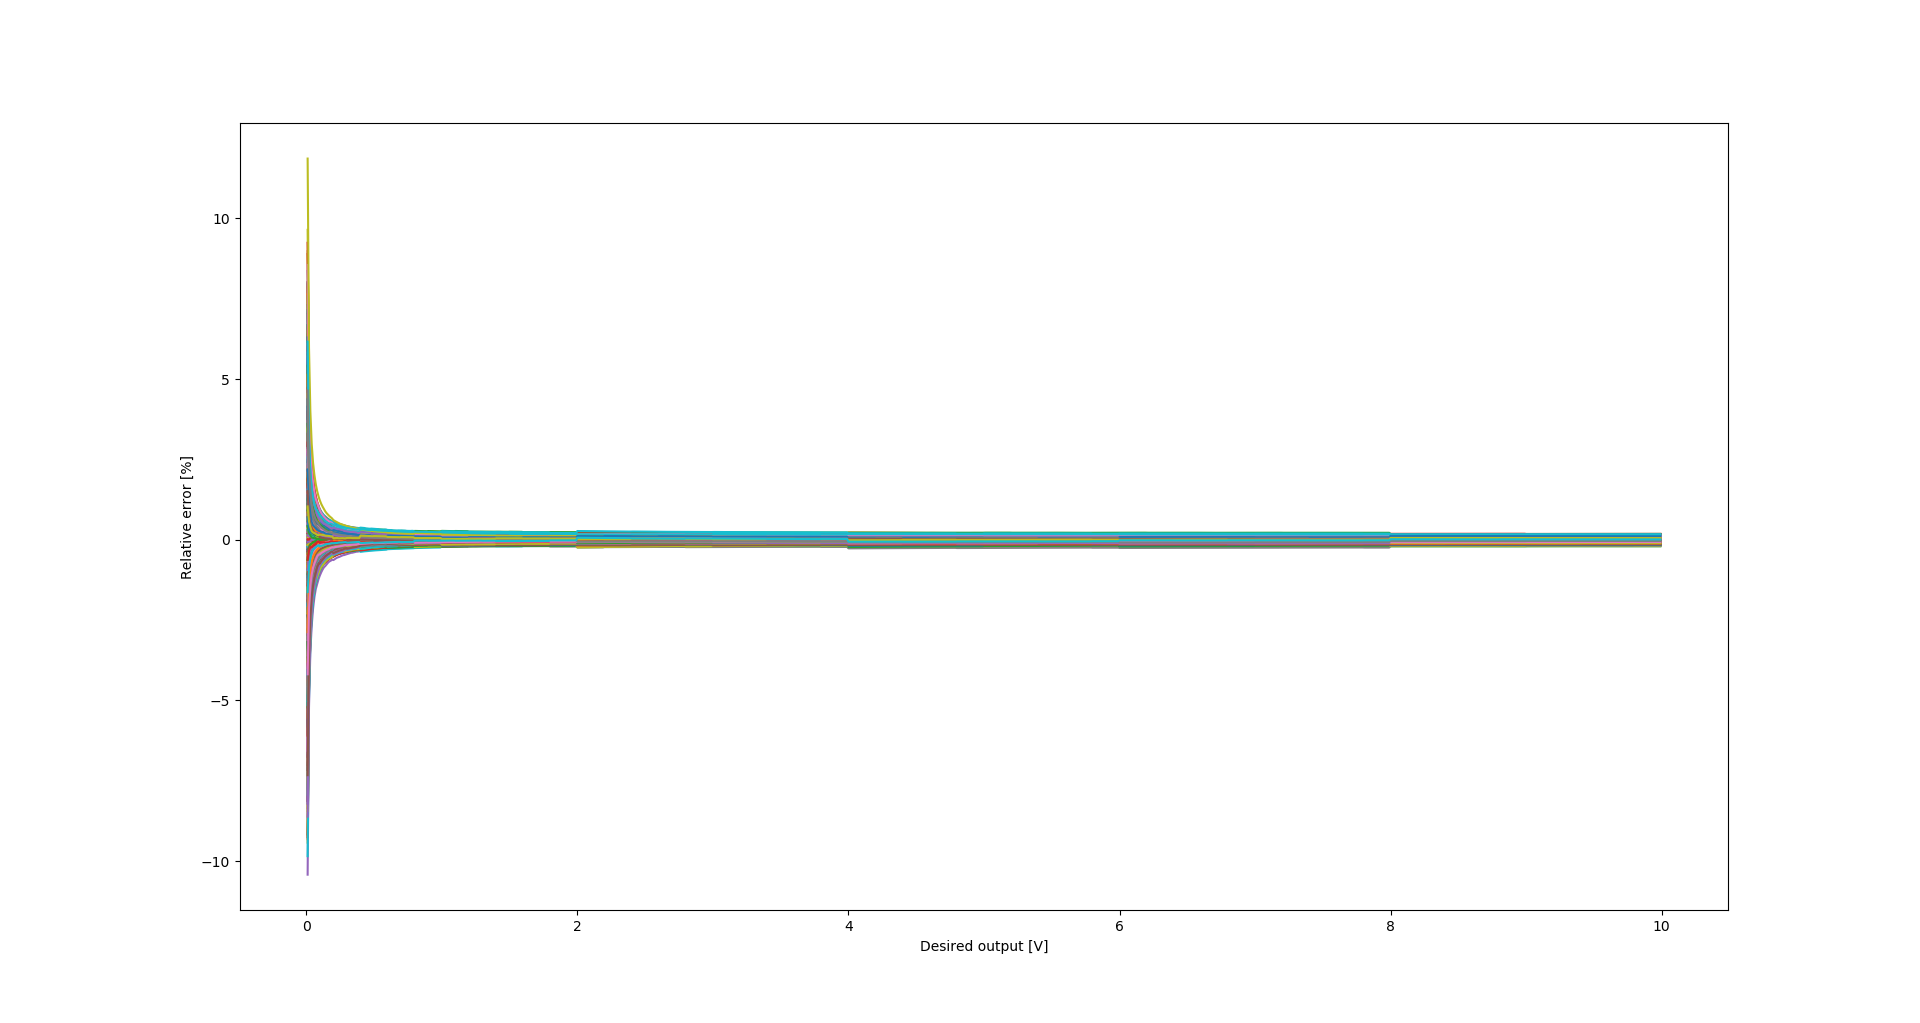
05/30/2023 at 22:05 • 0 commentsAn important feature of the circuits like the one designed (which is effectively a digital to analog converter) is maintaining the monotonicity.
It means, that for every change of set value to a value higher by one least significant digit, the output value also increases. Since I already had the simulation script, I simulated the voltage difference between consecutive steps:
Monotonicity of the circuit (simulation data) Every time the value drops below 0, the monotonicity is lost. It can be seen, that for some extreme combinations of component values within their specified tolerances, the monotonicity will be lost for transition from 7.99V to 8.00V. The ideal value (for ideal components) of change is 0.01V.
For my prototypes, the following values were measured:
Set value Measured value Prototype #1 Measured value Prototype #2 7.99 V 7.9854 V 7.9791 V 8.00 V 8.0010 V 7.9898 V The monotonicity is therefore maintained even for this nevralgic step for both prototypes.
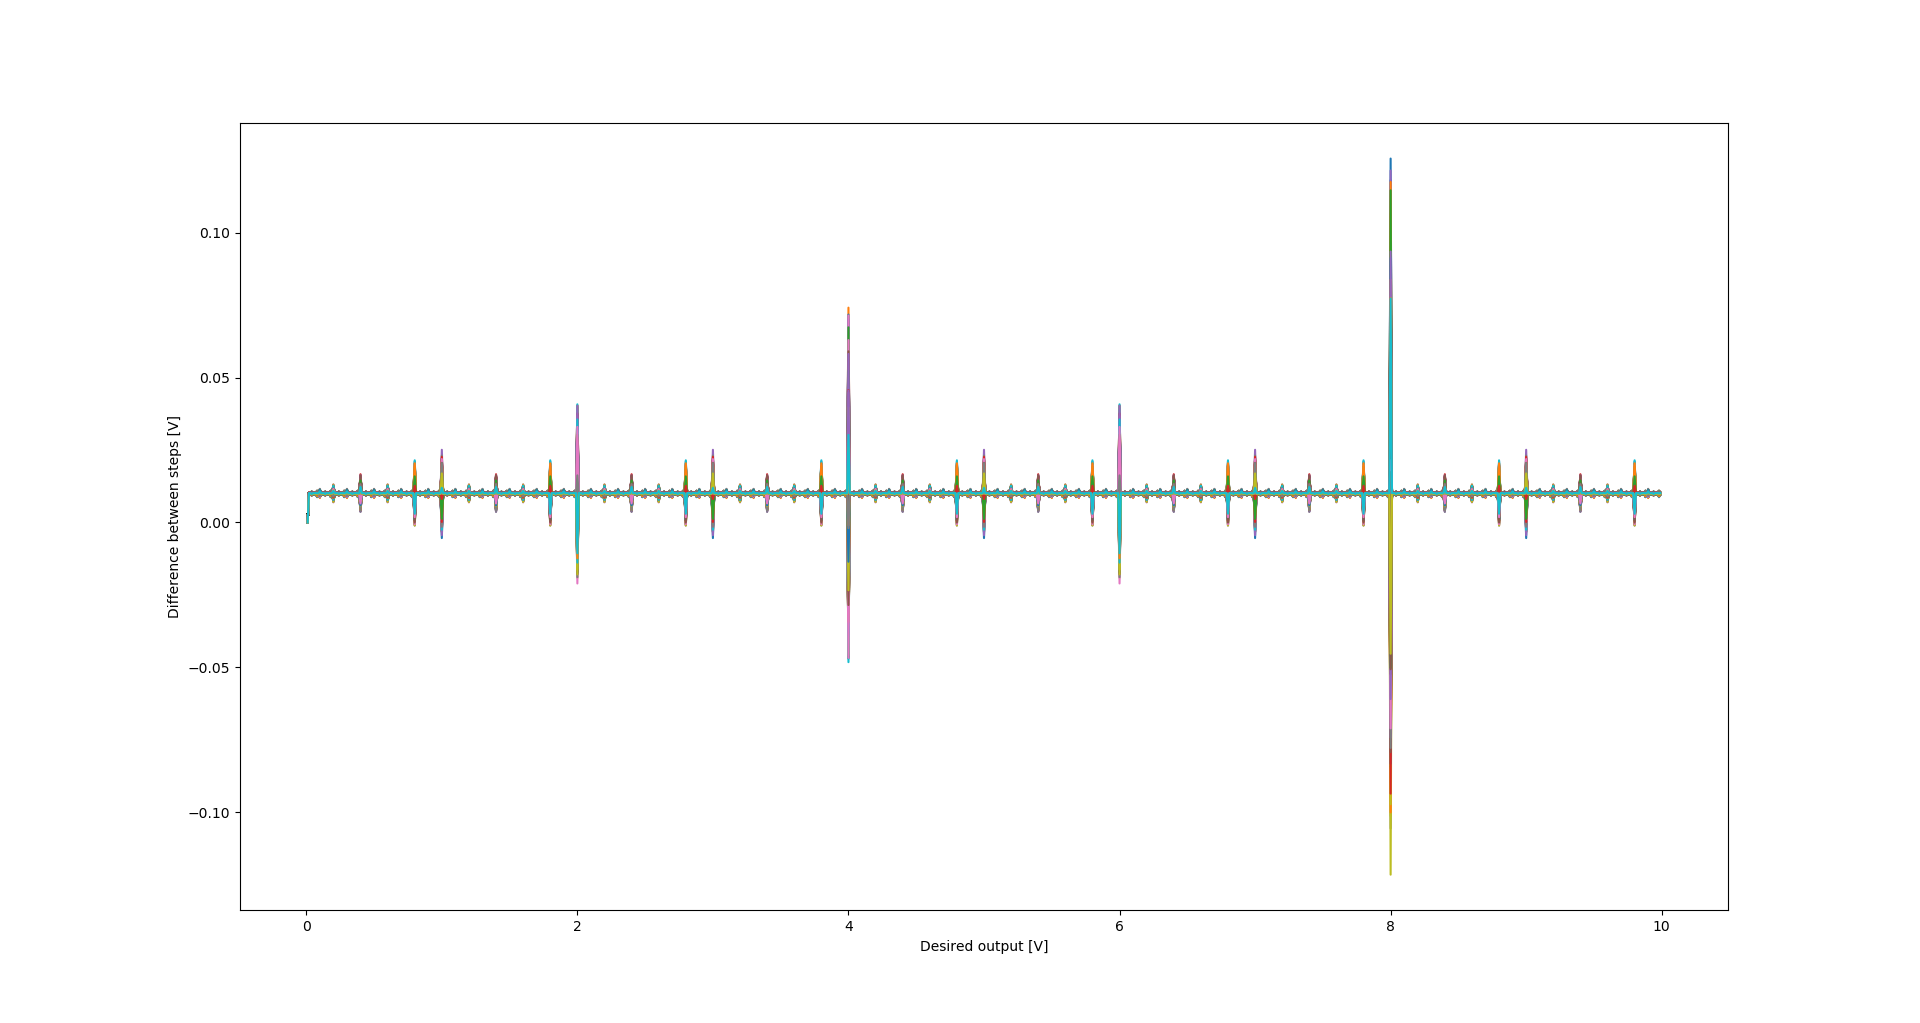
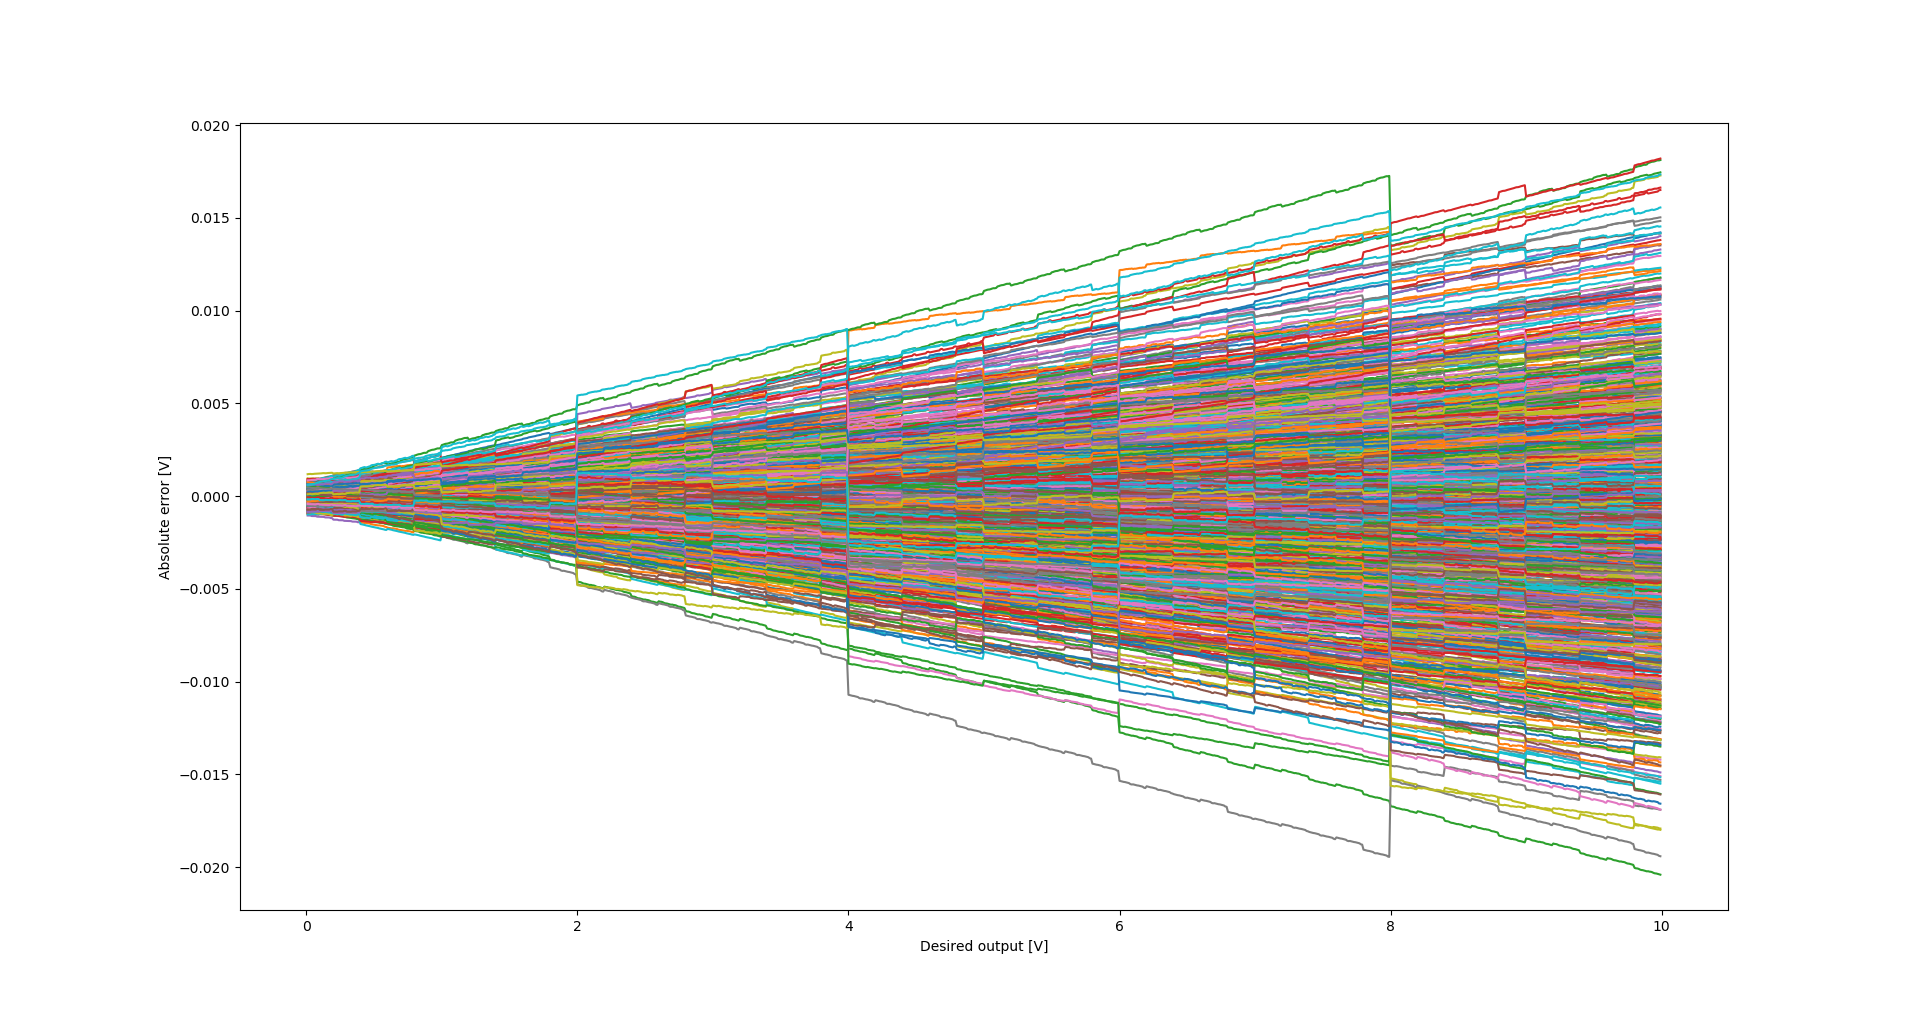
Out of curiosity, I also checked how this plot would look like if I specified 1% resistors in the circuit:
Monotonicity of the circuit with worse accuracy resistors (1%) - simulation data It can be seen that the possible loss of monotonicity is much more probable and more steps with possible loss can be observed.
-
Prototype #2
05/30/2023 at 21:39 • 0 commentsThe second prototype was soldered on a hot plate - maybe it is the reason why the accuracy is worse than for prototype #1, that was hand soldered?
Another source of error in this case is the output resistor R29 - its value is 1k in this case and that, together with input resistance of the voltmeter form a voltage divider that observably decreases the measured voltage. The difference of output voltage is +1mV for 8.66V set voltage when measured before R29!
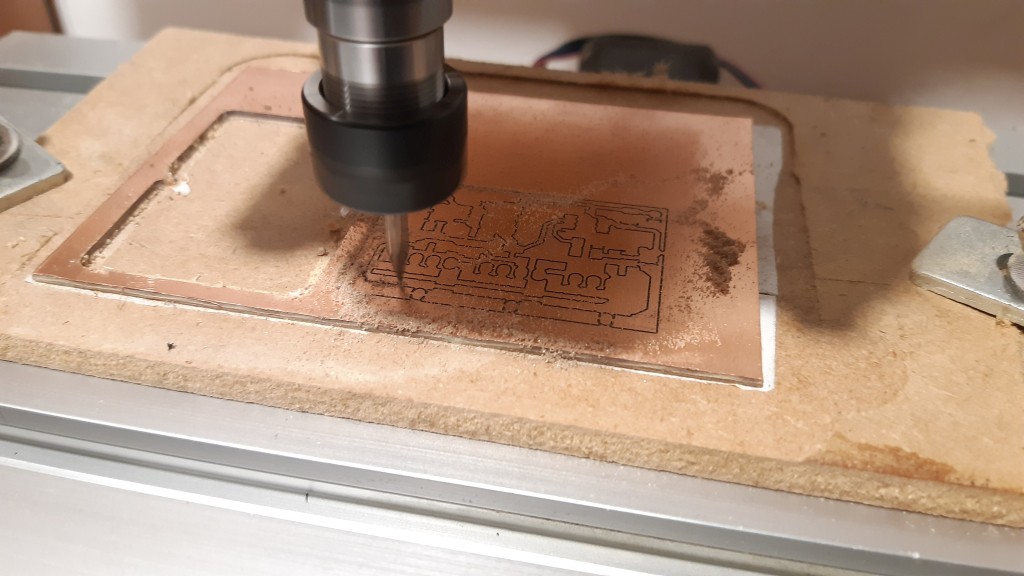
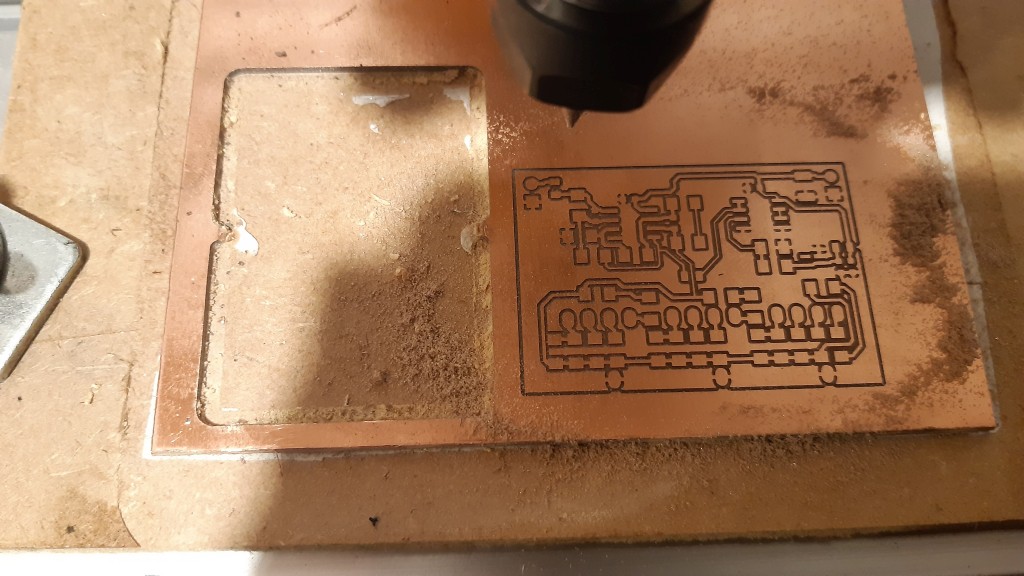
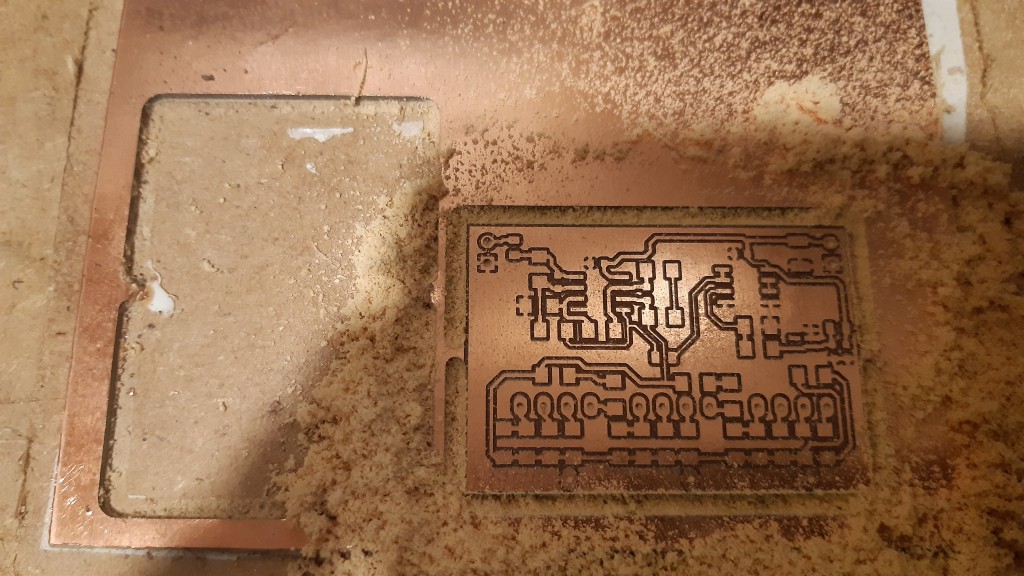
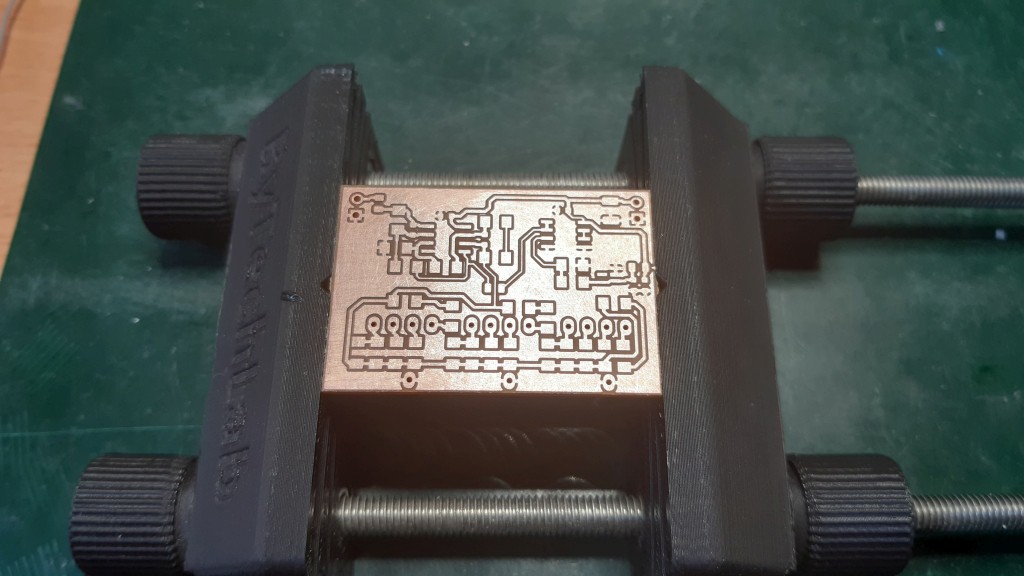
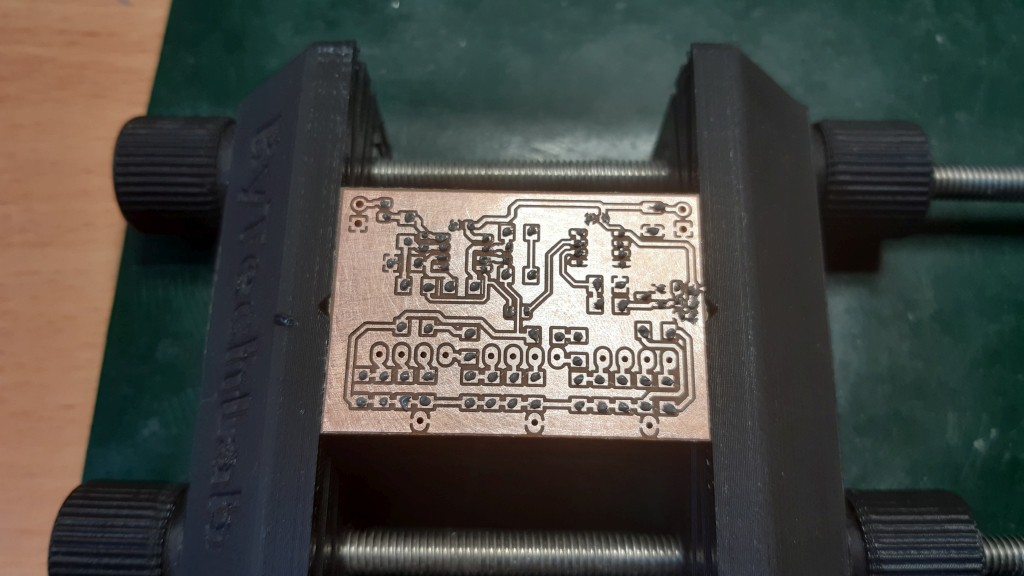
This is the short pictorial story of prototype #2 being created:
Milling, drilling, outside cutting:
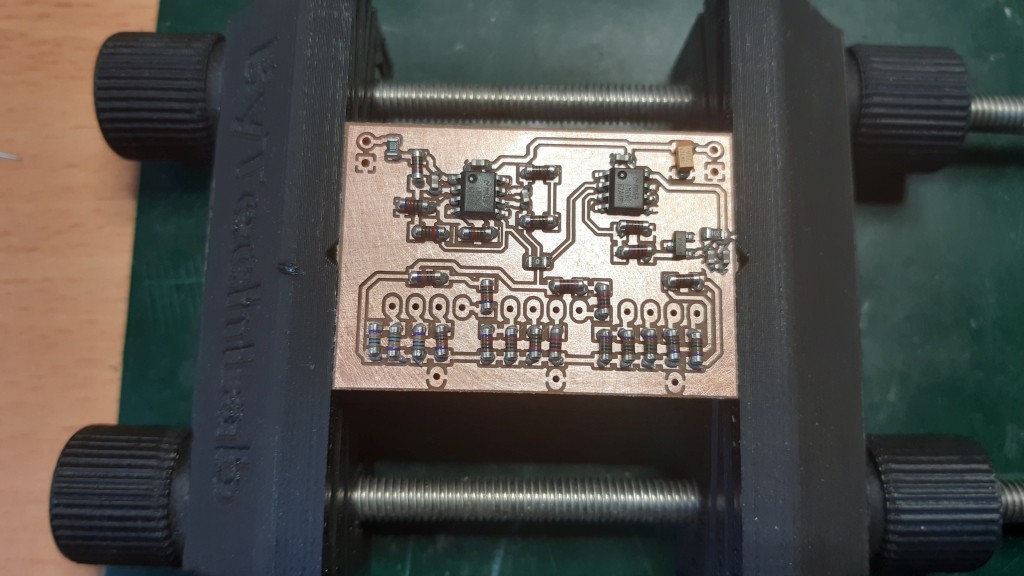
The long past-due SnPb solder paste is dispensed using a handheld dispenser:
The components are placed by hand:
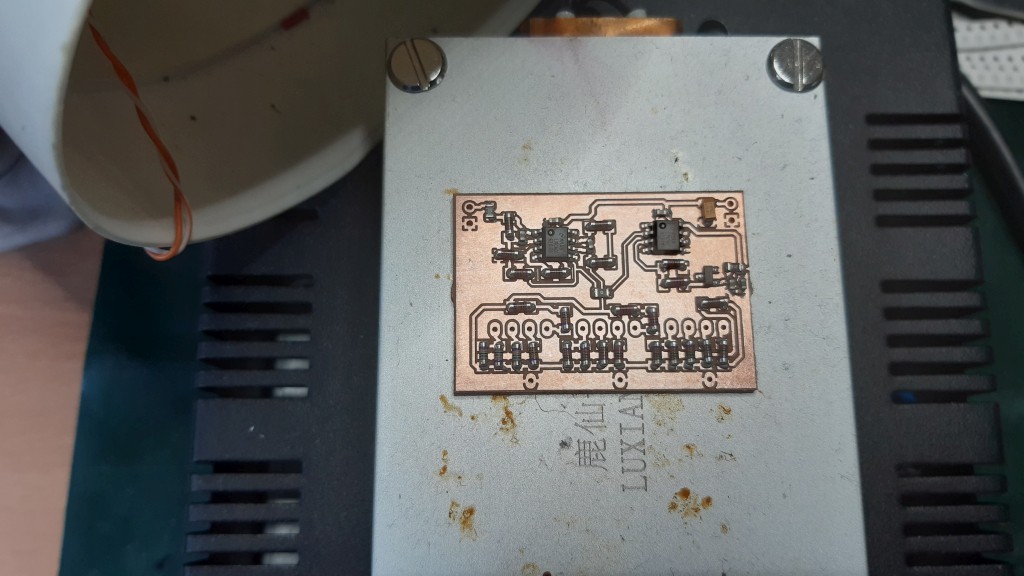
A homemade hotplate is used to solder everything together (note the fume extractor above-left):
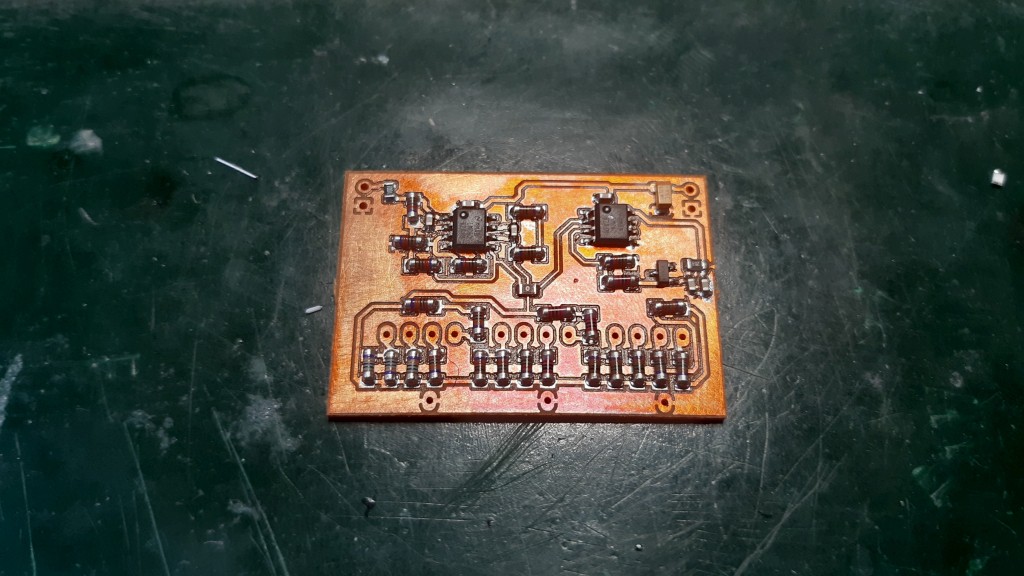
SMD components are soldered, but the copper got discolored due to the heat and lack of protection layer on top:
The remaining part was to solder the through-hole switches and the power supply input wires and the output wires.
-
Measurements
05/30/2023 at 21:29 • 0 commentsTheoretical results for error calculation, now with measurements!
I made 2 prototypes and measured the output voltage of both prototypes. The results are shown below.
Ambient temperature during measurements: 24°C
Supply voltage: 9.99V
Voltmeter used: Brymen BM857a
Prototype #1 set value [V] measured value [V] error [mV] error [%] 0 0.03528 35.28 --- 0.15 0.15125 1.25 0.833 1.34 1.34085 0.85 0.063 1.79 1.79069 0.69 0.039 2.12 2.12023 0.23 0.011 3.12 3.11964 -0.36 -0.012 3.77 3.76934 -0.66 -0.018 4.33 4.32833 -1.67 -0.039 4.85 4.8478 -2.20 -0.045 5.25 5.2482 -1.80 -0.034 6.49 6.4867 -3.30 -0.051 6.95 6.9462 -3.80 -0.055 7.28 7.276 -4.00 -0.055 8.28 8.2811 1.10 0.013 8.66 8.661 1.00 0.012 Prototype #2 set value [V] measured value [V] error [mV] error [%] 0 0.00339 3.39 --- 0.15 0.14943 -0.57 -0.380 1.34 1.33838 -1.62 -0.121 1.79 1.78795 -2.05 -0.115 2.12 2.11742 -2.58 -0.122 3.12 3.1162 -3.80 -0.122 3.77 3.76559 -4.41 -0.117 4.33 4.3237 -6.30 -0.145 4.85 4.8431 -6.90 -0.142 5.25 5.2427 -7.30 -0.139 6.49 6.4809 -9.10 -0.140 6.95 6.9405 -9.50 -0.137 7.28 7.27 -10.00 -0.137 8.28 8.27 -10.00 -0.121 8.66 8.6495 -10.50 -0.121 Relative error with dots indicating measurement results: Yellow - prototype #1, red - prototype #2 Absolute error with dots indicating measurement results: Yellow - prototype #1, red - prototype #2 As can be seen, the measurements lie within the limits indicated by the simulation.
-
Theoretical accuracy
05/25/2023 at 21:39 • 0 commentsTheoretical accuracy
The accuracy of the circuit was estimated using a Python script, implementing a MonteCarlo like estimation.
The following sources of errors were considered:
Accuracy of the resistors: +-0.1%
Offset voltages of the opamps: +-0.1 mV
Accuracy of the LM4040: +-0.1%
Contact resistance: 0 to 0.1 Ohm
Relative error
Absolute errorFor most of the range, the relative error is usually below 0.1%. In terms of absolute error, in most cases the error stays below 10mV. This is a sufficiently low error for my purposes.
Measurements should follow.
Fully analog digitally controlled voltage source
Voltage is set with three BCD switches with a step of 10mV