 tklenke
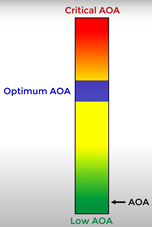
Here is a good explanation of using Angle of Attack in backcounty flying from prolific YouTuber and aviator Backcountry 182. See this section for demonstration of the standardized LED lighting scheme.
Use BLE enabled Arduinos to collect Angle of Attack (AoA) information and display
Already have an account? Log in.
To make the experience fit your profile, pick a username and tell us what interests you.
Here is a good explanation of using Angle of Attack in backcounty flying from prolific YouTuber and aviator Backcountry 182. See this section for demonstration of the standardized LED lighting scheme.
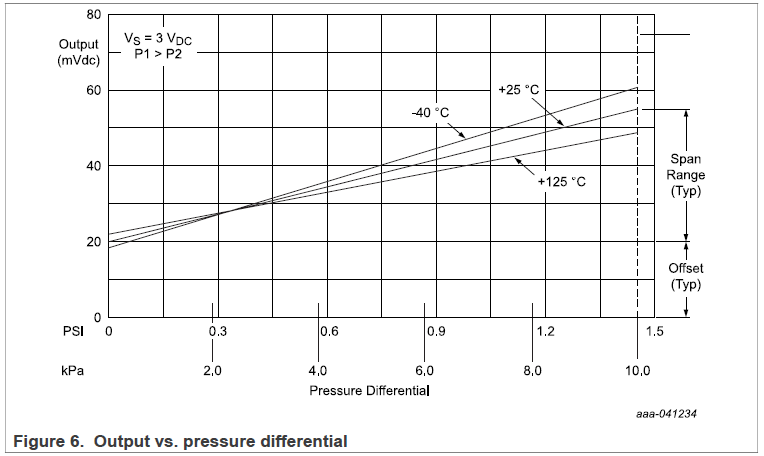
The MPX10DP I purchased has an overpressure limit of 75 kPA, with an operation range of 0 to 10 kPA. 10 KPA = 1.45 PSI. This is equivalent to 248 knots at standard atmosphere. This seems fine, but I am concerned that the gauge reads in milliVolts with a range of 20 to 54. I think the ESP A/D converter only reads in increments of 1 milliVolt. This would mean that we would not have very good resolution.
If this is true, we'll need to consider maybe amplifying the voltage output so we can get a range more like 1000 to 2500 milliVolts, or 50x the output voltage.
Ok...a little digging. There seems to be a method to change the AtoD attenuation in the ESP32 chip. But not clear if this will be easily done. Will need to dig into the drivers for the ESP32 and look for variable ADC_ATTEN_11 for a start.
Ok...github is awesome. Found the header file arduino-esp32/cores/esp32/esp32-hal-adc.h
and tried to compile my project with the following line...it worked.
analogSetPinAttenuation(VBATPIN,ADC_11db);
So now need to carefully try this out with a low voltage signal and different attenuations. Humans can produce about 2.8 psi by blowing, or 19 kPa. So we should be able to blow on the input and max out the pressure without overpressuring the sensor.
typedef enum {
    ADC_0db,
    ADC_2_5db,
    ADC_6db,
    ADC_11db,
    ADC_ATTENDB_MAX
} adc_attenuation_t;

/*
 * Set the attenuation for all channels
 * Default is 11db
 * */
void analogSetAttenuation(adc_attenuation_t attenuation);

/*
 * Set the attenuation for particular pin
 * Default is 11db
 * */
void analogSetPinAttenuation(uint8_t pin, adc_attenuation_t attenuation);
Intention is to set up entire system sending dummy data to get base programming completed prior to any functional testing. Researched existing documents to get a reasonable base line for initial calculations and expected sensor readings.
fRatio = fPfwd/fP45;
#define A 0.0
#define B -16.908083
#define C 42.415008
fAlpha = A*fRatio*fRatio + B*fRatio + C
#define A .0419
#define B -0.8279
fPSI = A*fVolts + B
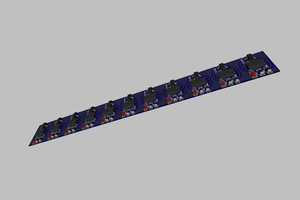
See sketch Strip_Test.ino for testing performed. I found that the brightness control on this strip is non-linear. Brightness is a unit8, but at value over 70 a fully blue LED will start to decrease in brightness and at above 100 goes completely dark.
For five levels of brightness the following seems to be a reasonable choice.
uint8_t auBrightness[] = {1,3,5,8,25};And for colors I phoned a friend and got the following values for the ROYGBIV colors
//colors
#define RED 255, 0, 0
#define ORANGE 255, 80, 0
#define YELLOW 255, 255, 0
#define GREEN 0, 255, 0
#define BLUE 0, 0, 255
#define INDIGO 75, 0, 130
#define VIOLET 148, 0, 211
#define WHITE 255,255,255
#define TRUE_WHITE 0, 0, 0, 255
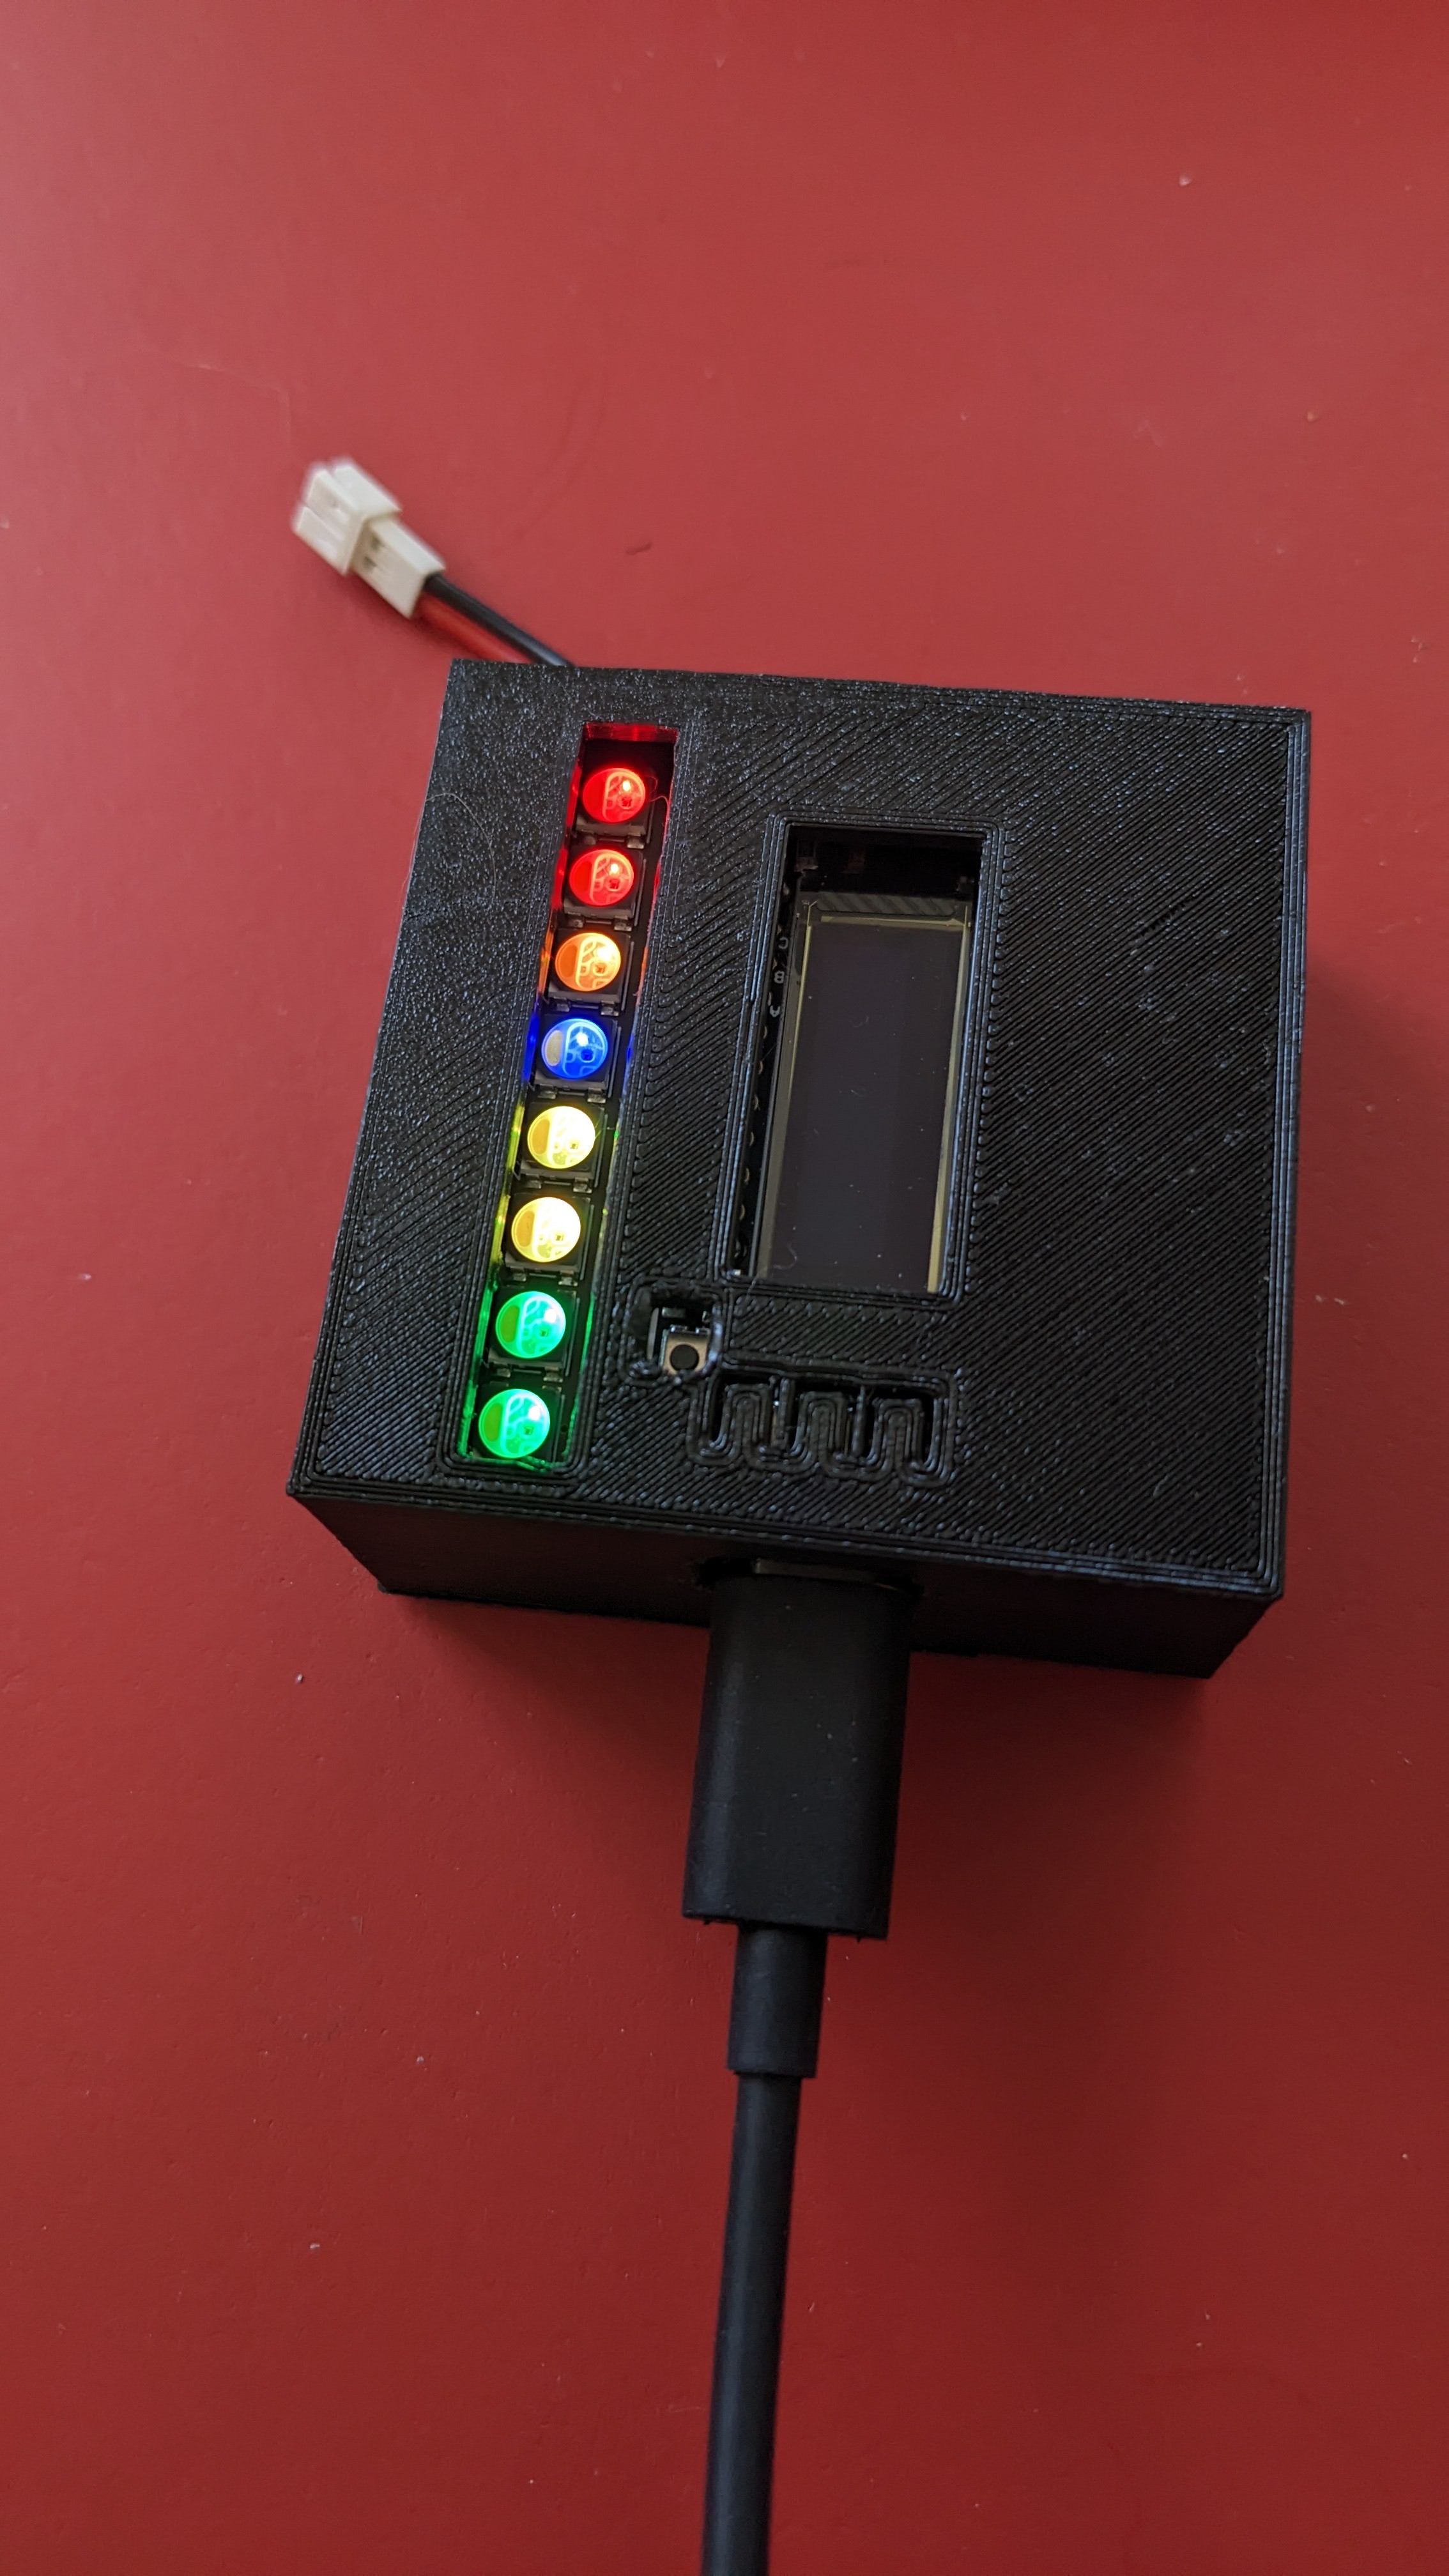
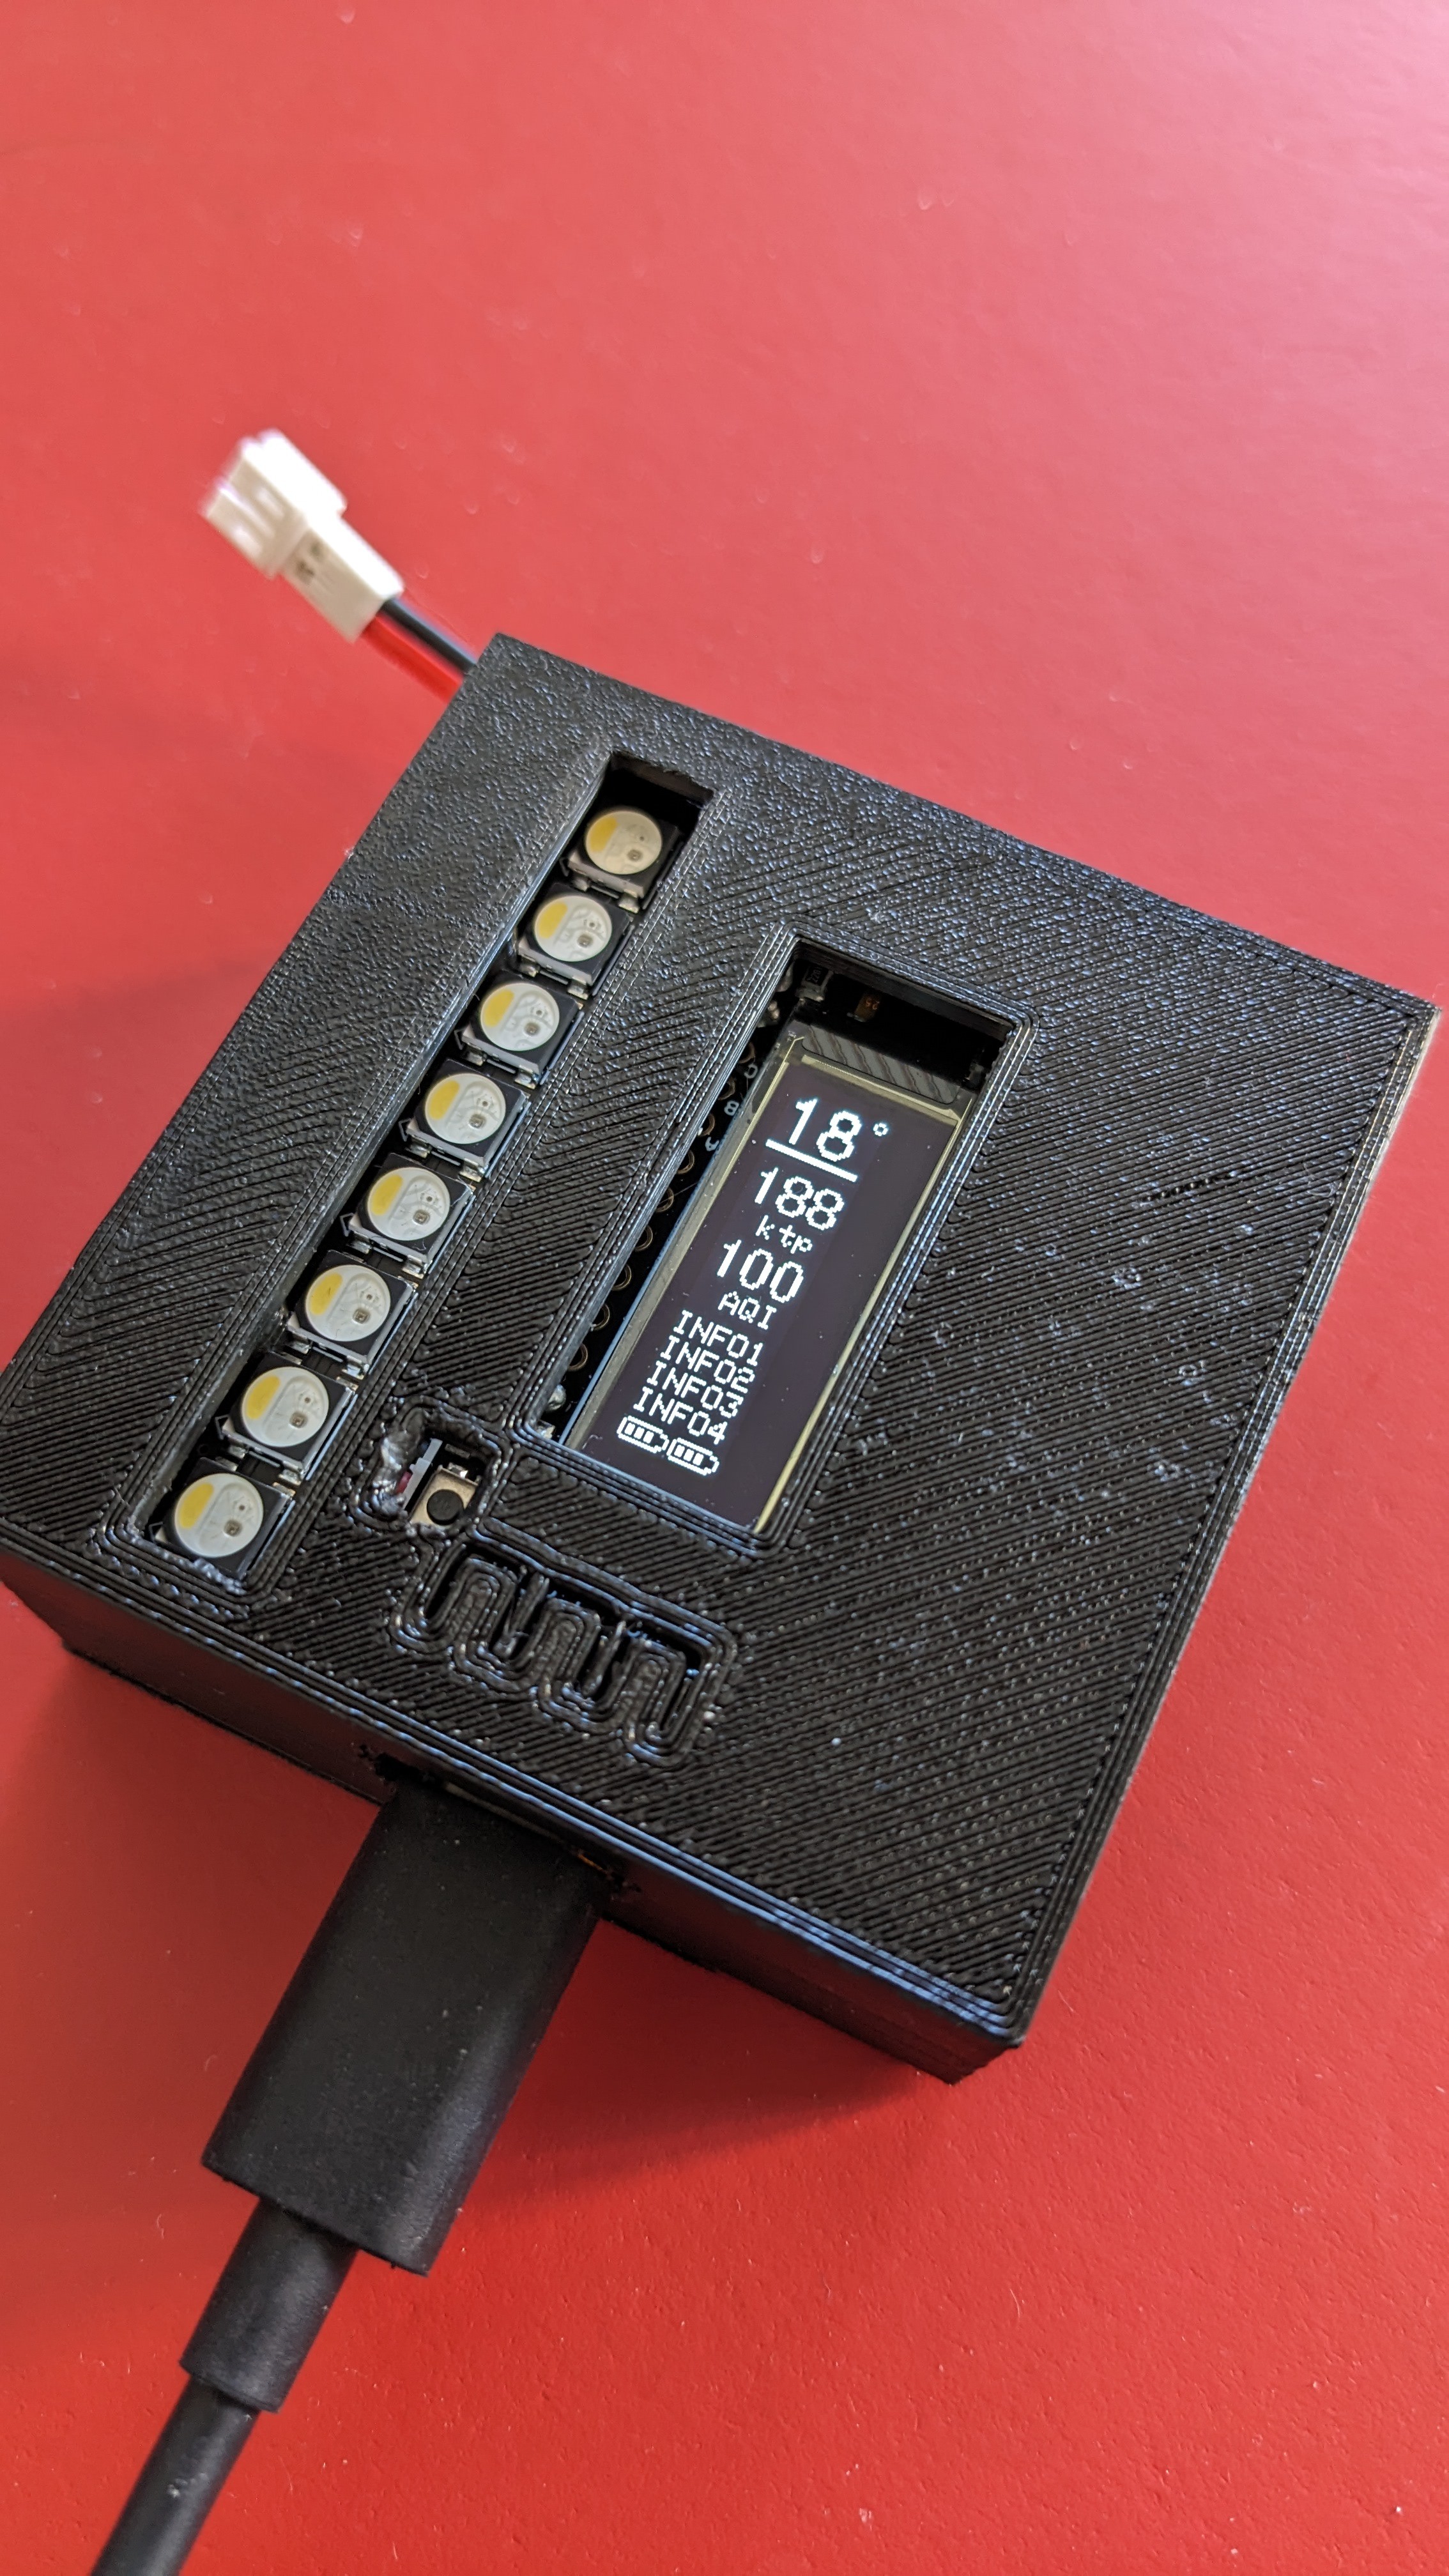
#define OFF 0, 0, 0, 0Here is the display at a brightness of 8 with the LEDs set to my initial AoA scheme [Red, Red, Orange, Blue, Yellow, Yellow, Green, Green]
Ideally we will collect data from the unit and calculate our cruise AoA, landing AoA (1.3 Vso) and stall speed Vso from empirical data. But to get started I looked into the theoretical AoA information for the PA-18 Supercub, our intended test bed.
Found The Incomplete Guide to Airfoil Usage to determine the airfoil in use on a PA-18, which is the USA 35B. Found NACA Report 233 on the airfoil as well as listing in Airfoil Tools
Been a hot minute since I calculated Reynold's number, so asked to phone a friend. Need to vet this but here's a start.
Certainly! Let's calculate the Reynolds numbers for the given velocities:
So something like 2,000,000 to 6,000,000
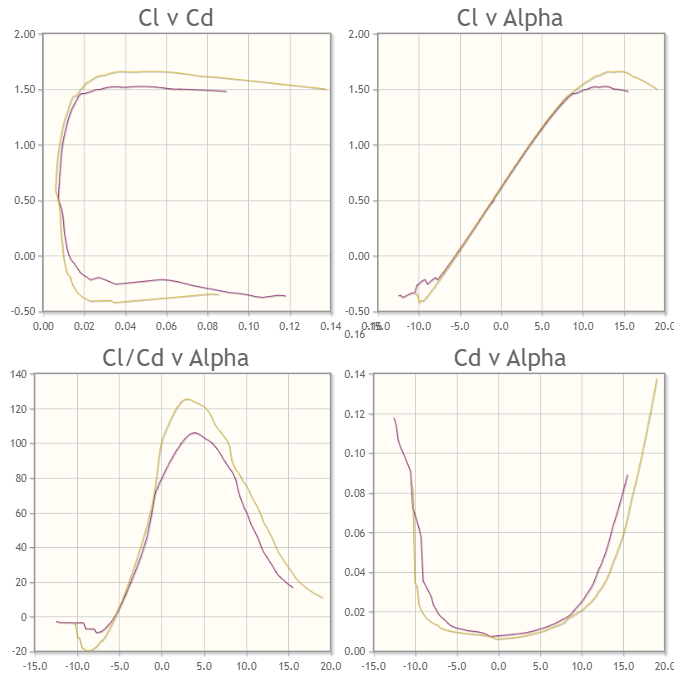
Airfoil Tools gives us the following plots for Re 500,000 and 1,000,000
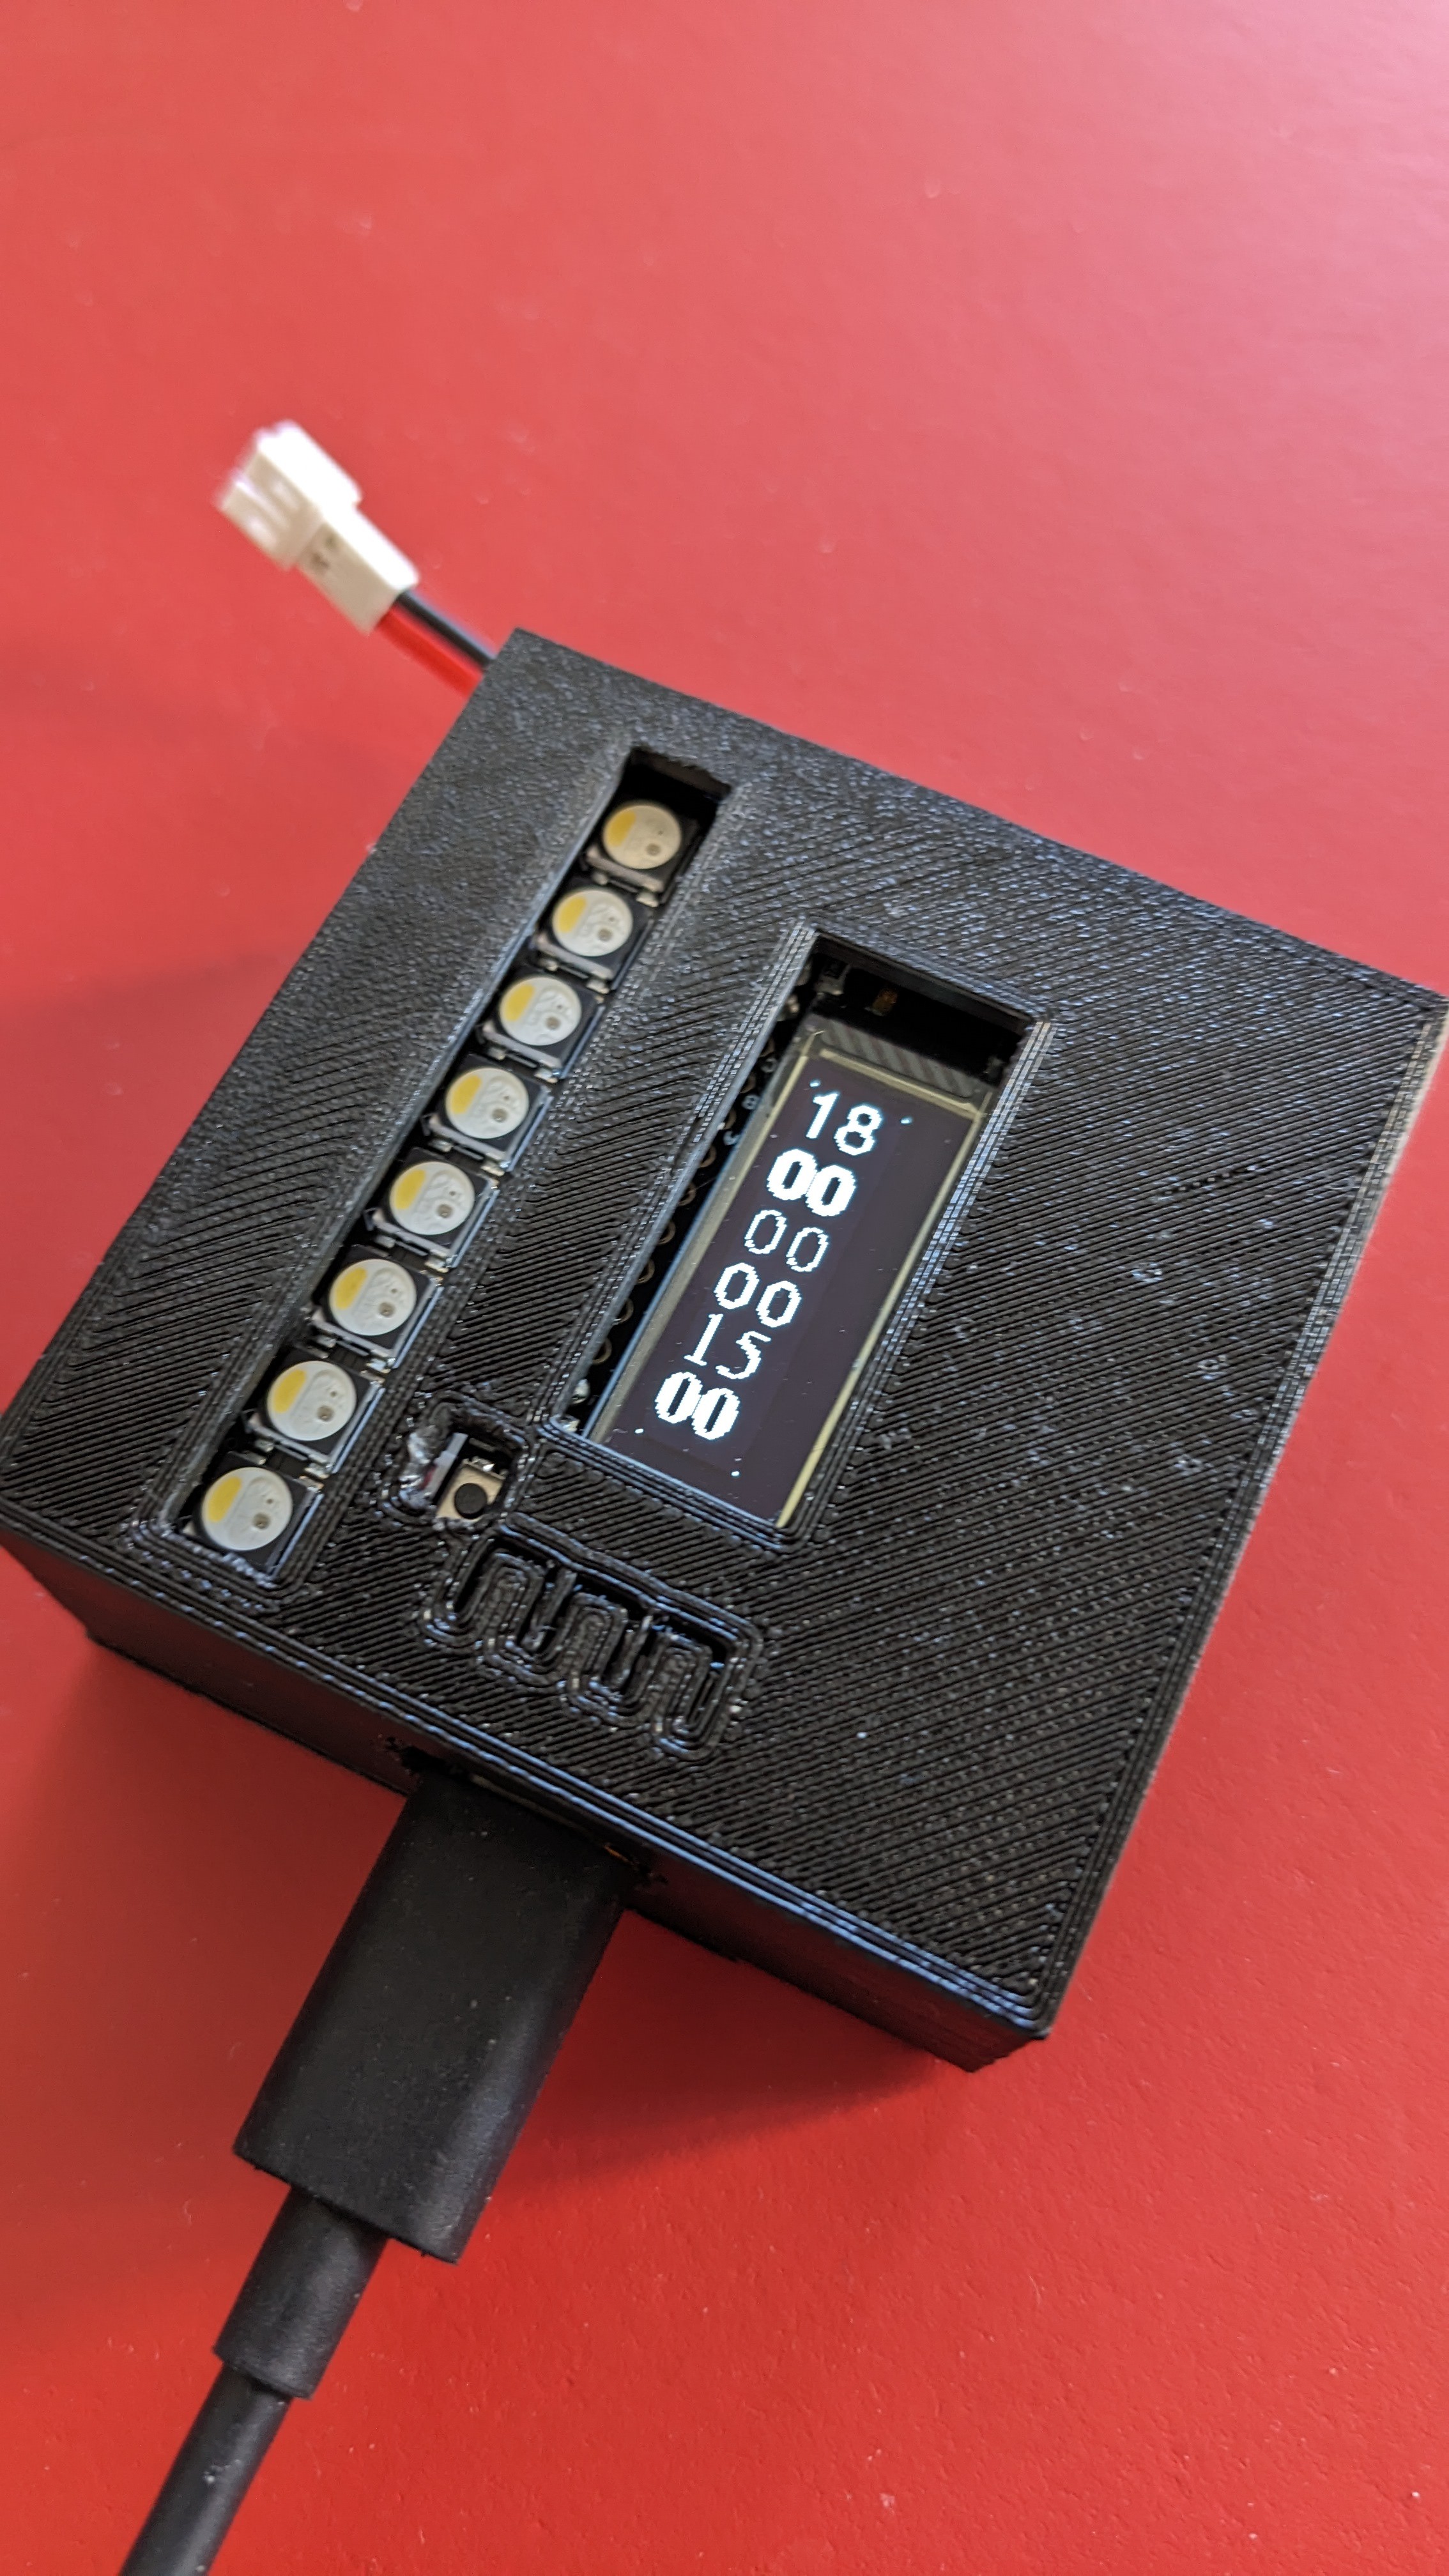
OLED Testing available in the Sketch display_testing.ino
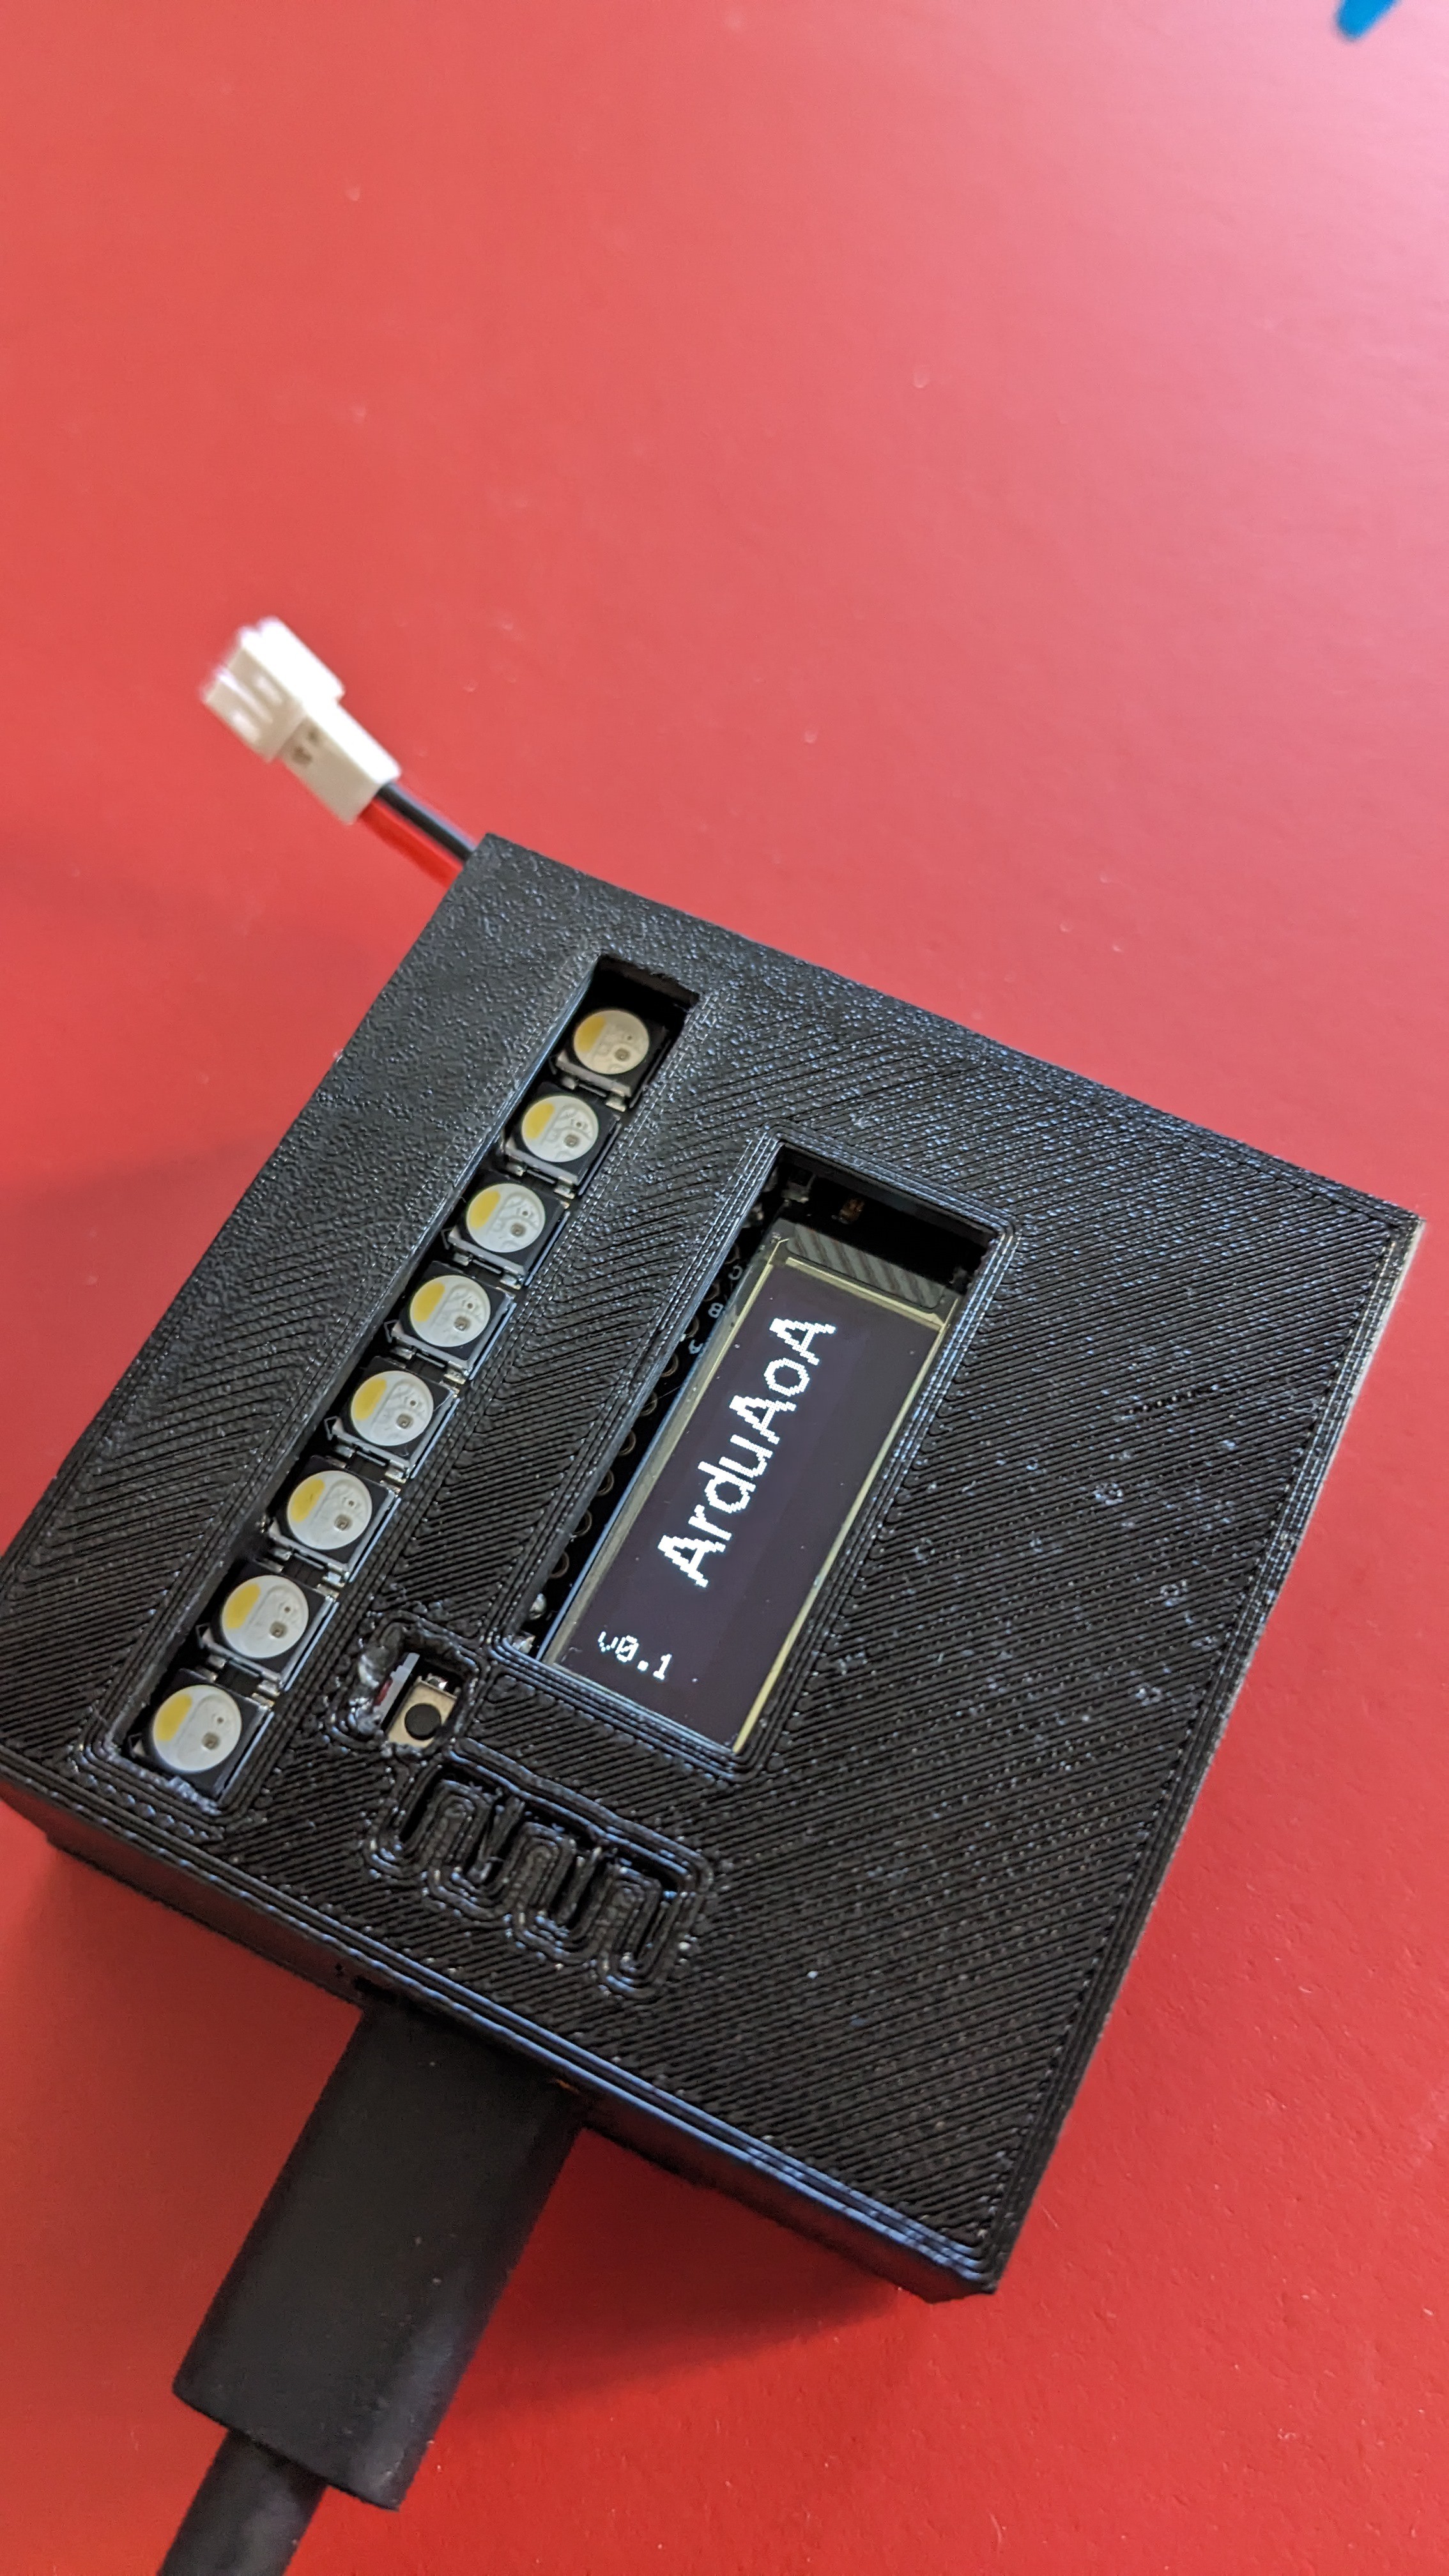
Version 1 of the screen layout
Splash Screen
Font testing
Line Spacing testing
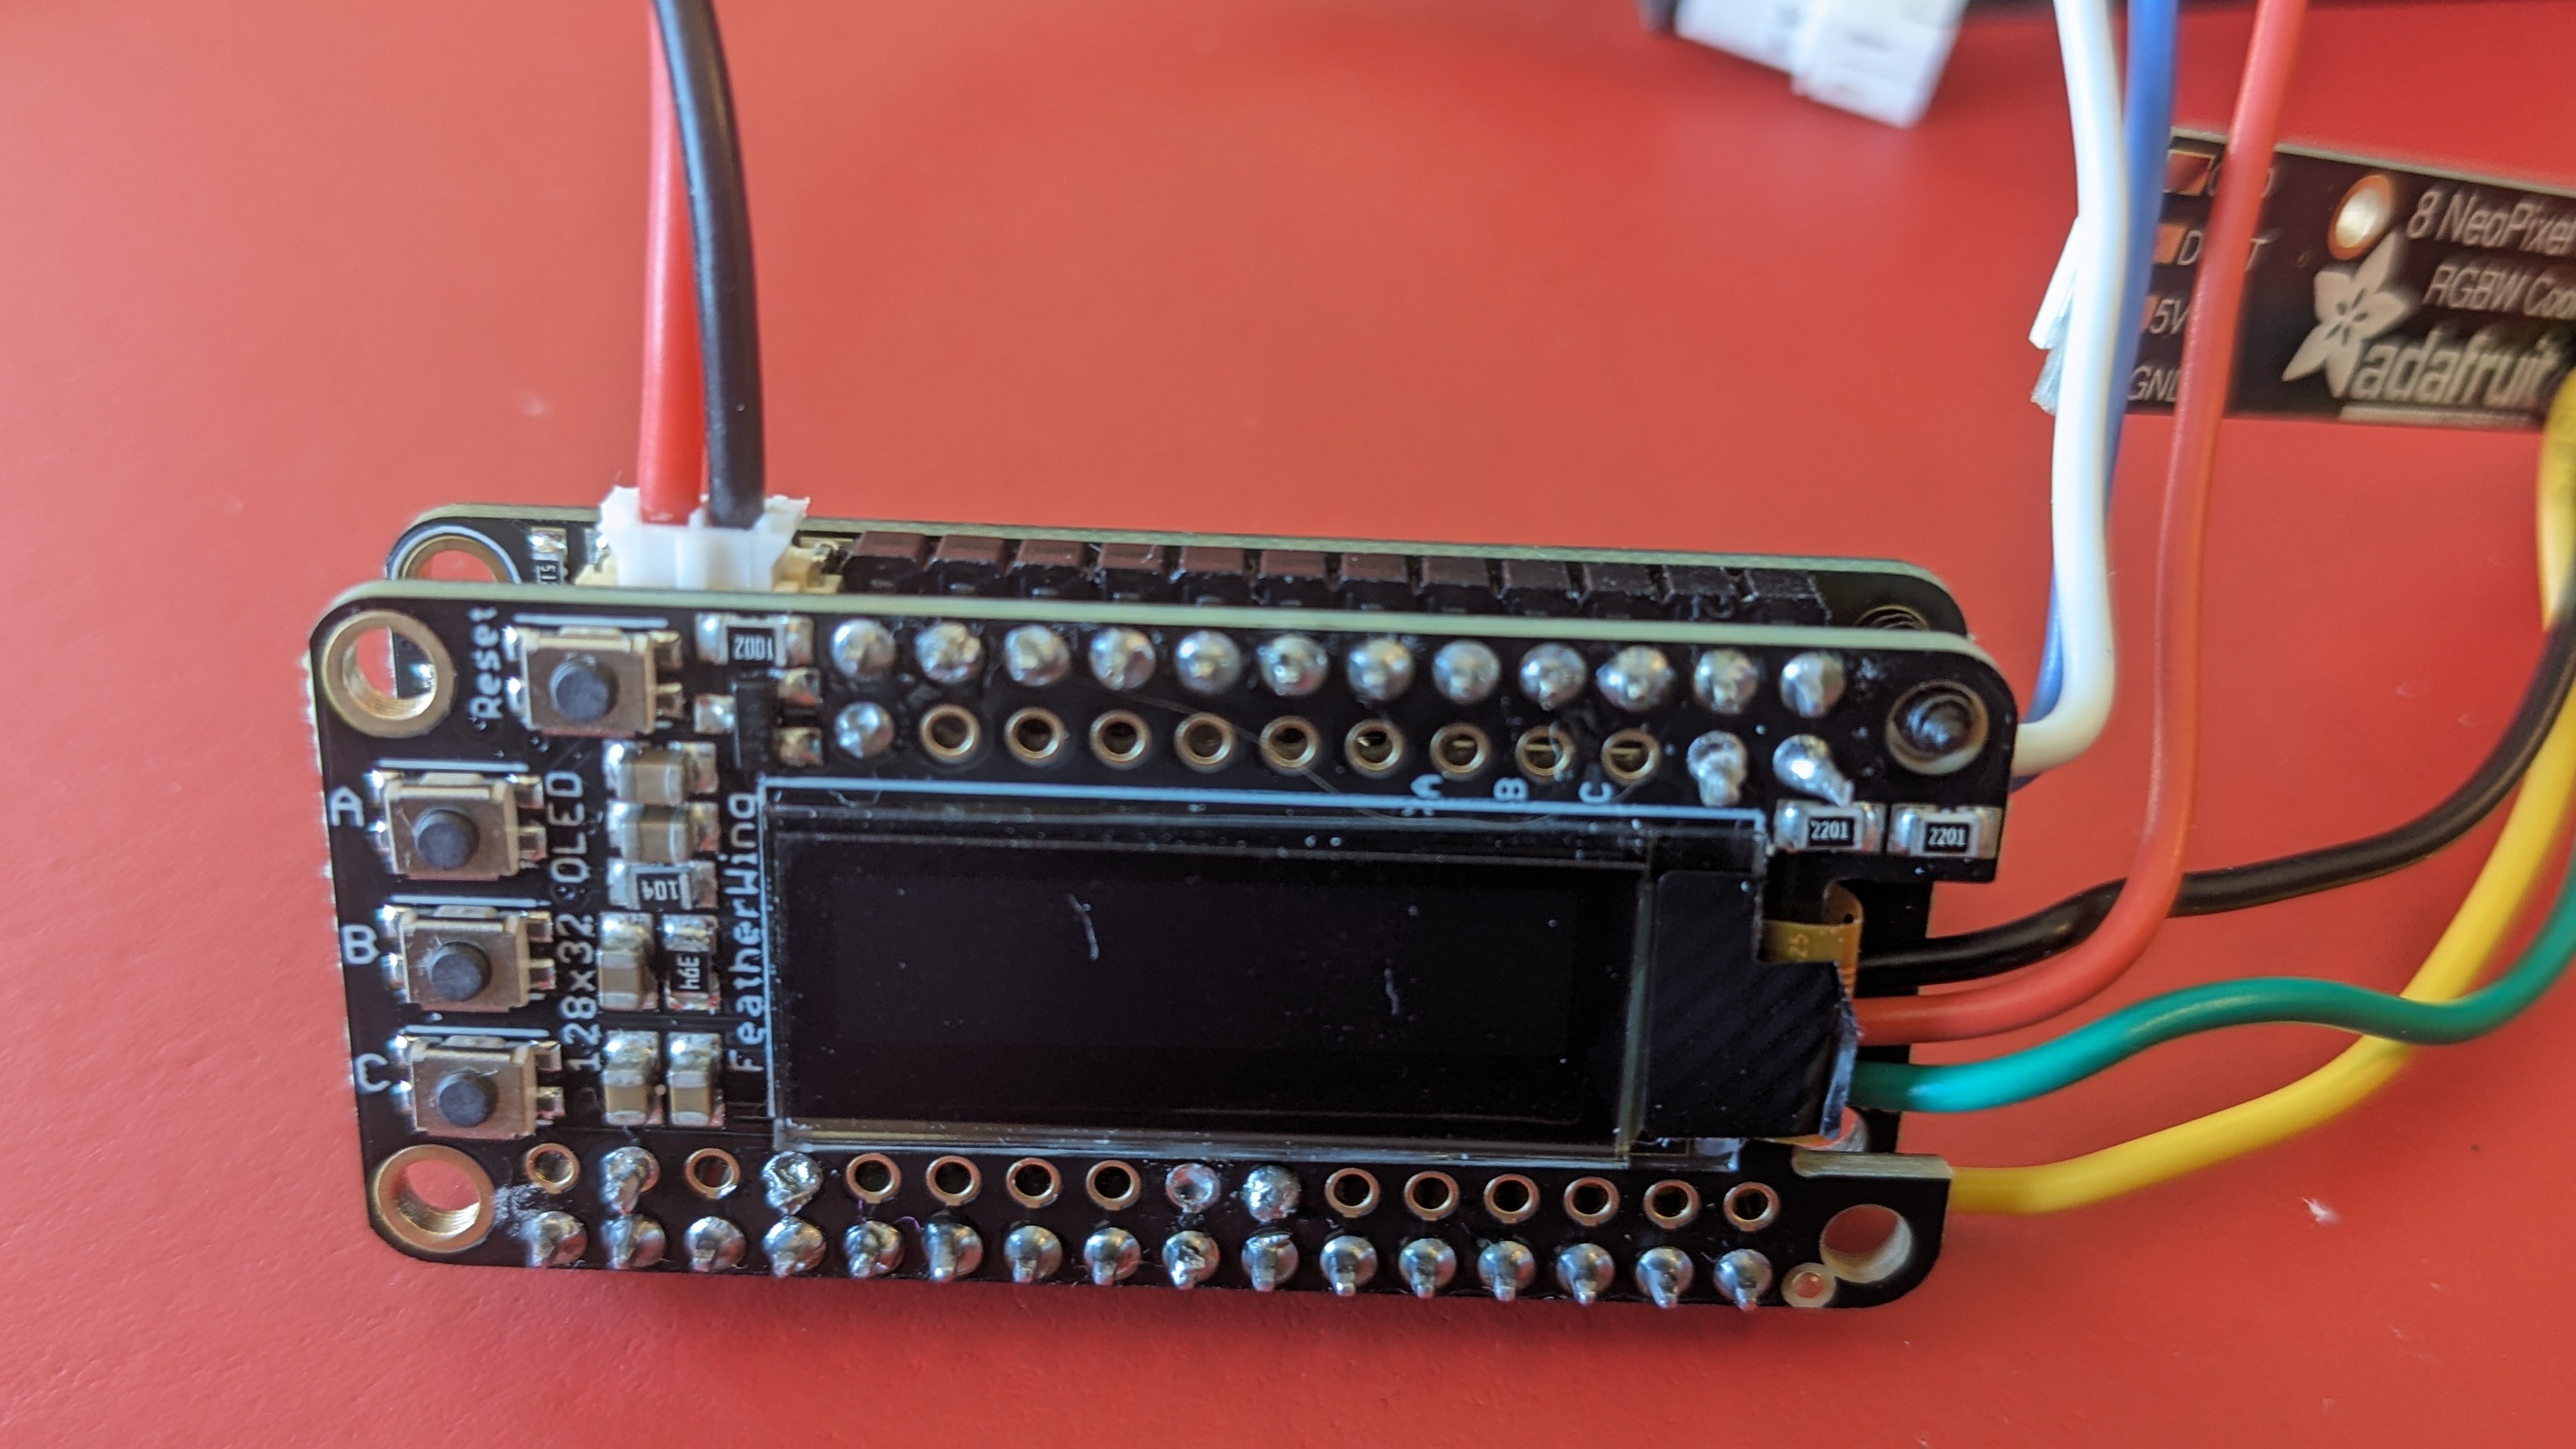
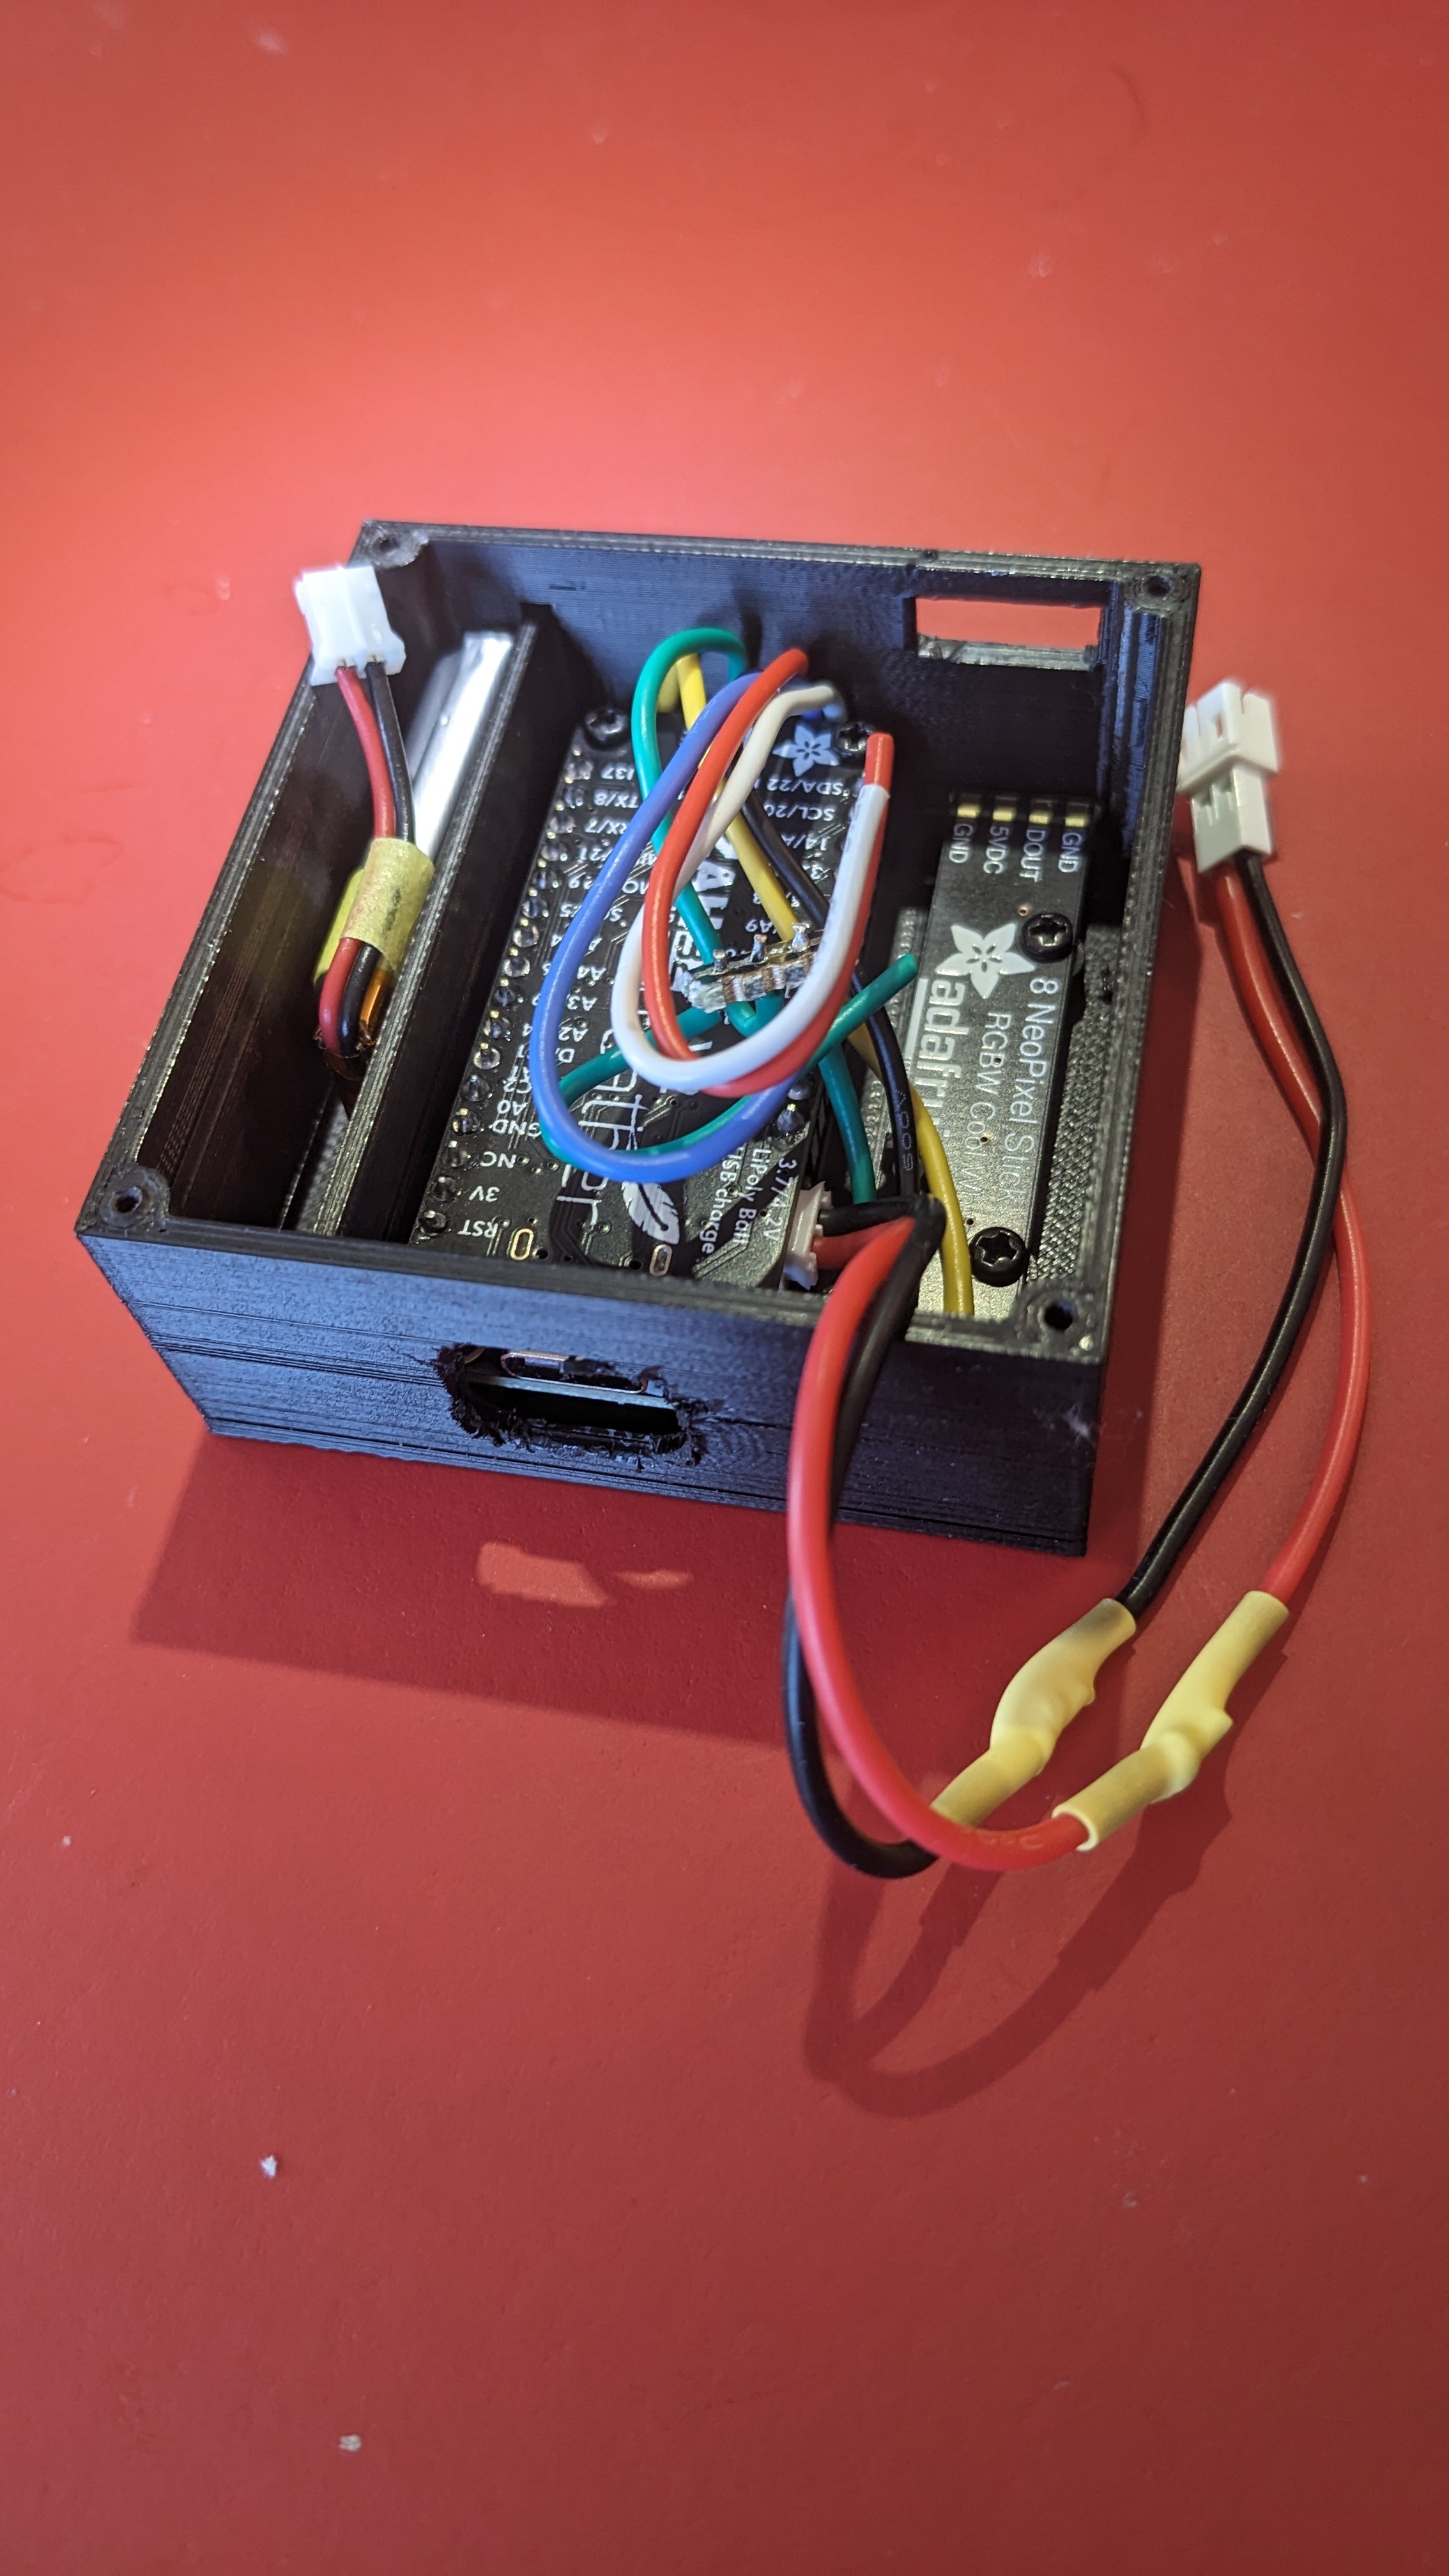
Follow steps to solder connections:
After making all connections, I was not able to successfully use the LED strip. After some head scratching, I realized that I had connected the digital signal line to A4 on the Feather. Turns out this is an INPUT only pin. Duh. So removed and soldered into A5. Ops Chk OK!
Following changes required to version 1 of the Display enclosure.
Holes in standoff etc work well for 2mm and at least a few turns of 2.3mm
Used 2x5mm for LED to enclosure and 2.3 x 10mm for two holes of the Feather/Wing to the enclosure. Really need longer 12mm or 14mm.
Enclosure is serviceable as is. See photos. (Note: I did not yet install the side switch for power)
I wanted to add CO monitoring to the display, as it should be very easy and would be another way to track CO. I originally bought the Adafruit MiCS5524 CO, Alcohol and VOC Gas Sensor. Turns out that chip is 5V and I don't have 5V available. I could use USB voltage, which would require plugging in which I'd like to avoid. Or I could get a voltage booster, like the PowerBoost 500 Basic - 5V USB Boost @ 500mA from 1.8V+. Then I would have to do a voltage divider to ensure the output was within what the Feather can handle. Doable. But at that point, I could really just get a 3v VOC sensor.
3V compatible VOC sensor options:
Adafruit sells the Bosch BME688 which also senses temperature, pressure and humidity. Temperature and pressure would be nice. Uses I2C. Current consumption (peak) 3mA
Another alternative is the Adafruit SGP40 Air Quality Sensor Breakout - VOC Index for $15. I2C interface. Current consumption 2.6mA.
So, we need to make provisions to solder the gas sensor into the I2C connections that will be shared with the OLED display.
Cut 2.0 x 1.5 breadboard lengthwise such that one piece had the center screw holes intact.
P1 is pressure side of pressure sensors. P1 is port closest to Pin 4. Pin 1 is the notched pin. Solder pressure sensors to breadboard such that the P1 ports are towards the back of the enclosure so that the tubing has the greatest bend radius available. This will mean that the sensors are soldered with pin one facing the front of the enclosure (front being the side with the pitot probe)
Probe.ino has Pitot Pressure (Pfwd) voltage on Pin A2 and Angled Probe Pressure (P45) voltage on pin A3.
Pressure Sensors current draw is 6 mAdc at 3v. The Feather board voltage regulator can produce an excess 250mA after powering the ESP chip, enabling the Feather board to supply the 12 mA for the pressure sensors.
This leaves us with the following connections.


 FuzzyNoodle
 Christoph Tack
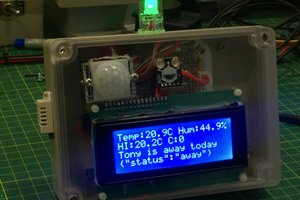
 Tony Kambourakis
 Dimitar