Close
0%
0%

ARDUINO MPPT SOLAR CHARGE CONTROLLER

An Arduino based Solar MPPT charge controller.

Similar projects worth following
In India most of the people are living in rural areas,400 million people that are currently have no access to electricity.Despite India being the world's 5th largest energy producer,the existing electric grids are not capable of supplying the electricity need to those poor people.
So the need for clean, affordable alternatives is obvious.Solar power have the advantage of being less maintenance and pollution free.
To provide basic need of electricity and improve the socio-economic positions of rural people, I started this project from basic lighting system and a simple PWM solar charge Controller in March-2014.The feedback was incredible on Instructables. After working over one year to improve the controller, I have landed up in this stage.This project is on MPPT solar charge controller which can charge a commonly used 12V lead acid battery from a solar panel.This is more sophisticated,30 to 40 % more efficient and have several advantages over the other charge controllers.


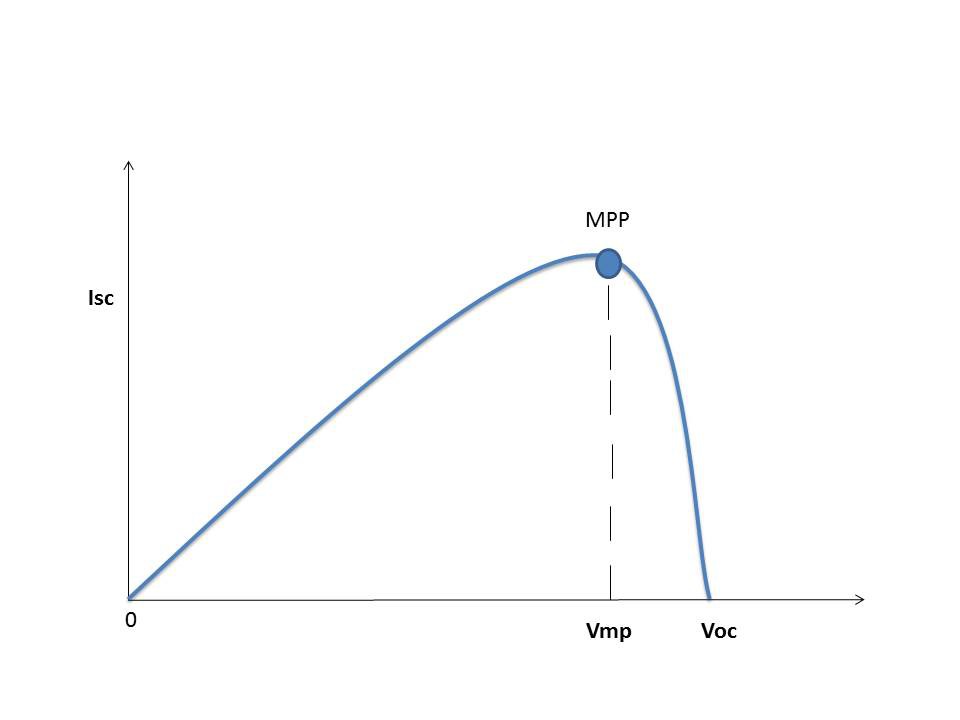
MPPT stands for Maximum Power Point Tracking. MPPT charge controllers used for extracting maximum available power from PV module under certain conditions.The Maximum Power Point Tracker (MPPT) circuit is based around a synchronous buck converter circuit.It steps the higher solar panel voltage down to the charging voltage of the battery. The Arduino tries to maximize the watts input from the solar panel by controlling the duty cycle to keep the solar panel operating at its Maximum Power Point.

You can find more details on MPPT here

Algorithm :


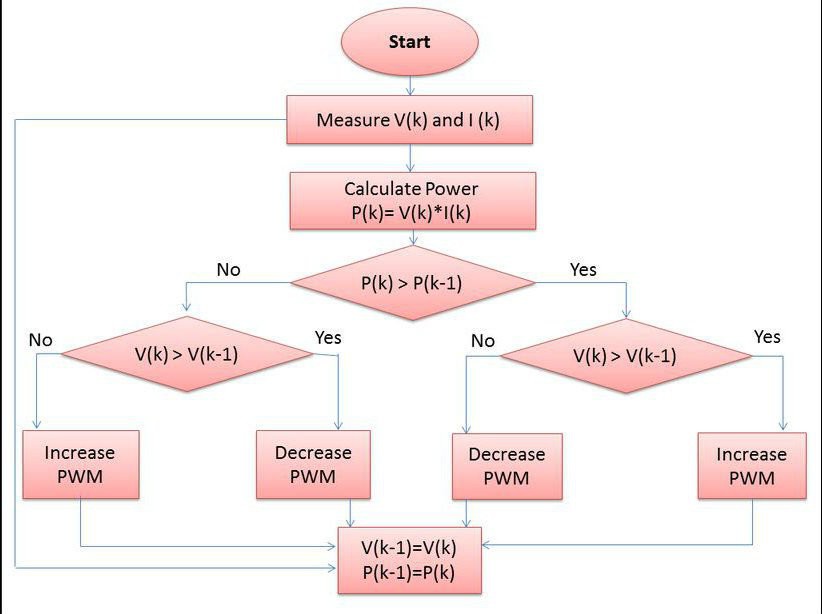
The Maximum Power Tracker uses an iterative approach to finding this constantly changing MPP. This iterative method is called Perterb and Observe or hill climbing algorithm.To achieve MPPT, the controller adjusts the voltage by a small amount from the solar panel and measures power, if the power increases, further adjustments in the direction are tried until power no longer increases.

The voltage to the solar panel is increased initially, if the output power increase, the voltage is continually increased until the output power starts decreasing. Once the output power starts decreasing, the voltage to the solar panel decreased until maximum power is reached. This process is continued until the MPPT is attained. This result is an oscillation of the output power around the MPP.

Specification of version-3 charge controller :

1.Based on MPPT algorithm

2. LED indication for the state of charge

3. 20x4 character LCD display for displaying voltages,current,power etc

4. Overvoltage / Lightning protection

5. Reverse power flow protection

6. Short Circuit and Over load protection

7. Wi Fi data logging

8.USB port for Charging Smart Phone /Gadgets

Electrical specifications :

1.Rated Voltage= 12V

2.Maximum current = 5A

3.Maximum load current =10A

4. In put Voltage = Solar panel with Open circuit voltage from 12 to 25V

5.Solar panel power = 50W

  • 1 × Arduino Nano Atmega328P based Microcontroller
  • 3 × Current Sensor ACS712 hall effect Current Sensor
  • 2 × LM2596 module DC-DC Buck Converter module
  • 1 × ESP8266 WiFi SOP module
  • 1 × 20x4 char LCD display Yellow Serial 2C/TWI 2004 20X4 Character LCD Module Display

View all 49 components

  • Battery Temperature and Charging Voltage Compensation

    Open Green Energy09/16/2015 at 09:45 0 comments

    All chemical reactions are affected by temperature. Battery charging is also an electrochemical reaction, so it too is affected by temperature. As the battery gets warmer, the gassing increases. As the battery gets colder,it becomes more resistant to charging. So battery charging voltages should be corrected based on battery temperature. This adjustment is referred to as temperature compensation, a charging feature that helps ensure that a battery is neither undercharged nor overcharged regardless of battery temperature.

    Using normal target voltages to charge a battery that is colder than approximately 25ºC (77ºF) will result in an undercharged battery, which will deliver lower performance, reduced life and a higher life cycle cost. Applying normal target voltages to a battery that is hotter than 25ºC may result in an overcharged battery. This condition could lead to the drying out of VRLA battery cells. With flooded cells, the result will be excessive outgassing, increased battery maintenance in the form of more frequent watering and reduced battery life due to thermal stress. In fact, some battery manufacturers and charger manufacturers recommend not charging a battery that is 50ºC (122ºF) or hotter.

    Temperature Sensor :

    To monitor the battery temperature a DS18B20 1-Wire digital temperature sensor from Maxim IC will be used. It can measures temperatures from -55°C to +125°C. Fahrenheit equivalent is -67°F to +257°F with ±0.5°C accuracy.

    We choose a waterproofed version of the DS18B20 Temperature sensor. It is quite handy to measure something far away, or in wet conditions.

    You can see it here

    You can see the Data Sheet

    Temperature Compensation Formula:

    minus 0.018 volts per degree Celsius

    Example :

    1. Let the battery temperature is 0 degC and float voltage is 13.8V ( STC : at 25degC )

    Compensation Required = ( 0 - 25) * ( - 0.018 ) = + 0.45V

    Compensated Float Voltage = 13.8 + 0.45 = 14.25 V

    2. Let the battery temperature is 35 degC and float voltage is 13.8V ( STC : at 25degC )

    Compensation Required = ( 35 - 25) * ( - 0.018 ) = - 0.18V

    Compensated Float Voltage = 13.8 - 0.18= 13.62 V

    So cold batteries ( example-1) require a higher charge voltage in order to push current into the battery plates and electrolyte, and warmer batteries( example-2 ) require a lower charge voltage to eliminate potential damage to valve regulated lead acid (VRLA) cells and reduce unnecessary gassing if flooded cells are used.

    Reference : http://solarprofessional.com

  • Software requirements for MPPT controller V3.1

    Open Green Energy08/30/2015 at 15:06 2 comments

    Software requirements for MPPT controller V3.1

    Draft by Keith Hungerford, updated 12th September 2015

    Charging states

    The charger operates in one of several charging states, depending on the sunlight level.

    Charger OFF state

    At nil or low sunlight levels, as indicated by solar voltage below battery voltage + 0.5 Volts, the charger state is OFF.

    Transition from the OFF state occurs when

    a) if battery voltage is greater than 11.5 volts and solar voltage rises above battery voltage + 0.5 Volts

    b) if battery voltage is less than 11.5 volts and solar voltage rises above 12.5 volts.

    When either of these voltage conditions is met the charger goes into one of the following states:

    i) Float state if the battery voltage is greater than the Float voltage;

    ii) Boost state if the battery voltage is less than the Float voltage and the Boost time since the last night time is less than [1 hour];

    iii) Bulk state if the battery voltage is less than the Float voltage and the Boost time since the last night time is greater than [1 hour]

    In all 3 cases initially the controller will use the DCM charging algorithm.

    Boost DCM and Bulk DCM states

    When in the Boost DCM or Bulk DCM state, the charger can go to OFF state if the solar voltage falls below (battery voltage + 0.5 Volts).

    The charger can go to Boost CCM or Bulk CCM state if the Solar Power rises above 10% of the rated power.

    The charger can go to the Float state if Battery voltage rises above Float.

    The charger can go from Boost DCM to Bulk DCM if the Boost time since the last night is greater than Boost duration.

    Boost CCM and Bulk CCM states

    When in the Boost CCM or Bulk CCM state the charger can go to Boost DCM or Bulk DCM if the Solar Power falls below 10% of rated power.

    • The charger can go from Boost CCM to Bulk CCM if the Boost time since the last night is greater than Boost duration


    Float state

    The float state is functionally the same as Bulk state when the battery voltage reaches Float.

    When in Float state the charger keeps just sufficient current flowing to the battery to maintain the battery voltage at Float.

    Charging algorithms


    CCM algorithm

    Continuous Current Mode (CCM) applies when the available solar power is more than 10% of the rated power (strictly, when the current in the inductor always flows towards the battery, but this is difficult to measure directly in the software so we use the power level as a proxy estimate).

    In this mode, the PWM period is set at 12 microseconds. The PWM duty cycle is set either at a value that achieves maximum power, or to meet the charging voltage required by the battery (see battery management conditions below). When it is required to reduce the charging rate so as to limit the battery voltage, the PWM duty is reduced, thereby increasing the panel voltage above the maximum power point and reducing the current accordingly.

    The Fast PWM mode of the Arduino is used to generate this PWM. The PWM period of 12 microseconds is 192 clock cycles at 16 MHz. The PWM period is divided into a Panel Connect phase followed by an Earth Connect phase. The length of the Panel Connect phase is controlled by PWM Duty.

    When maximising power, the power level is measured approximately every 0.5 milliseconds and is compared to the previous power level measurement. The PWM duty cycle is changed up or down by 1 CPU clock cycle after every measurement. After the first measurement, the PWM duty cycle is increased. On subsequent measurements, if the power level is increased or is the same as the previous measurement, the PWM duty cycle is changed in the same direction as in the previous cycle. If the power level is decreased from the previous cycle, the PWM duty cycle is changed to go in the opposite direction to that in the previous cycle.

    When tracking the allowable battery voltage, the battery voltage is measured approximately every 0.5 milliseconds and is compared to the target value. If the new value is within +0.1 volts of the target value, the PWM duty is left unchanged. If the new value is...

    Read more »

  • Overview of Version-3.1

    Open Green Energy08/30/2015 at 14:50 7 comments

    After lot testing we observed that MOSFET ( Q3 ) in ver-3.0 design is burning repeatedly.We tried to modify the existing software but not find any satisfactory result.

    The other problem was that MOSFET Q1 ( in V-3.0) conduct even when there is no solar input.

    To solve the above problems and enhance the power handling capability we are modifying both the hardware and software.This is named as Version-3.1 Charge Controller.This version have 3 options.

    1. 5 Amp version :

    T94-26 toroid, 48 turns of AWG20 wire to give 135 uH (it takes almost 1.5m of wire)

    Q1, Q2 and Q3 all pairs of IRFZ44N MOSFETs (6 in all).

    C1 will be 3 * 220 uF low ESR capacitors in parallel,

    C2 will be a single 220 uF low ESR capacitor

    Single ACS712 on the panel side as per version 3.0

    2. 8 Amp version :

    T106-26 toroid wound with 23 turns of a compound wire made from 3 strands of AWG20 wire twisted together to give 47 uH (this takes about 3.1 m of wire).

    Q2 will be a pair of FDP150N10A MOSFETs in parallel.

    C1 will be 5 * 220 uF low ESR capacitors in parallel,
    C2 will be a single 220 uF low ESR capacitor

    Two ACS712, one on the panel side as per version 3.0 and one in series with the battery.

    3 10 Amp version :

    T130-26 toroid wound with 23 turns of a compound wire made from 4 strands of AWG18 wire twisted together to give 41 uH (this takes about 4.5 m of wire).

    Q2 will be a pair of FDP150N10A MOSFETs in parallel.
    C1 will be 6 * 220 uF low ESR capacitors in parallel,
    C2 will be 2 * 220 uF low ESR capacitors in parallel.

    Three ACS712, one on the panel side as per version 3.0, one in series with the battery and one in series with the load.

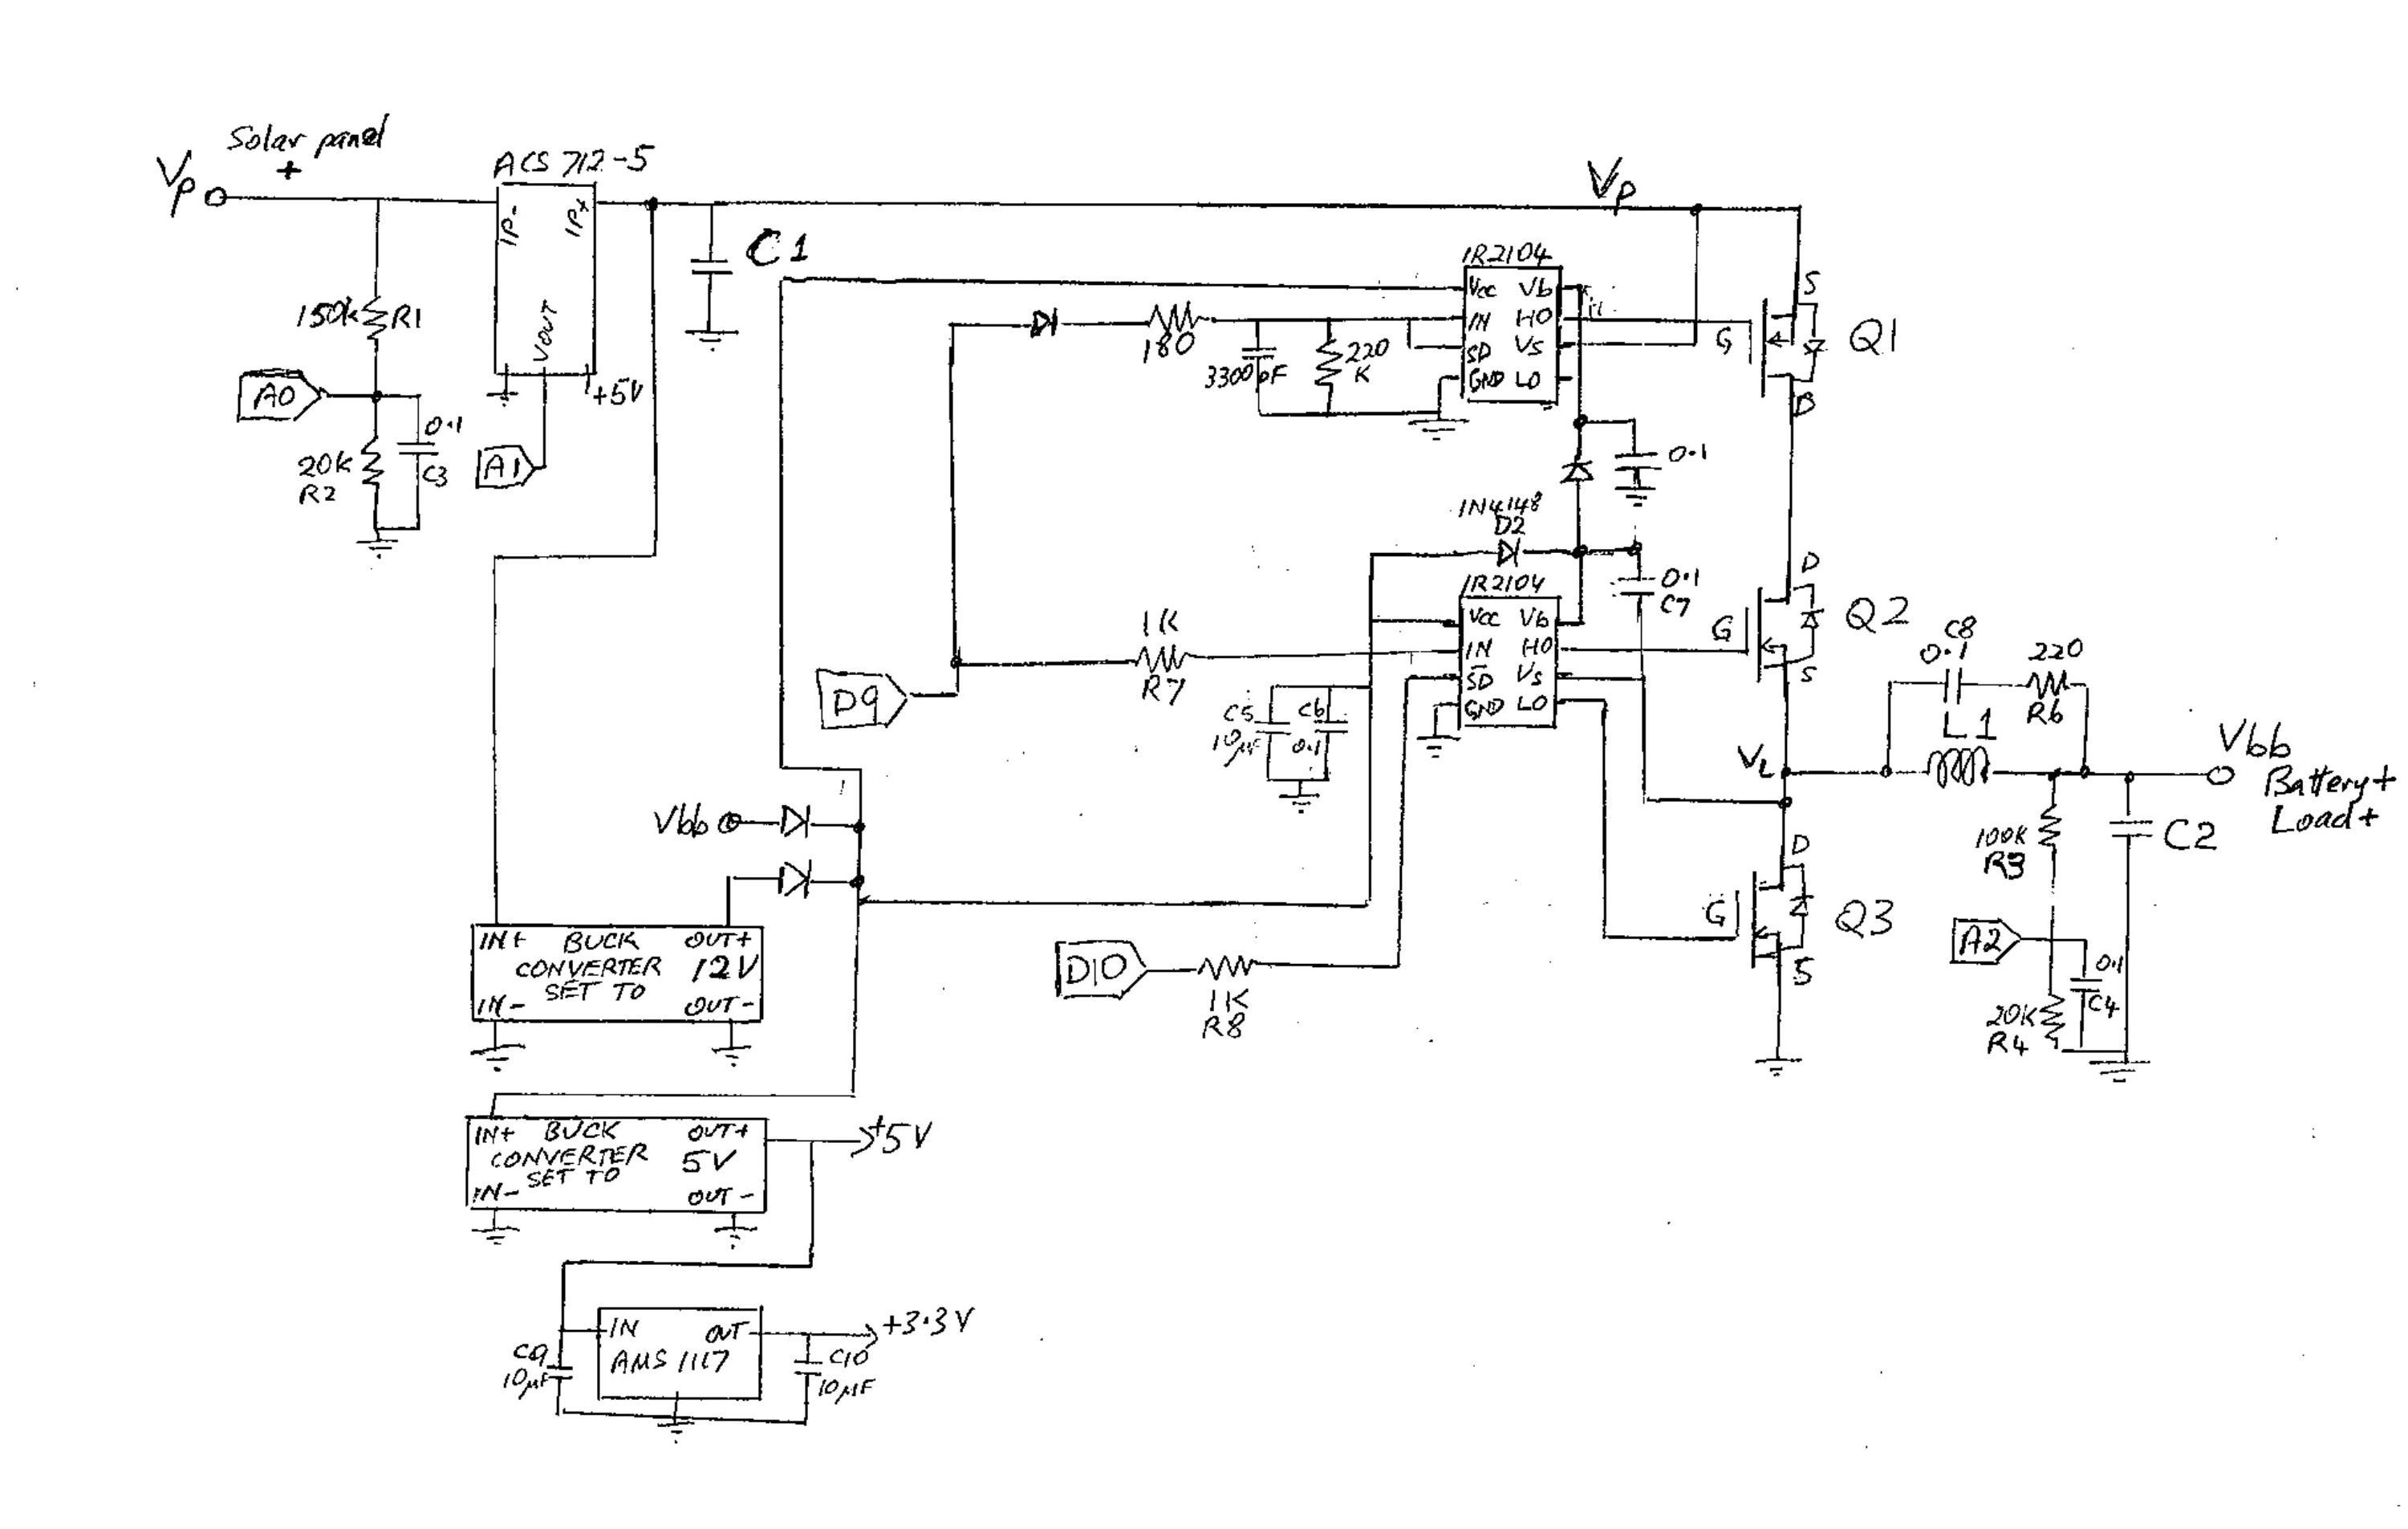
    Here is a rough sketch for V-3.1

    You can download the complete schematic from here

    We are working on new PCB for V-3.1 Here is the sample of one

    The drive circuitry (common to all 3 versions) will use 3 separate IR2104 driver chips, one for each of Q1, Q2 and Q3. We drive the Q1 and Q2 drivers from pin D9 and HO1 and HO2, and drive Q3 from pin D10 and LO3.

    In driver chips 1 and 2, pins IN and SD are driven in parallel by Arduino output pin D9. In the case of driver 1 (for Q1) there is a low pass RC filter in series, with a time constant of about 1 ms. Driver 2 is driven directly (as in the current circuit, but probably with a slightly higher series resistor to allow more current for the Q1 driver and its RC filter).

    In driver chip 3, IN is driven by D9 and SD is driven by D10.

    The purpose of using separate drivers for Q2 and Q3 is to enable us to switch Q3 OFF to operate in Asynchronous mode at low current levels when the controller will be in DCM (Discontinuous Current Mode). There may be a better way to do this but in the short time we have available this is a simple option and easy and reliable to implement.

    All 3 versions should have LCD displays, WiFi, LED indicators (maybe with a more fancy coding scheme to separately indicate DCM and CCM).

    All 3 versions should be able to cope with either 18 V or 30 V panels, and use algorithms that stop them burning out if the panel can produce more current than the rating allows. This can all be done auto-detect.

    All the components exposed to panel voltage need to be rated for at least 40 V (in particular C1 and our buck converter to generate 12V for the drivers and to power the control electronics.

  • Overview of MPPT algorithm modelling

    Open Green Energy08/26/2015 at 07:29 0 comments

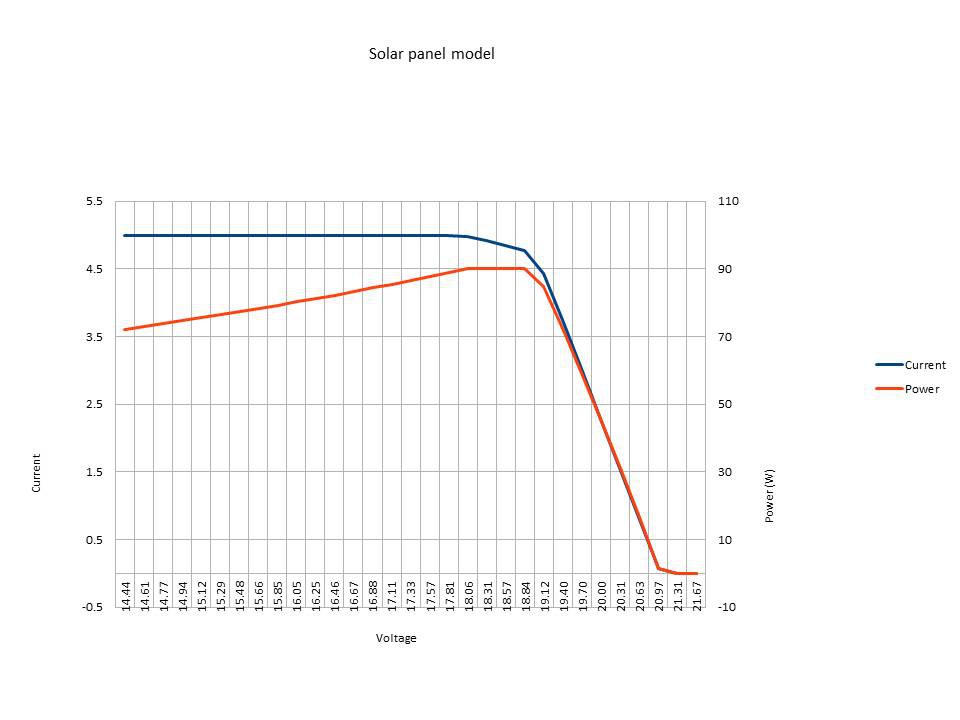
    Panel model consists of a simple step-wise linear model of a solar panel.See the above figure.

    1. Constant Current : up to 18 volts

    2. Constant Power : between 18 and 19 volts

    3. Power decline linearly to zero : between 19 and 21 volts

    4. Zero Current and Power : above 21 volts

    In the spread sheet attached below there are 5 MPPT models.Here is some brief description on each.

    1. MPPT model 1 implements the logic flow chart as shown in above figure

    2. MPPT model 2 implements the same logic flow chart with a declining panel power.

    3. MPPT model 3 implements the algorithm used in the Arduino software. It is easy to adjust it for fixed or variable panel power and for various starting conditions.

    4. MPPT model 4 is the same as Model 3 except that it used “<=” rather than “<” for the power test.

    5. MPPT model 5 is the functionally the same as Model 4. It uses three branches on the power comparison to the previous iteration, which has the same result as the comparison in Model 4. The main difference is it uses the equivalent of the integer arithmetic used in the Arduino for calculation of PWM duty cycles.

    Models 1 to 3 all exhibit similar characteristics, as follows:

    They all converge satisfactorily when given a high PWM starting point (above the MPP) or a lower one with a derived voltage less than the maximum cut-off voltage of the panel (in the model, 21 V).

    None of them work at all when given a low PWM starting point with a derived voltage above the maximum cut-off voltage.

    The MPPT model 4 corrects this last problem by constantly increasing the PWM (ie decreasing the derived voltage) in the case of equal (ie zero) power. It will always find the MPP of the panel model no matter what starting point is used. It may take more steps than provided in the examples, but it always converges.

    MPPT model 4 also sweeps the total maximum power area.

    To clarify this: Models 1 to 3 when converged all oscillate at the top or bottom edge of the MPP area, depending on whether they approached it from above or below.

    It seems desirable for the tracking to sweep the whole MPP area, irrespective of which direction the approach came. This would better deal with cases where the power curve had local flat spots for some reason. Model 4 does this.

    MPPT Model 5 provides a tool for exploring the effect of integer arithmetic on the PWM calculations and the resultant voltages and currents.

    Integer arithmetic in PWM calculations :


    At the hardware level, the current software uses Timer1 to produce the PWM signal at a 20 microsecond period.20 microseconds is 320 clock cycles of the Arduino clock (which is 16 MHz, ie with a period of 62.5 ns).Because the Timer1 library uses the “Phase and Frequency correct” PWM mode of Timer1, which counts both up and down, the setting of the TOP level (which defines the 20 microsecond period) is 160. The PWM duty can be changed in units of 2 clock cycles, or 125 ns.The integer calculation of PWM runs like this (using the current software):The MPPT code uses a 16 bit integer variable “pwm” to manage the duty cycle. It runs from 0 to 100 to represent 0 to 100% duty cycle, and can be stepped up or down by 1 unit (ie 1%) in each pass through the MPPT algorithm. The Timer1 library accepts PWM duty parameter in the form of a 16 bit integer variable which runs between 0 and 1023 to represent duty cycle as a fraction of 1024.

    I will use an example to illustrate how the calculations run.

    As an example we start with a desired PWM duty cycle of 70%, that is the integer “pwm” has a value of 70. To convert this to an integer between 0 and 1023 to pass to the Timer1 library, the software multiplies pwm (70) by 1023 (giving 71610.The MPPT code then divides this number by 100 giving 716, which it passes to the Timer1 library. Note that 716 / 1024 = 0.6992188..., which is a small amount less than the 70% we started out with.

    Note that even if we had multiplied the original 70 by 1024, it would...

    Read more »

  • Quarter Final Video

    Open Green Energy08/15/2015 at 19:43 0 comments

  • Keith Presentation

    Open Green Energy08/13/2015 at 12:30 0 comments

    keith.hungerford ( team member ) from Australia, who is one of the major contributor to this project.He has experimented a lot on this project.After my request he made this nice video explaining the efficiency,losses at various load,how DCM will take care at low load condition, about the MPPT v4 controller and writing of a new Arduino TimerOne library to handle our requirement.

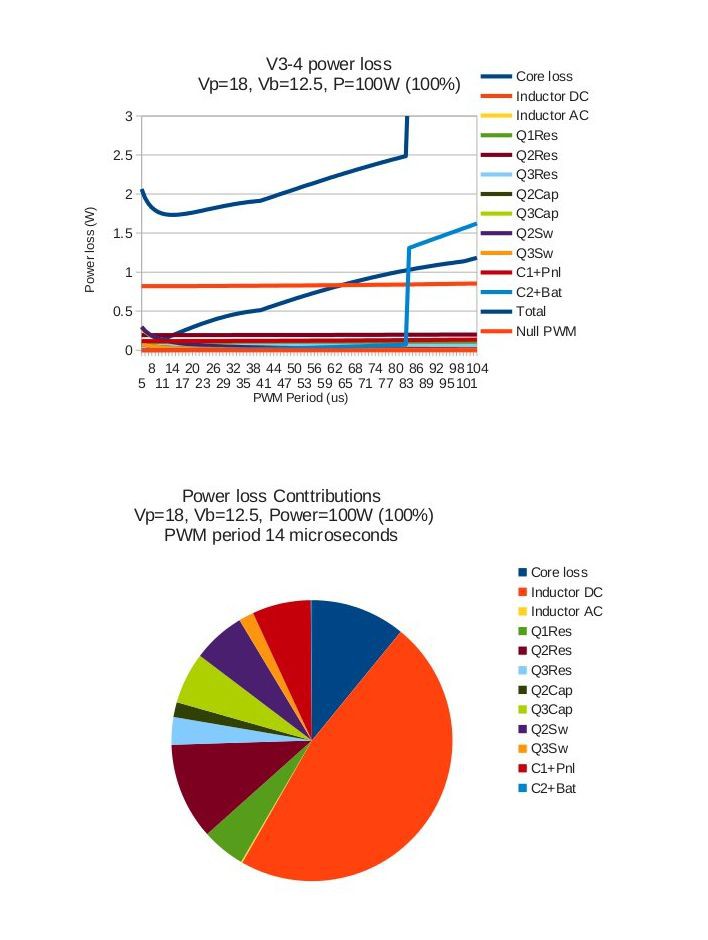
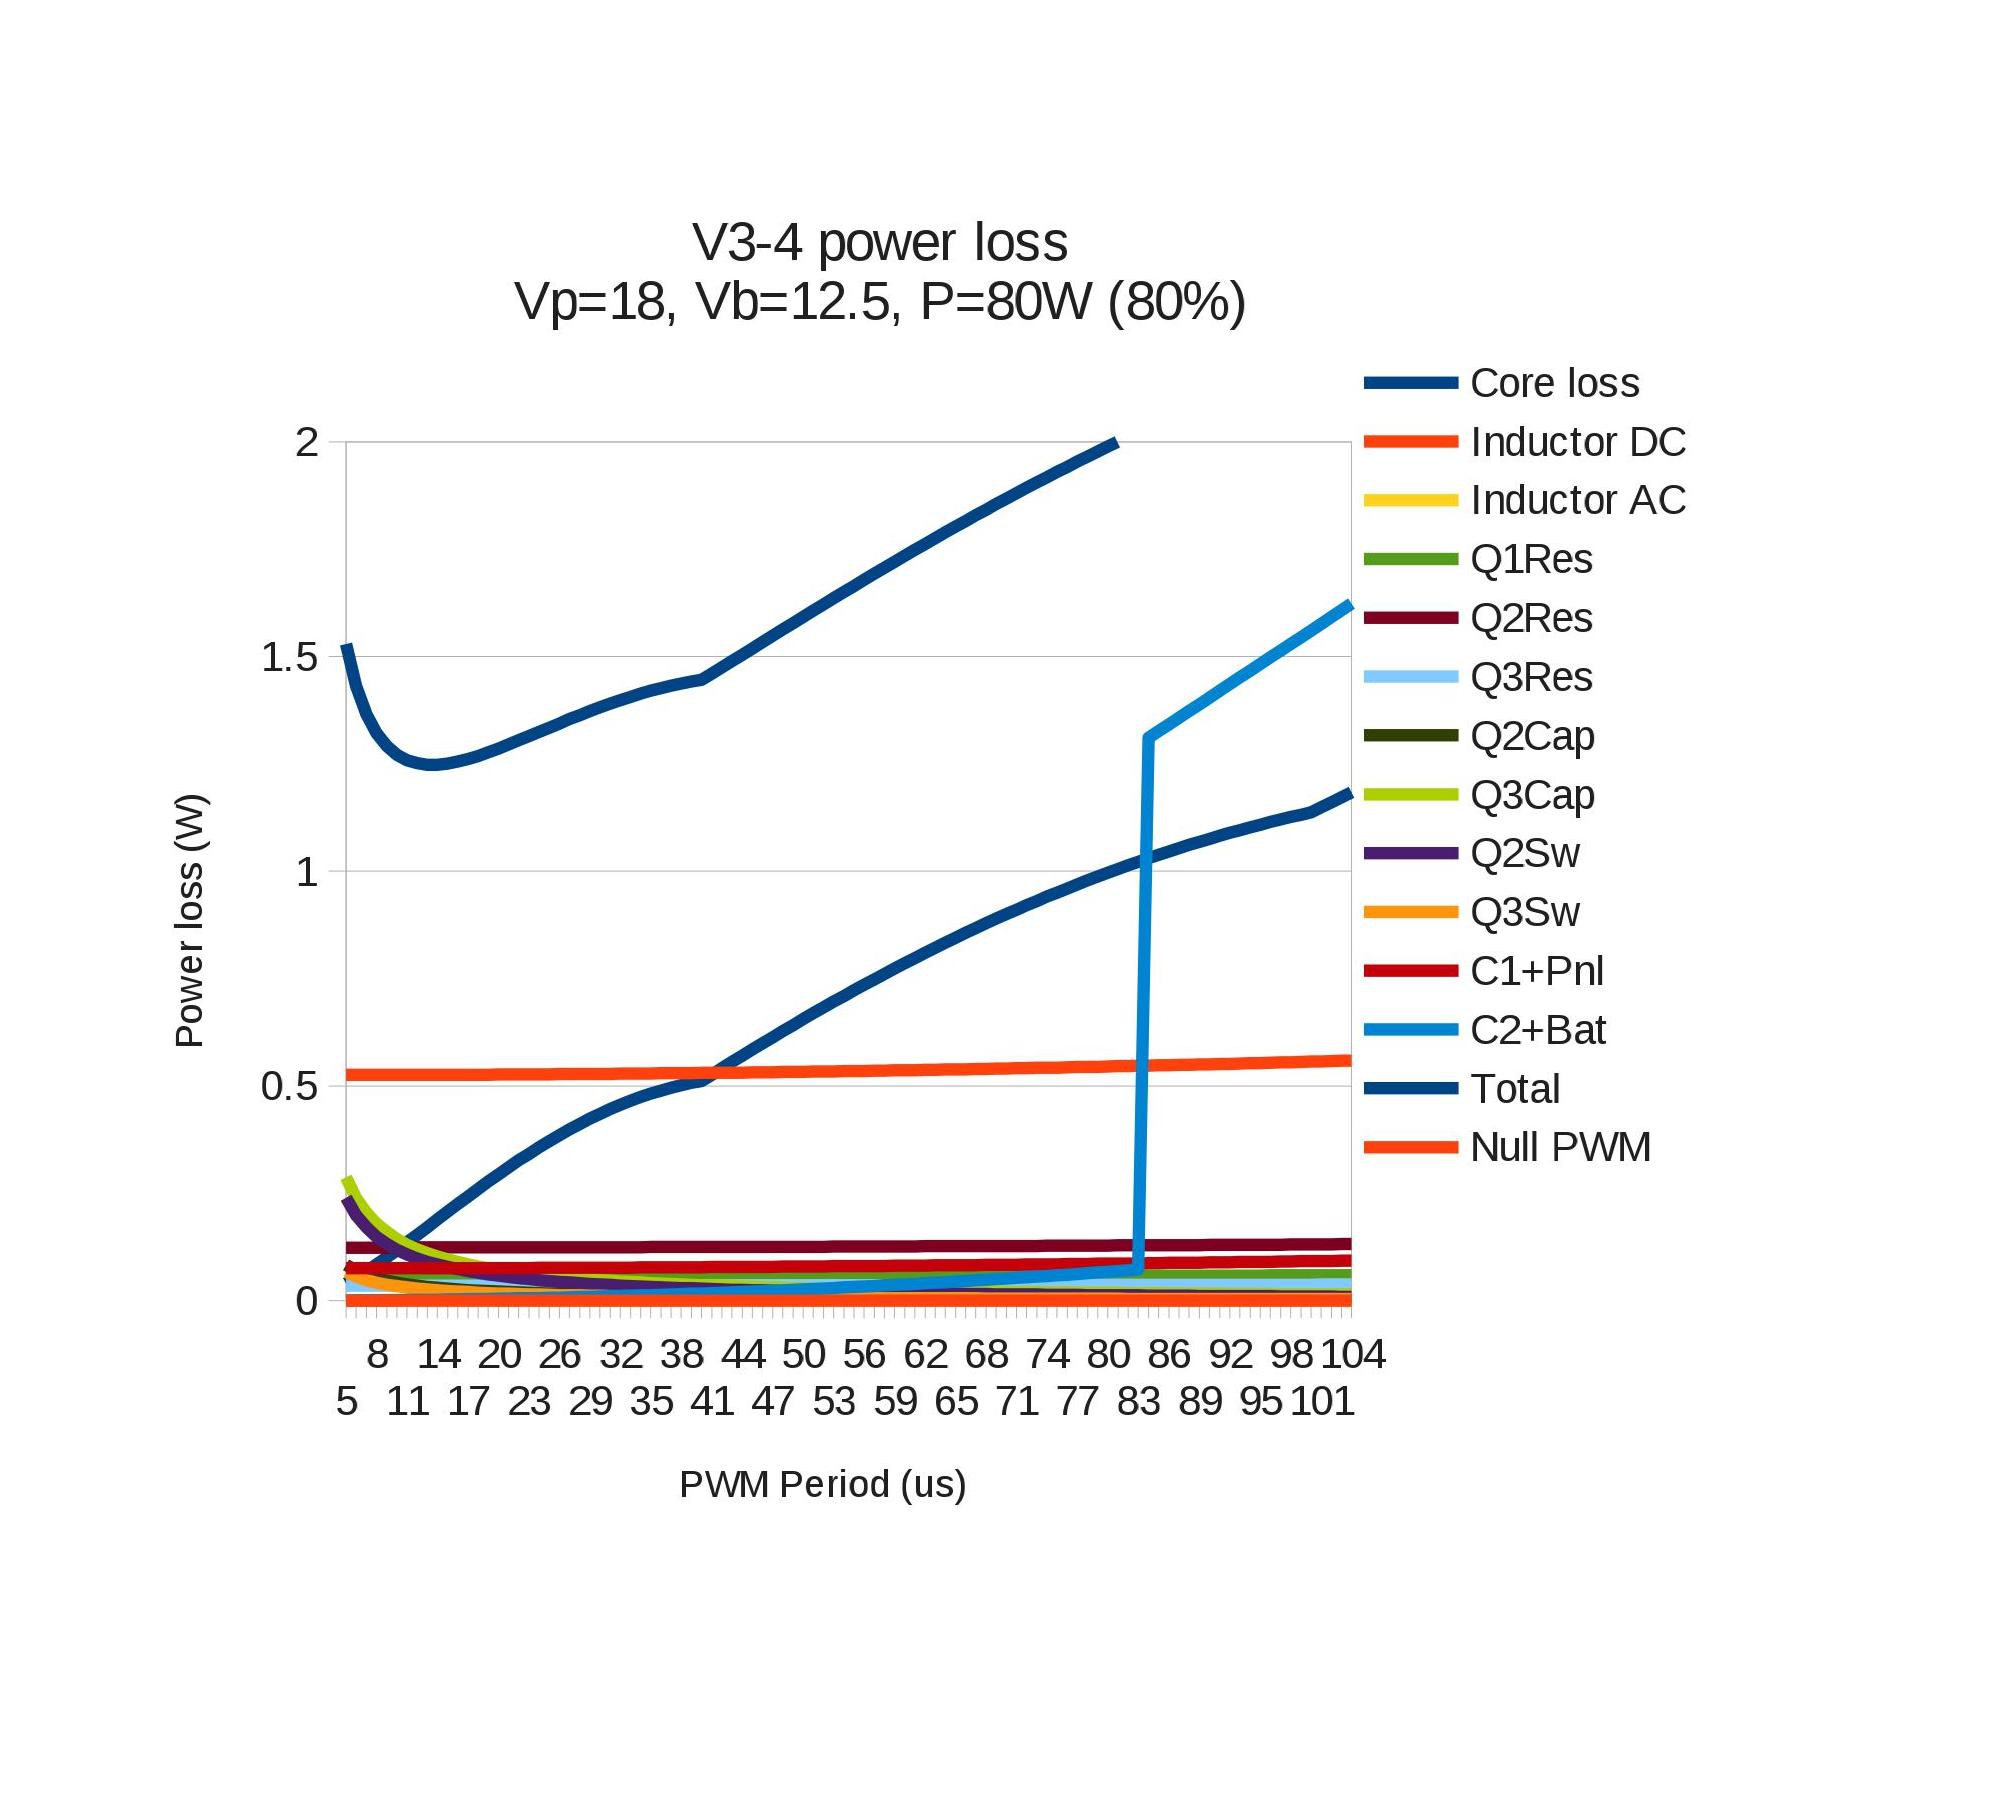
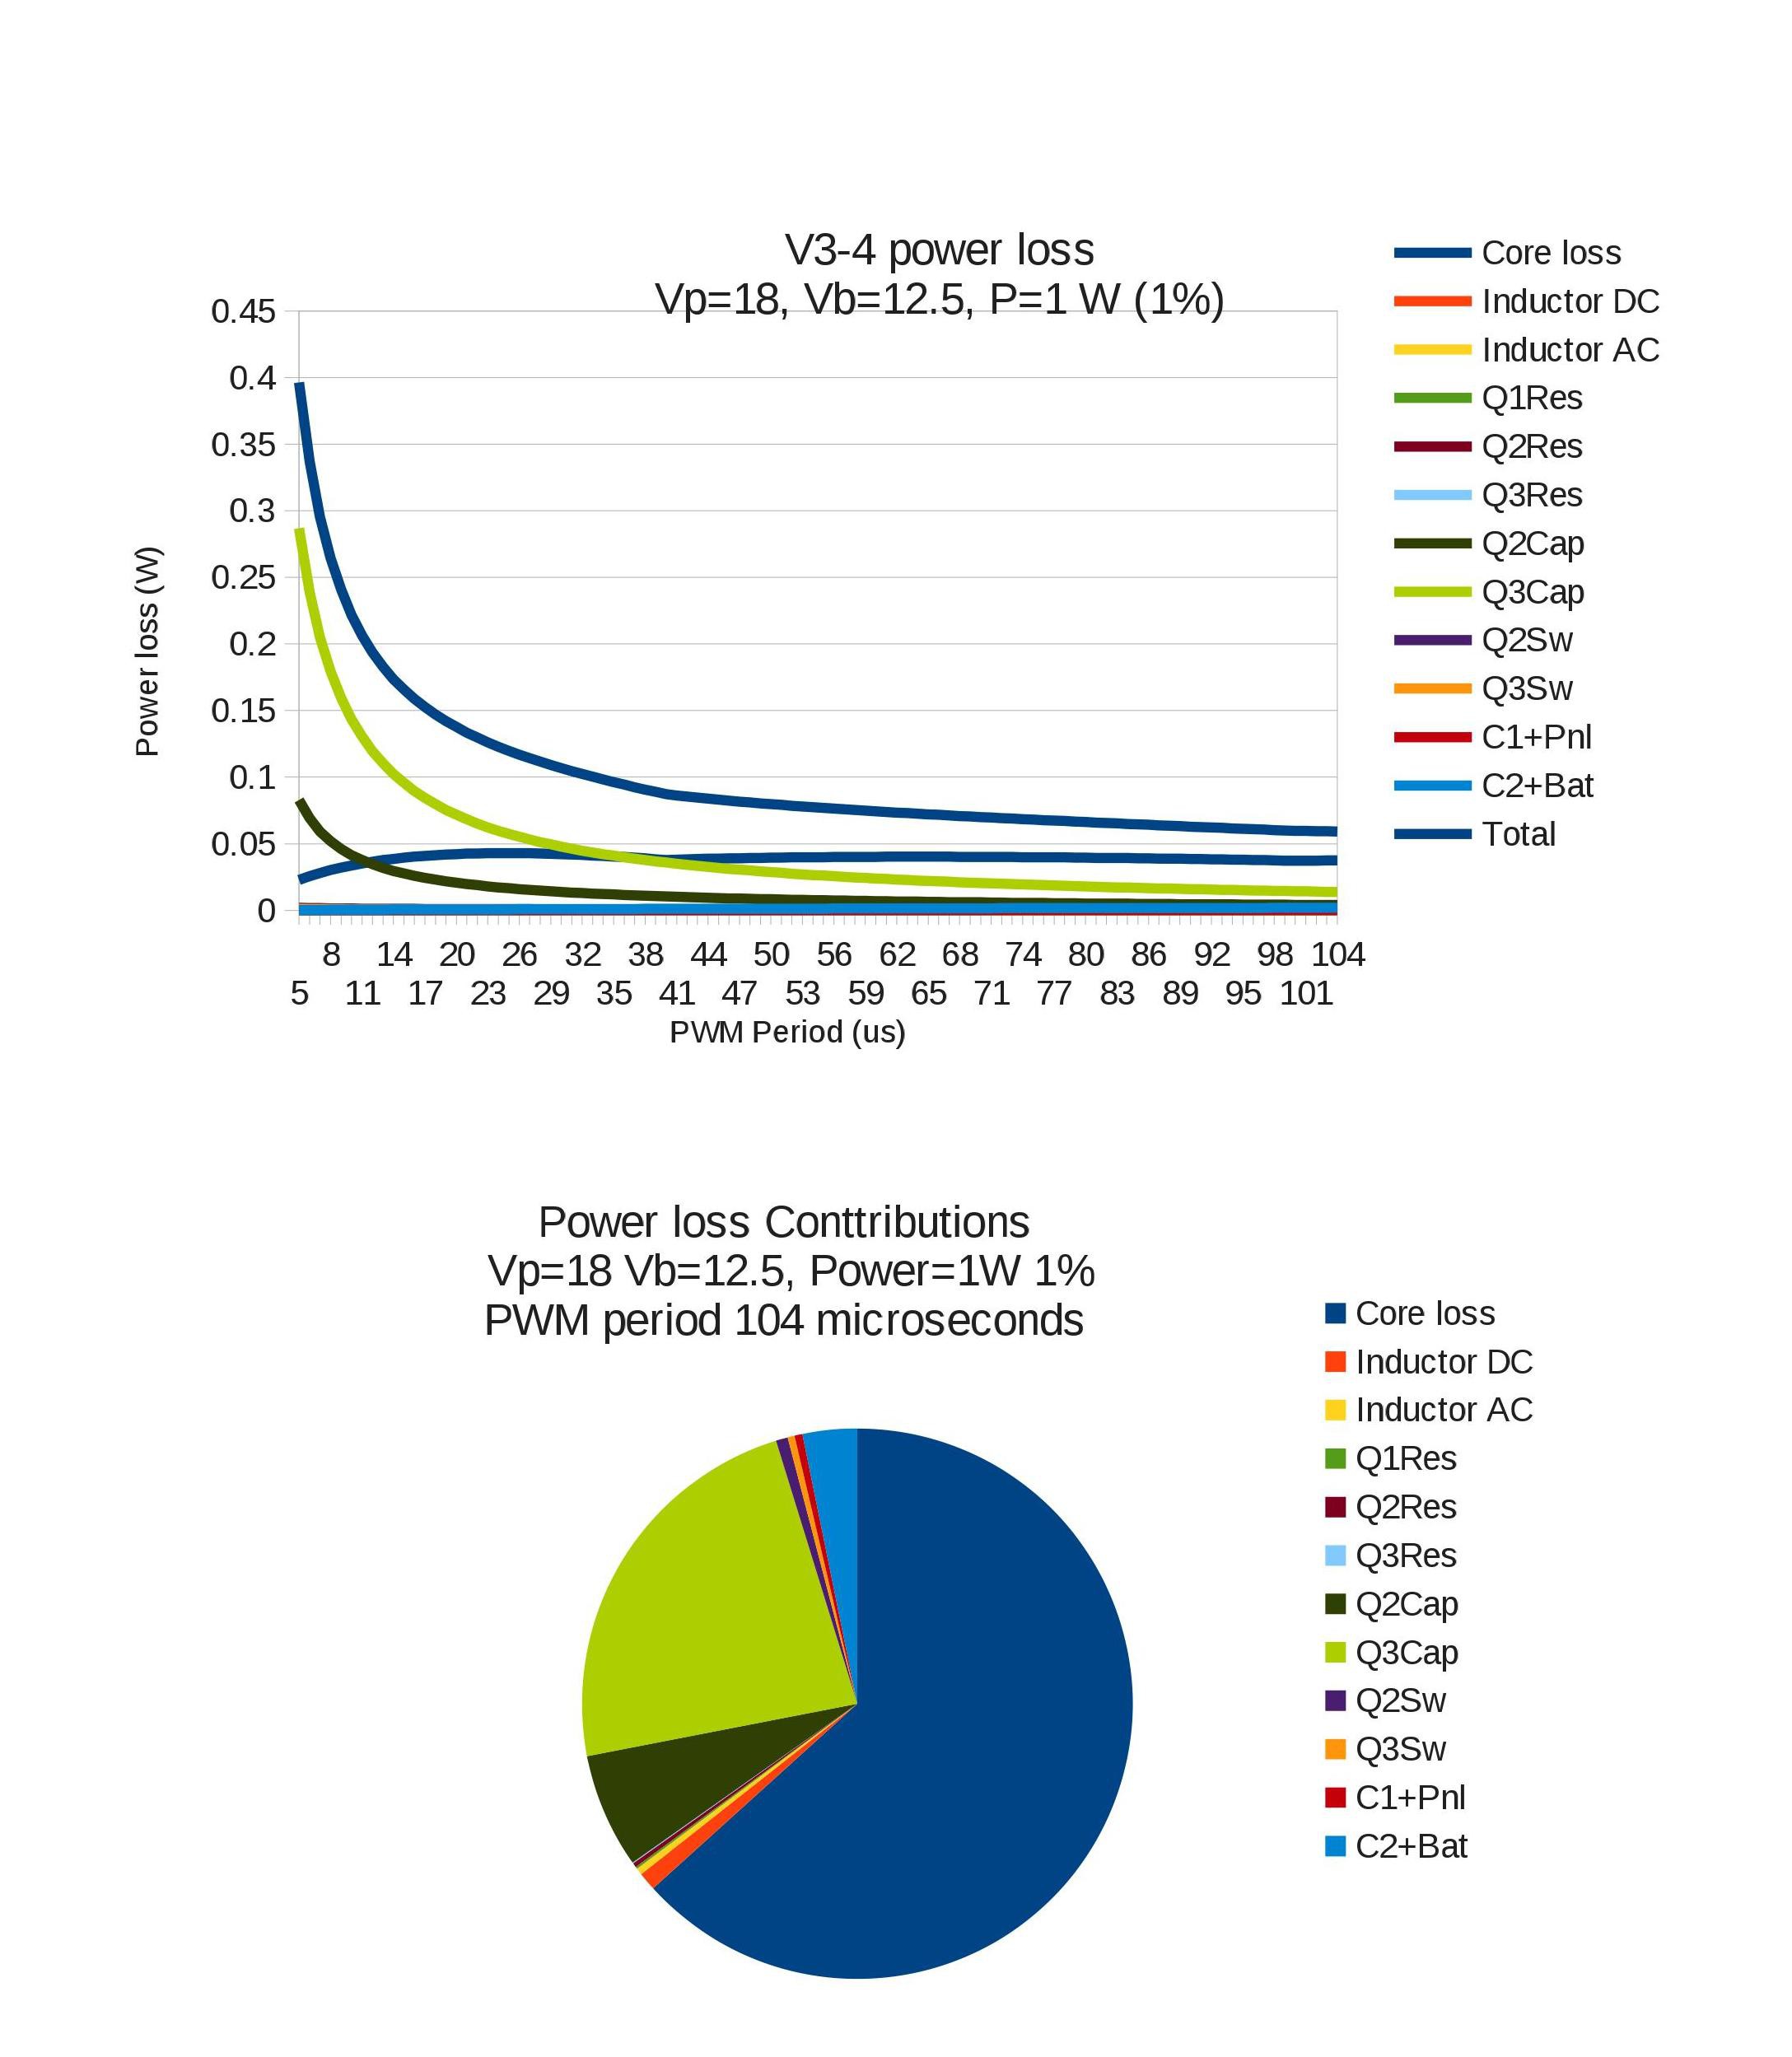
    These are the loss analysis curves at different load condition.

    At 100 Watt :

    At 80 Watt :

    At 1 watt :


    In the 100% ( 100W ) graph, the optimum PWM period is 14 microseconds, at which period the decrease in the core loss is balanced by the increase in the switching and capacitive drive loss. When Keith checked, he found that the capacitive drive losses are so nearly equal to the switching losses that the curves fully overlap and you cannot see the capacitive loss curve. It is more clear at 80% ( 80W ) load where both curves are visible.

    As the load decreases, the resistive losses decrease and the relative influence of these period-dependent losses increases, but the pattern remains the same. In the MOSFETS, the importance of the switching losses decreases with decreasing load, since there is less current flowing and therefore a reduced amount of charge to be absorbed, even though the voltage excursion is unchanged. The capacitive losses come to dominate. Because the switching losses are less, the optimum PWM period decreases with decreasing load. At 10% load it is down to 11 microseconds.

    However the difference between the total loss at 11 microseconds and 14 microseconds is only 5% of the loss, so a single PWM period of around 14 microseconds is quite efficient SO LONG AS THE CONTROLLER IS IN CCM.

    Somewhere below the 10 % load point, but above the 5% load point, the controller goes into DCM. That is, there is not enough current flowing out of the panel to make the current in the inductor always flow in the same direction.

    His design assumption in this spreadsheet is that the controller algorithms explicitly support DCM. That is, they switch off Q3 at the time that the current would start flowing "backwards". So now, in DCM, the controller has 3 phases within the PWM period. There is the phase when current flows from the panel via Q2 through the inductor, and increases. there is the phase when current flows from Earth via Q3 through the inductor, and decrease. Then there is the Null phase when no current flows through the inductor.

    This Null phase is a good one as far as losses in the inductor and MOSFETs are concerned - there is no current and so no loss. However C1 is receiving all of the current from the panels, and C2 is delivering all of the current to the battery or load. This creates extra voltage ripple at the panels, and at the battery/load.

    So long as the voltage ripple at the panels and battery/load is within reasonable limits, in DCM it is better to have a much longer PWM period. Hence the appearance of very long PWM periods at very low load levels. The length of the PWM period is mainly limited by the voltage ripple tolerable at the battery, and the reduction in efficiency of the panel caused by the ripple there.

  • Finished the Soldering

    Open Green Energy08/12/2015 at 03:22 3 comments

    Purchased all the missing components and started to solder it on PCB.After few hours of work, everything is soldered.I have tested auxiliary power circuitry,everything works fine.The next task is to test the charging circuit.I will update it soon.

  • Soldering the Components on PCB

    Open Green Energy08/12/2015 at 03:09 0 comments

    Today I soldered most of the components on the new PCB.But few components are not available in my stock.So I can't solder them.I will solder the remaining components after buying it from my local shop.

    The following components are missing

    1.Fuse Holder

    2.TVS Diodes

    3.5.1V Zener Diode

    4.USB Port

  • Improvement in LCD Display Function

    Open Green Energy08/11/2015 at 15:57 1 comment

    The LCD display functionality is improved.The above video shows the simulation to test the modified software.

    These are the improvements

    1. Dynamic battery status in battery icon.Earlier it was always showing about half full .Now it changes according to the battery SOC, just like in cell phone.

    2. Removing the long if else statement for displaying the battery SOC. Now used a math function to do the job.

    3. Adding a spinner icon to show the charger is running.It stops when program stuck up.

    Code before Modification :

    void lcd_display()
    {
      back_light_pin_State = digitalRead(BACK_LIGHT_PIN);
      if (back_light_pin_State == HIGH)
      {
        time = millis();                        // If any of the buttons are pressed, save the time in millis to "time"
      }
     
     lcd.setCursor(0, 0);
     lcd.print("SOL");
     lcd.setCursor(4, 0);
     lcd.write(1);
     lcd.setCursor(0, 1);
     lcd.print(sol_volts);
     lcd.print("V"); 
     lcd.setCursor(0, 2);
     lcd.print(sol_amps);
     lcd.print("A");  
     lcd.setCursor(0, 3);
     lcd.print(sol_watts);
     lcd.print("W "); 
     lcd.setCursor(8, 0);
     lcd.print("BAT");
     lcd.setCursor(12, 0);
     lcd.write(2);
     lcd.setCursor(8, 1);
     lcd.print(bat_volts);
     lcd.setCursor(8,2);
     
     if (charger_state == on) 
     lcd.print("on");
     else if (charger_state == off)
     lcd.print("off");
     else if (charger_state == bulk)
     lcd.print("bulk");
     else if (charger_state == bat_float)
     lcd.print("float");
    
     
     //-----------------------------------------------------------
     //--------------------Battery State Of Charge ---------------
     //-----------------------------------------------------------
     lcd.setCursor(8,3);
     if ( bat_volts >= 12.7)
     lcd.print( "100%");
     else if (bat_volts >= 12.5 && bat_volts < 12.7)
     lcd.print( "90%");
     else if (bat_volts >= 12.42 && bat_volts < 12.5)
     lcd.print( "80%");
     else if (bat_volts >= 12.32 && bat_volts < 12.42)
     lcd.print( "70%");
     else if (bat_volts >= 12.2 && bat_volts < 12.32)
     lcd.print( "60%");
     else if (bat_volts >= 12.06 && bat_volts < 12.2)
     lcd.print( "50%");
     else if (bat_volts >= 11.90 && bat_volts < 12.06)
     lcd.print( "40%");
     else if (bat_volts >= 11.75 && bat_volts < 11.90)
     lcd.print( "30%");
     else if (bat_volts >= 11.58 && bat_volts < 11.75)
     lcd.print( "20%");
     else if (bat_volts >= 11.31 && bat_volts < 11.58)
     lcd.print( "10%");
     else if (bat_volts < 11.3)
     lcd.print( "0%");
     
    //--------------------------------------------------------------------- 
    //------------------Duty Cycle-----------------------------------------
    //---------------------------------------------------------------------
     lcd.setCursor(15,0);
     lcd.print("PWM");
     lcd.setCursor(19,0);
     lcd.write(3);
     lcd.setCursor(15,1);
     lcd.print(pwm); 
     lcd.print("%");
     //----------------------------------------------------------------------
     //------------------------Load Status-----------------------------------
     //----------------------------------------------------------------------
     lcd.setCursor(15,2);
     lcd.print("Load");
     lcd.setCursor(15,3);
     if (load_status == 1)
     {
        lcd.print("On");
     }
     else
     {
       lcd.print("Off");
     }
     backLight_timer();                      // call the backlight timer function in every loop 
    }
    
    void backLight_timer(){
      if((millis() - time) <= 15000) // if it's been less than the 15 secs, turn the backlight on
          lcd.backlight();           // finish with backlight on  
      else 
          lcd.noBacklight();         // if it's been more than 15 secs, turn the backlight off
    }

    Code After Modification :

    void lcd_display()
    {
      static bool current_backlight_state = -1;
      back_light_pin_State = digitalRead(BACK_LIGHT_PIN);
      if (current_backlight_state != back_light_pin_State) {
        current_backlight_state = back_light_pin_State;
        if (back_light_pin_State == HIGH)
          lcd.backlight();// finish with backlight on
        else
          lcd.noBacklight();
      }
    
      if (back_light_pin_State == HIGH)
      {
        time = millis();                        // If any of the buttons are pressed, save the time in millis to "time"
      }
     
     lcd.setCursor(0, 1);
     lcd.print(sol_volts);
     lcd.print("V ");
     lcd.setCursor(0, 2);
     lcd.print(sol_amps);
     lcd.print("A");  
     lcd.setCursor(0, 3);
     lcd.print(sol_watts);
     lcd.print(...
    Read more »

  • PCB Arrived

    Open Green Energy08/11/2015 at 15:27 1 comment

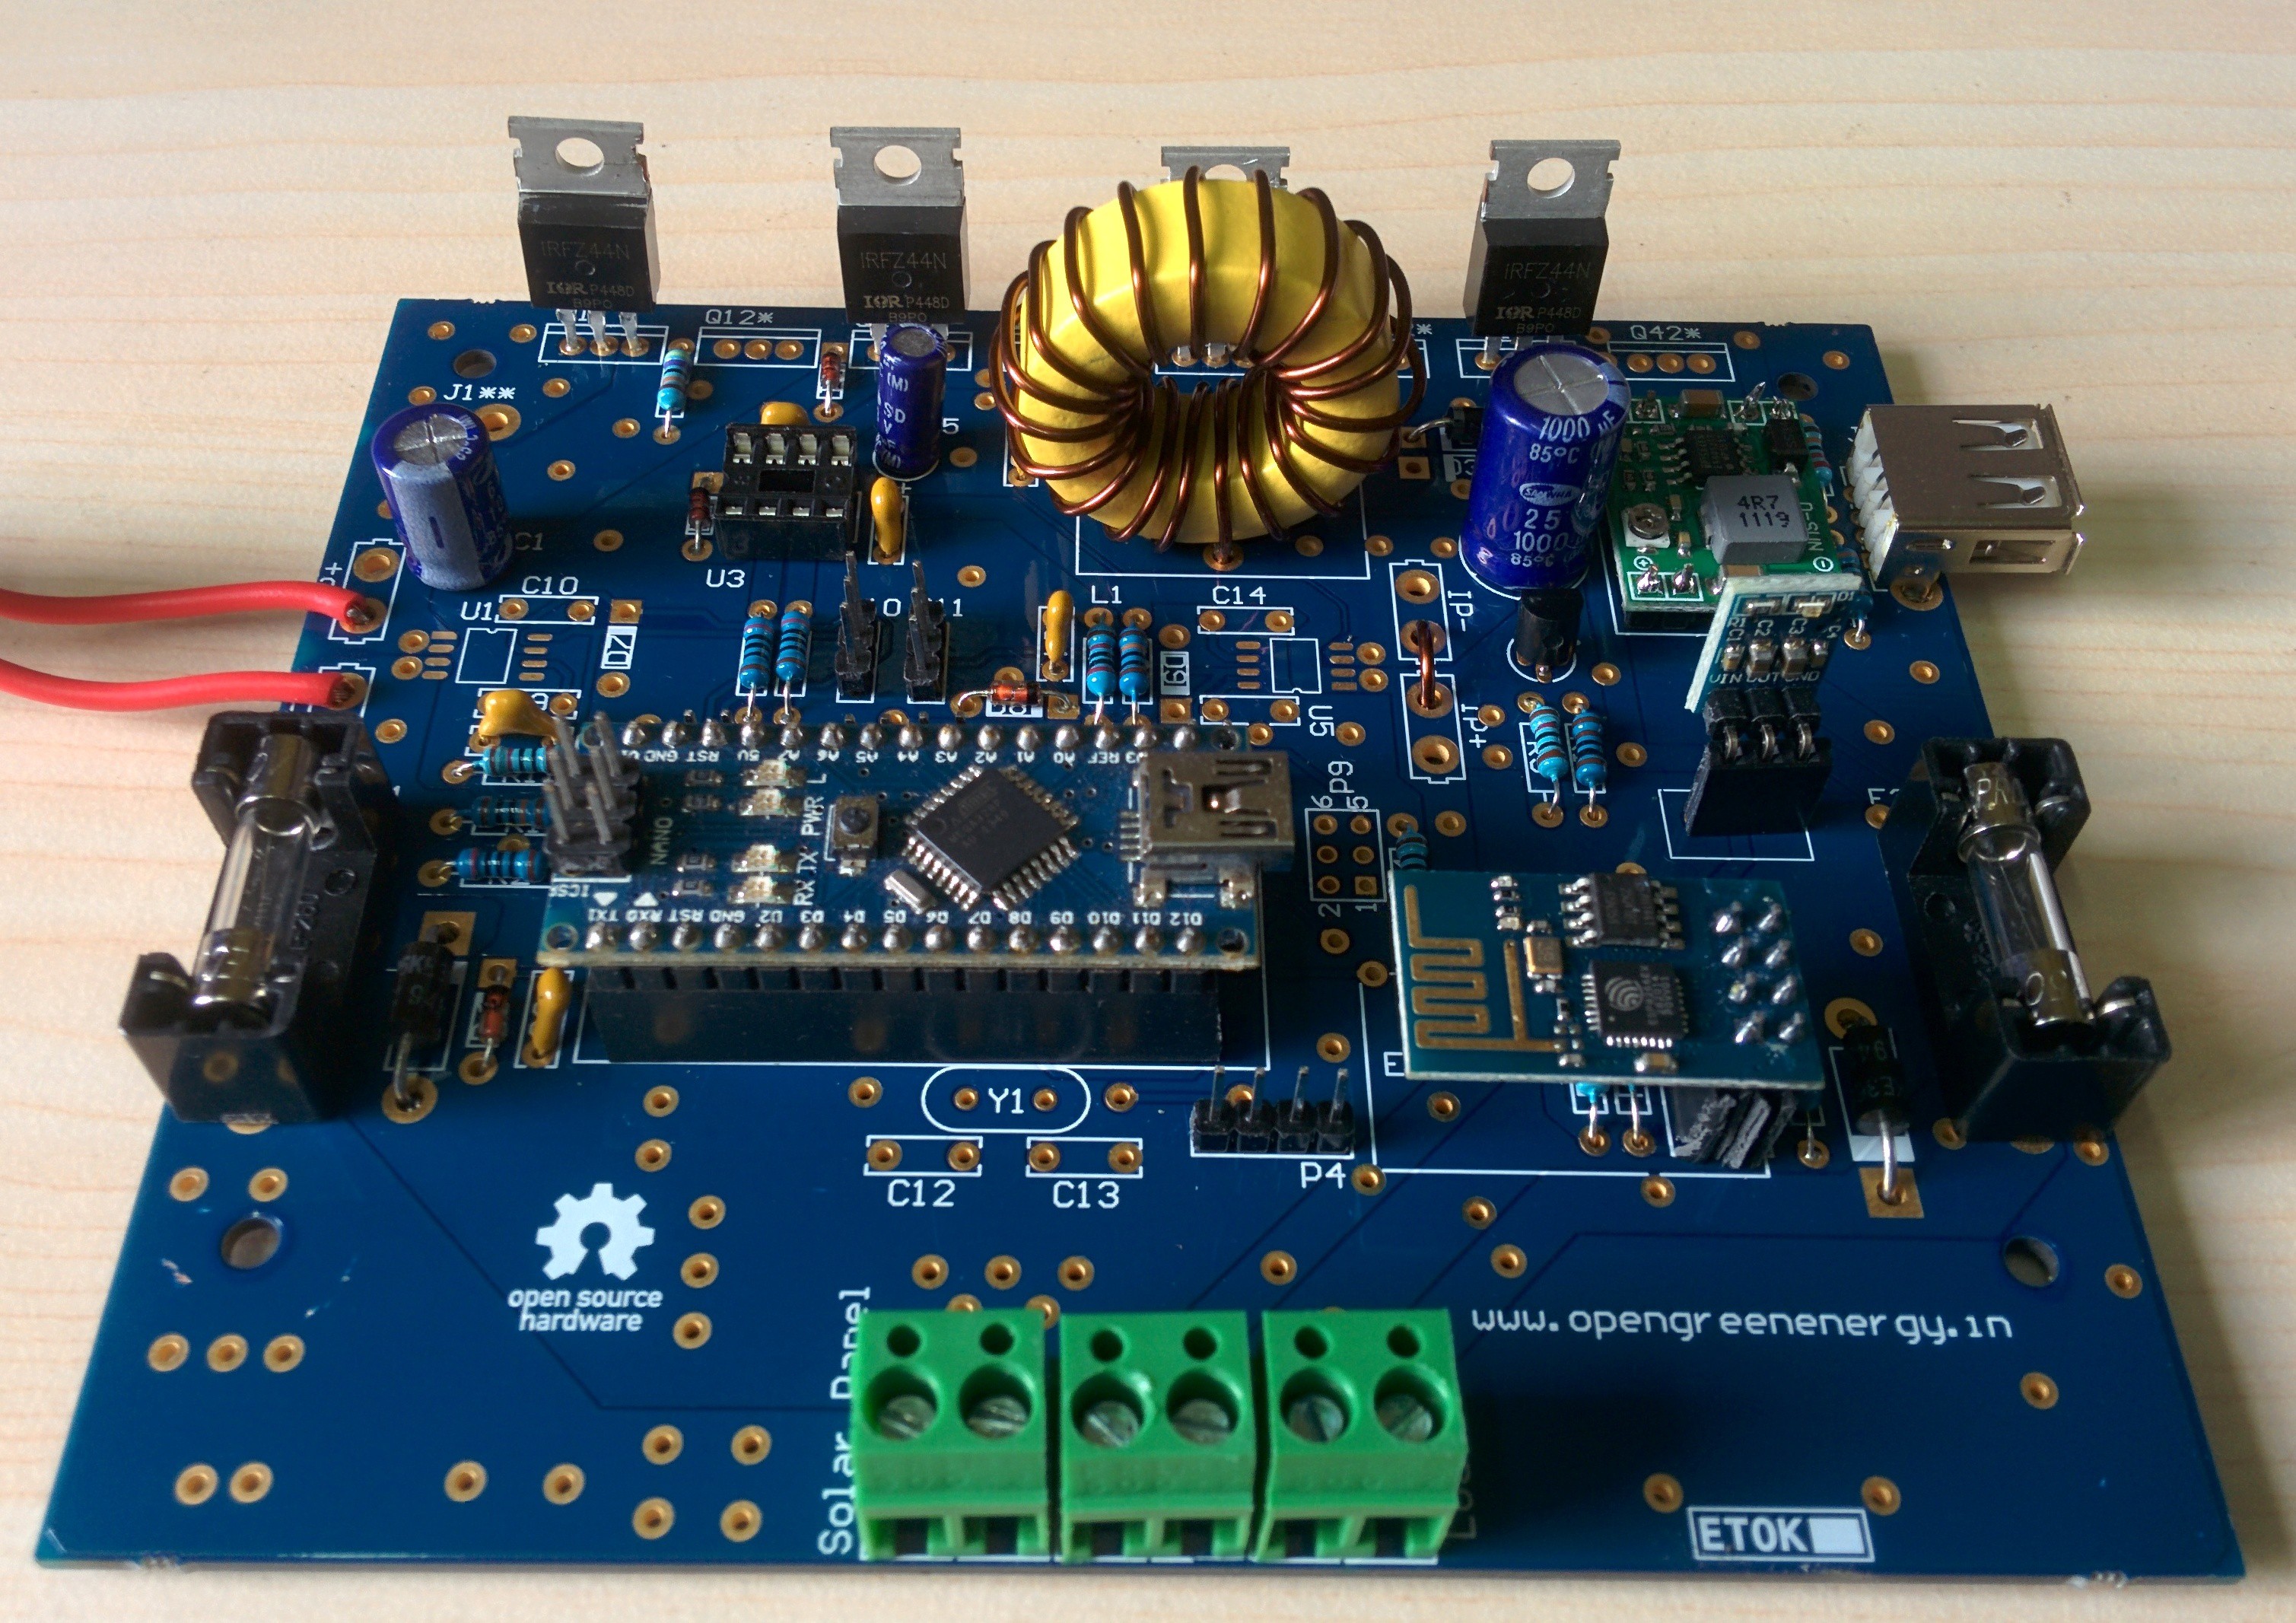
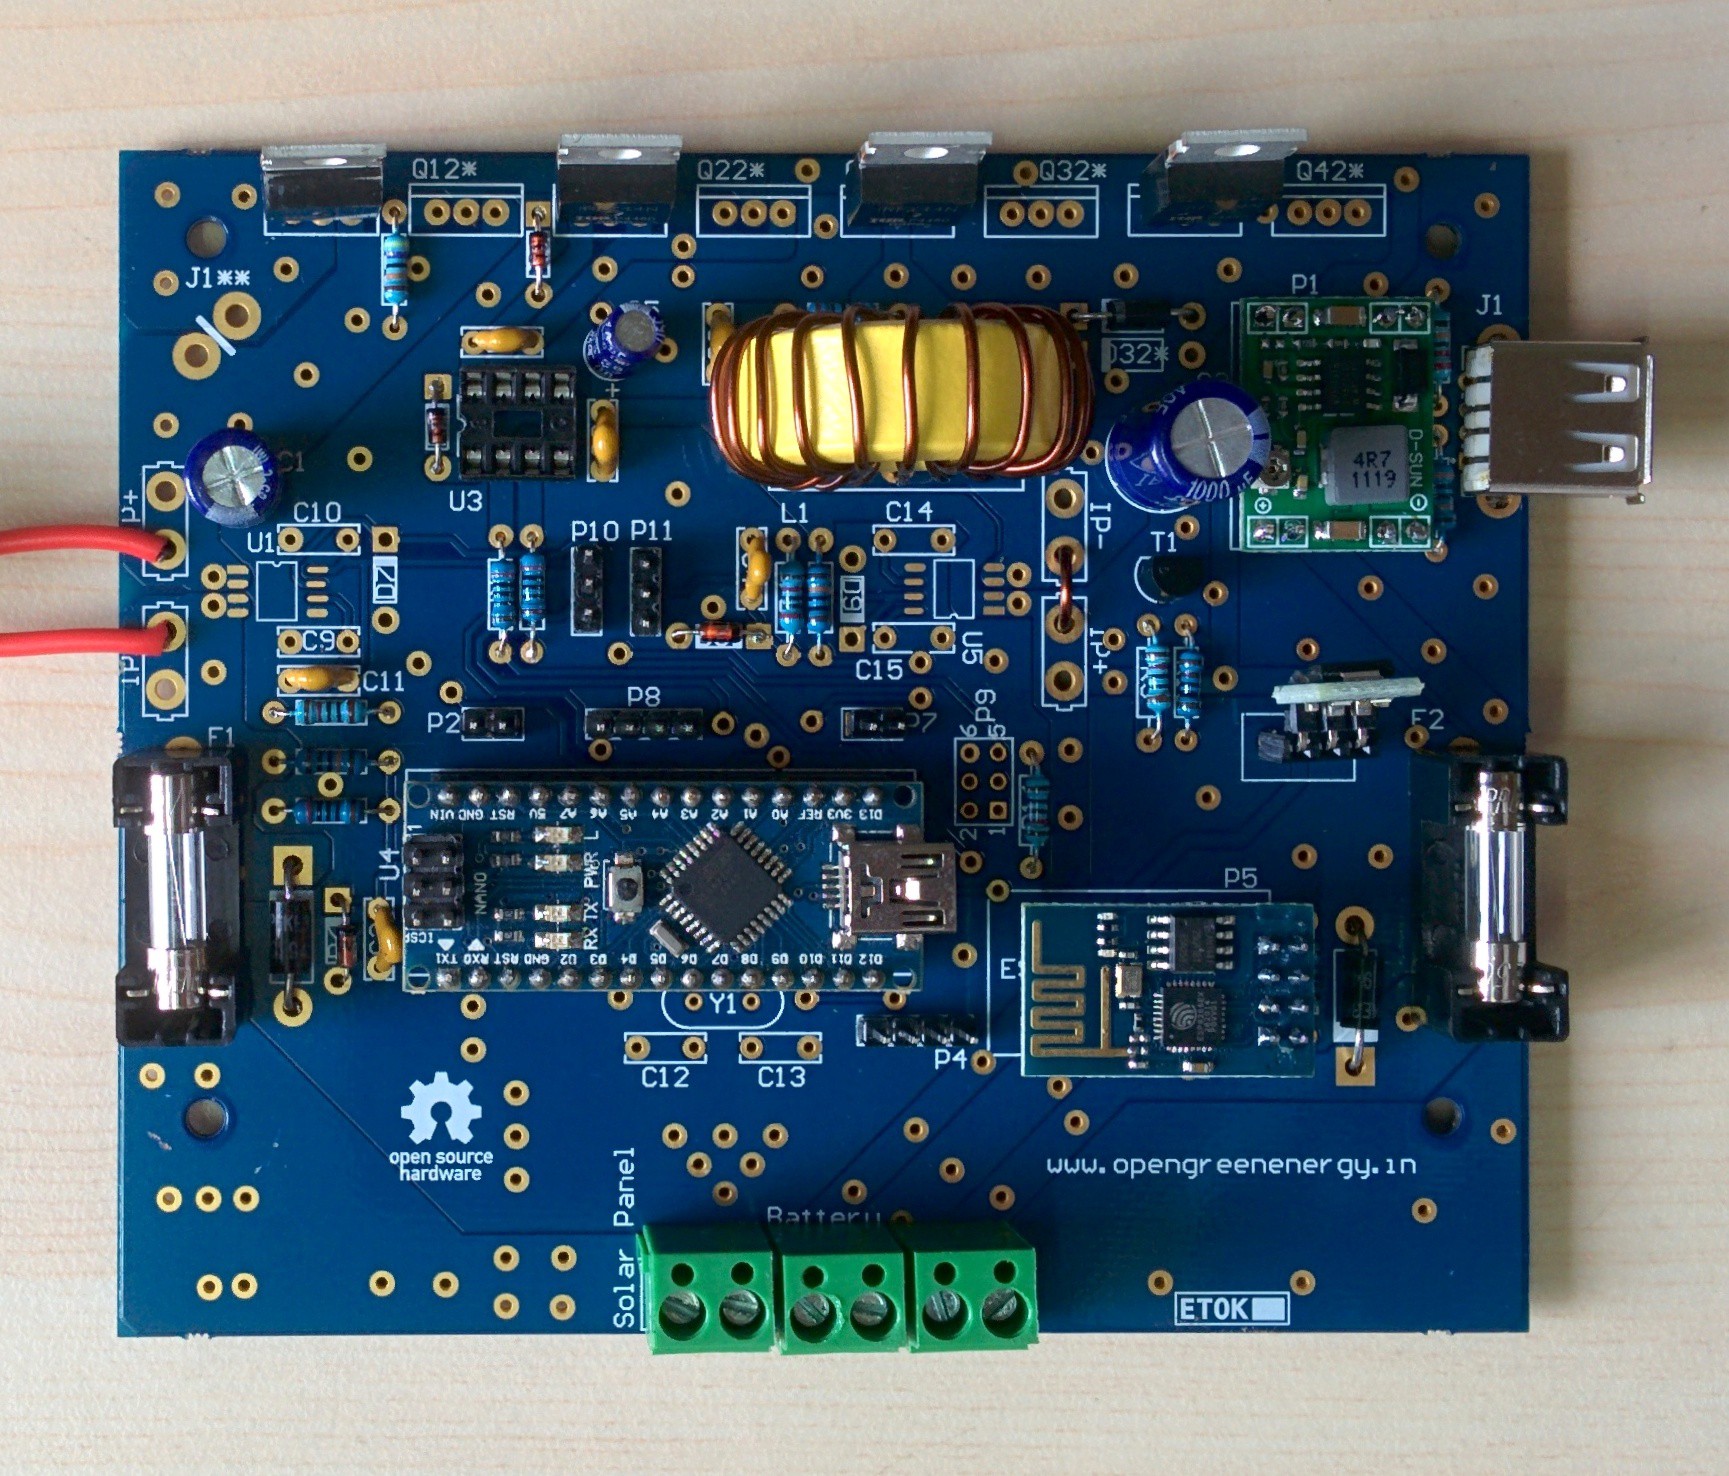
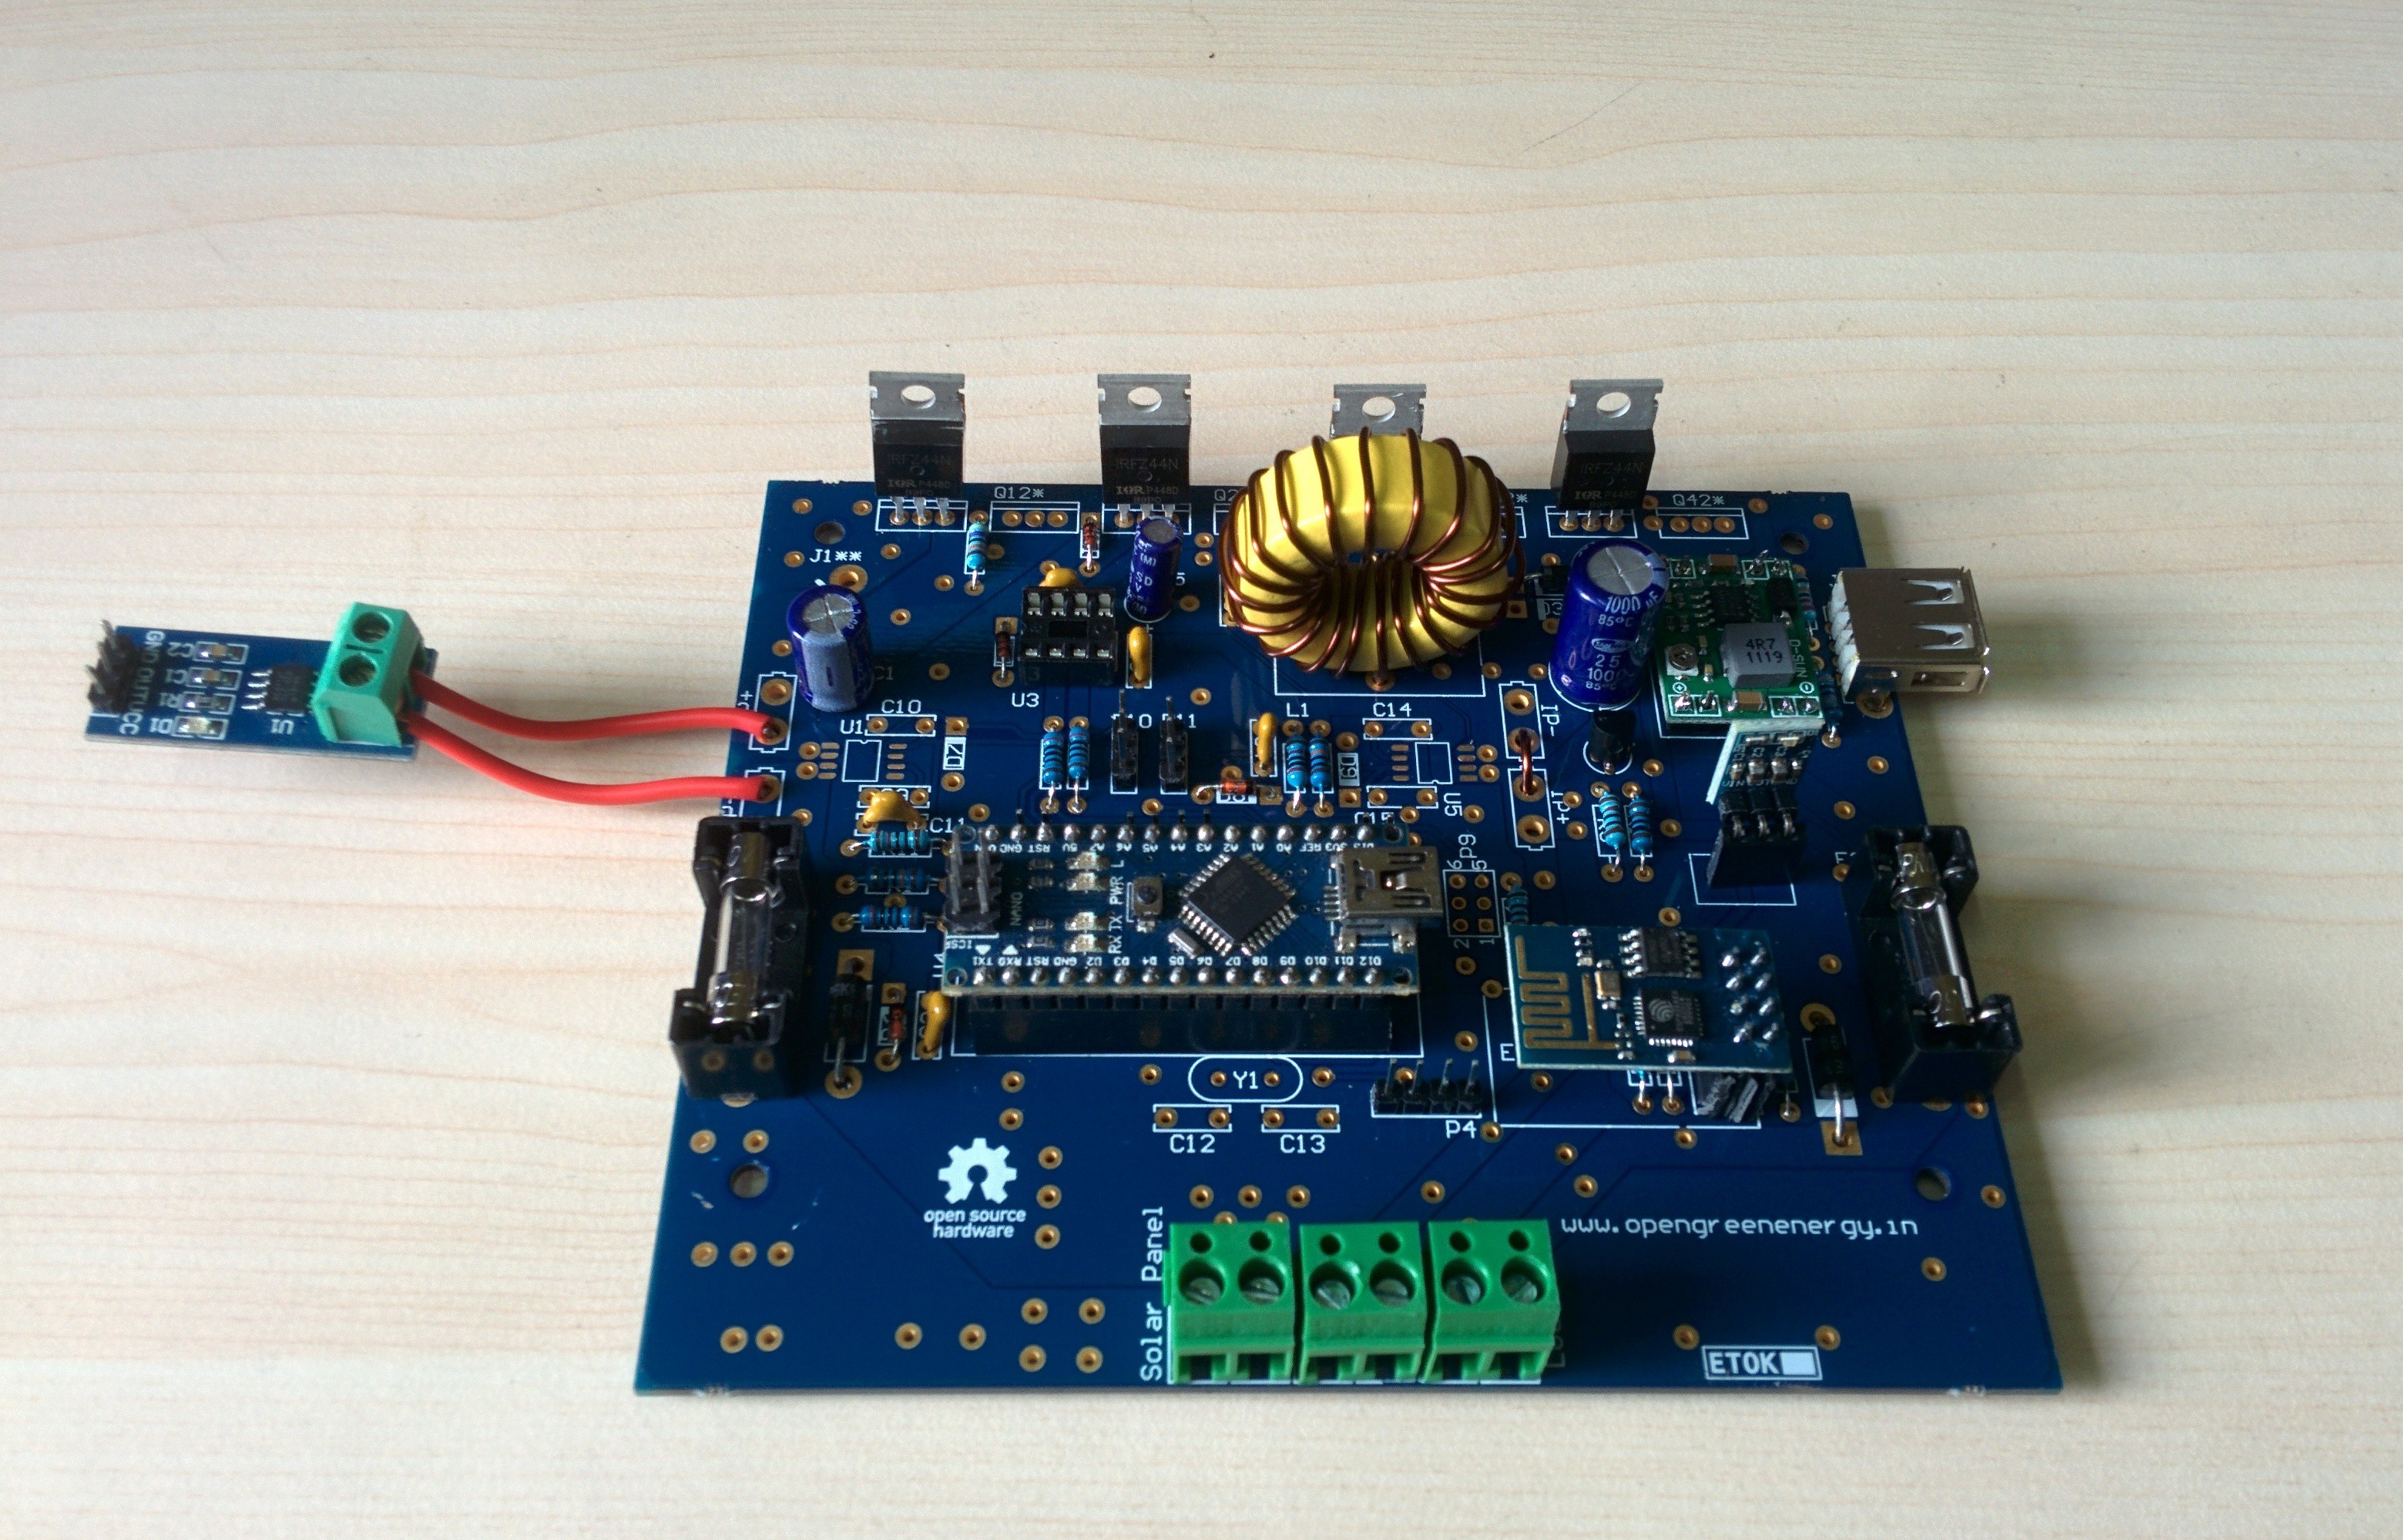
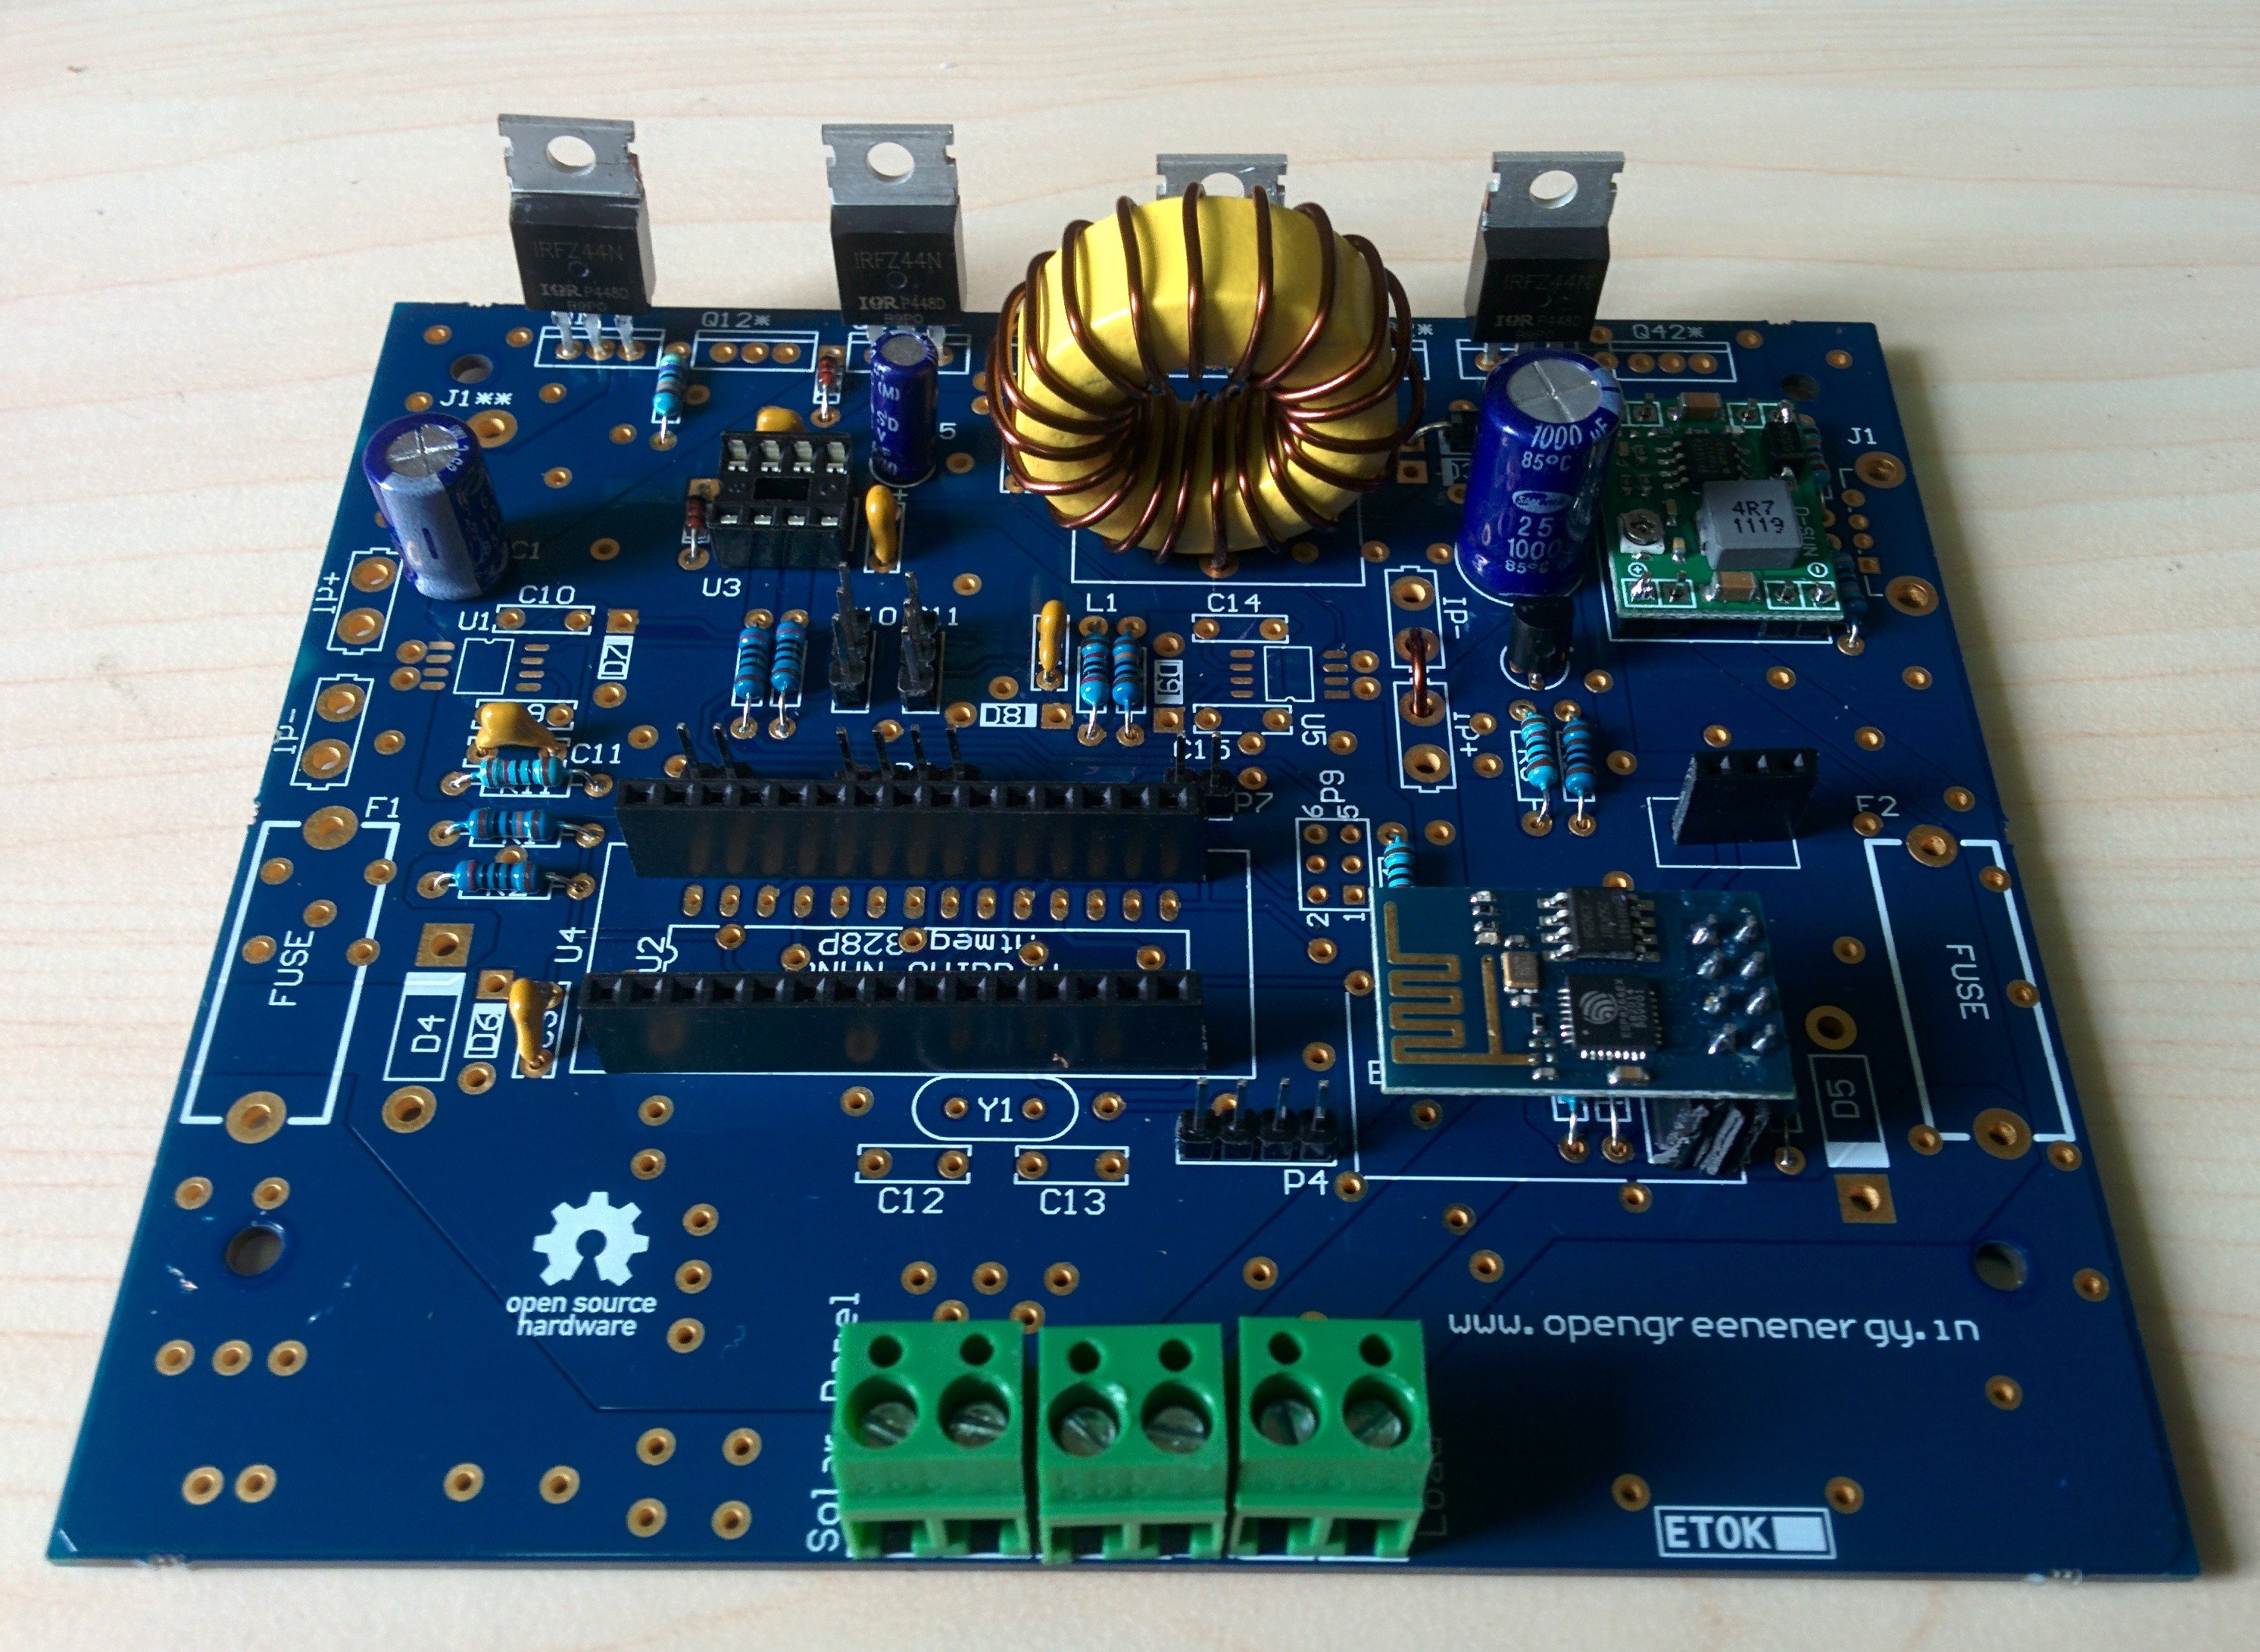
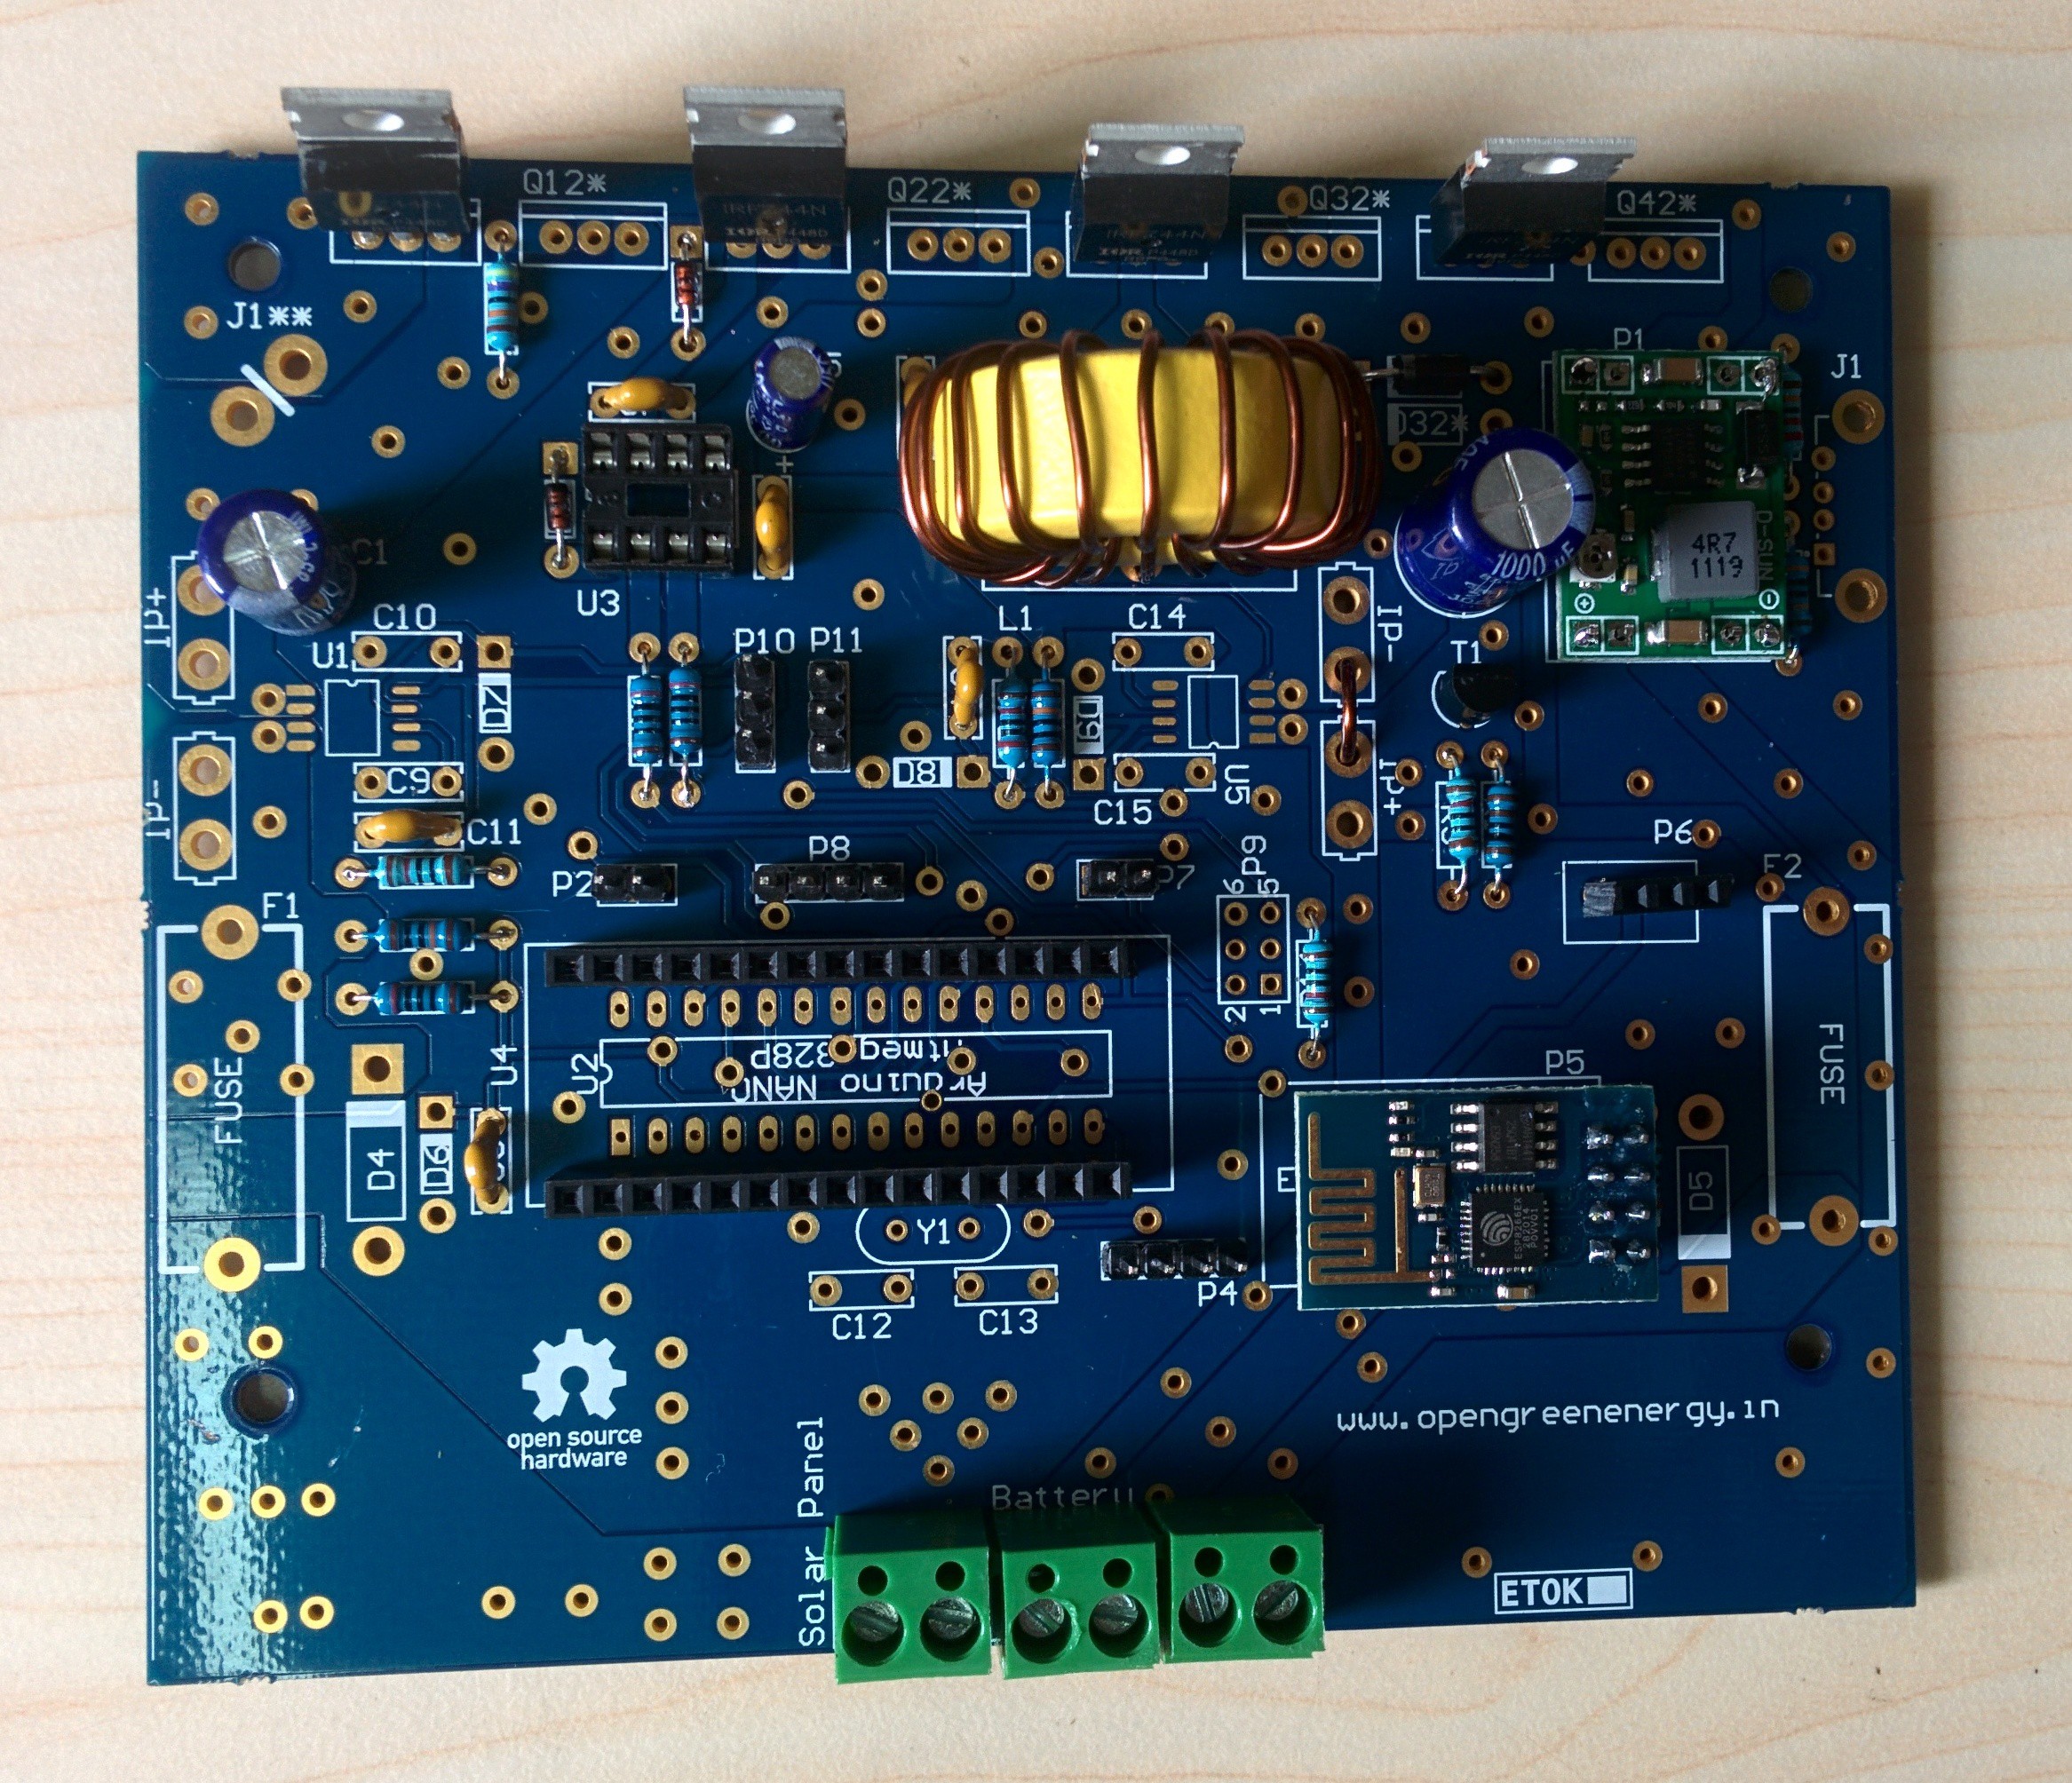
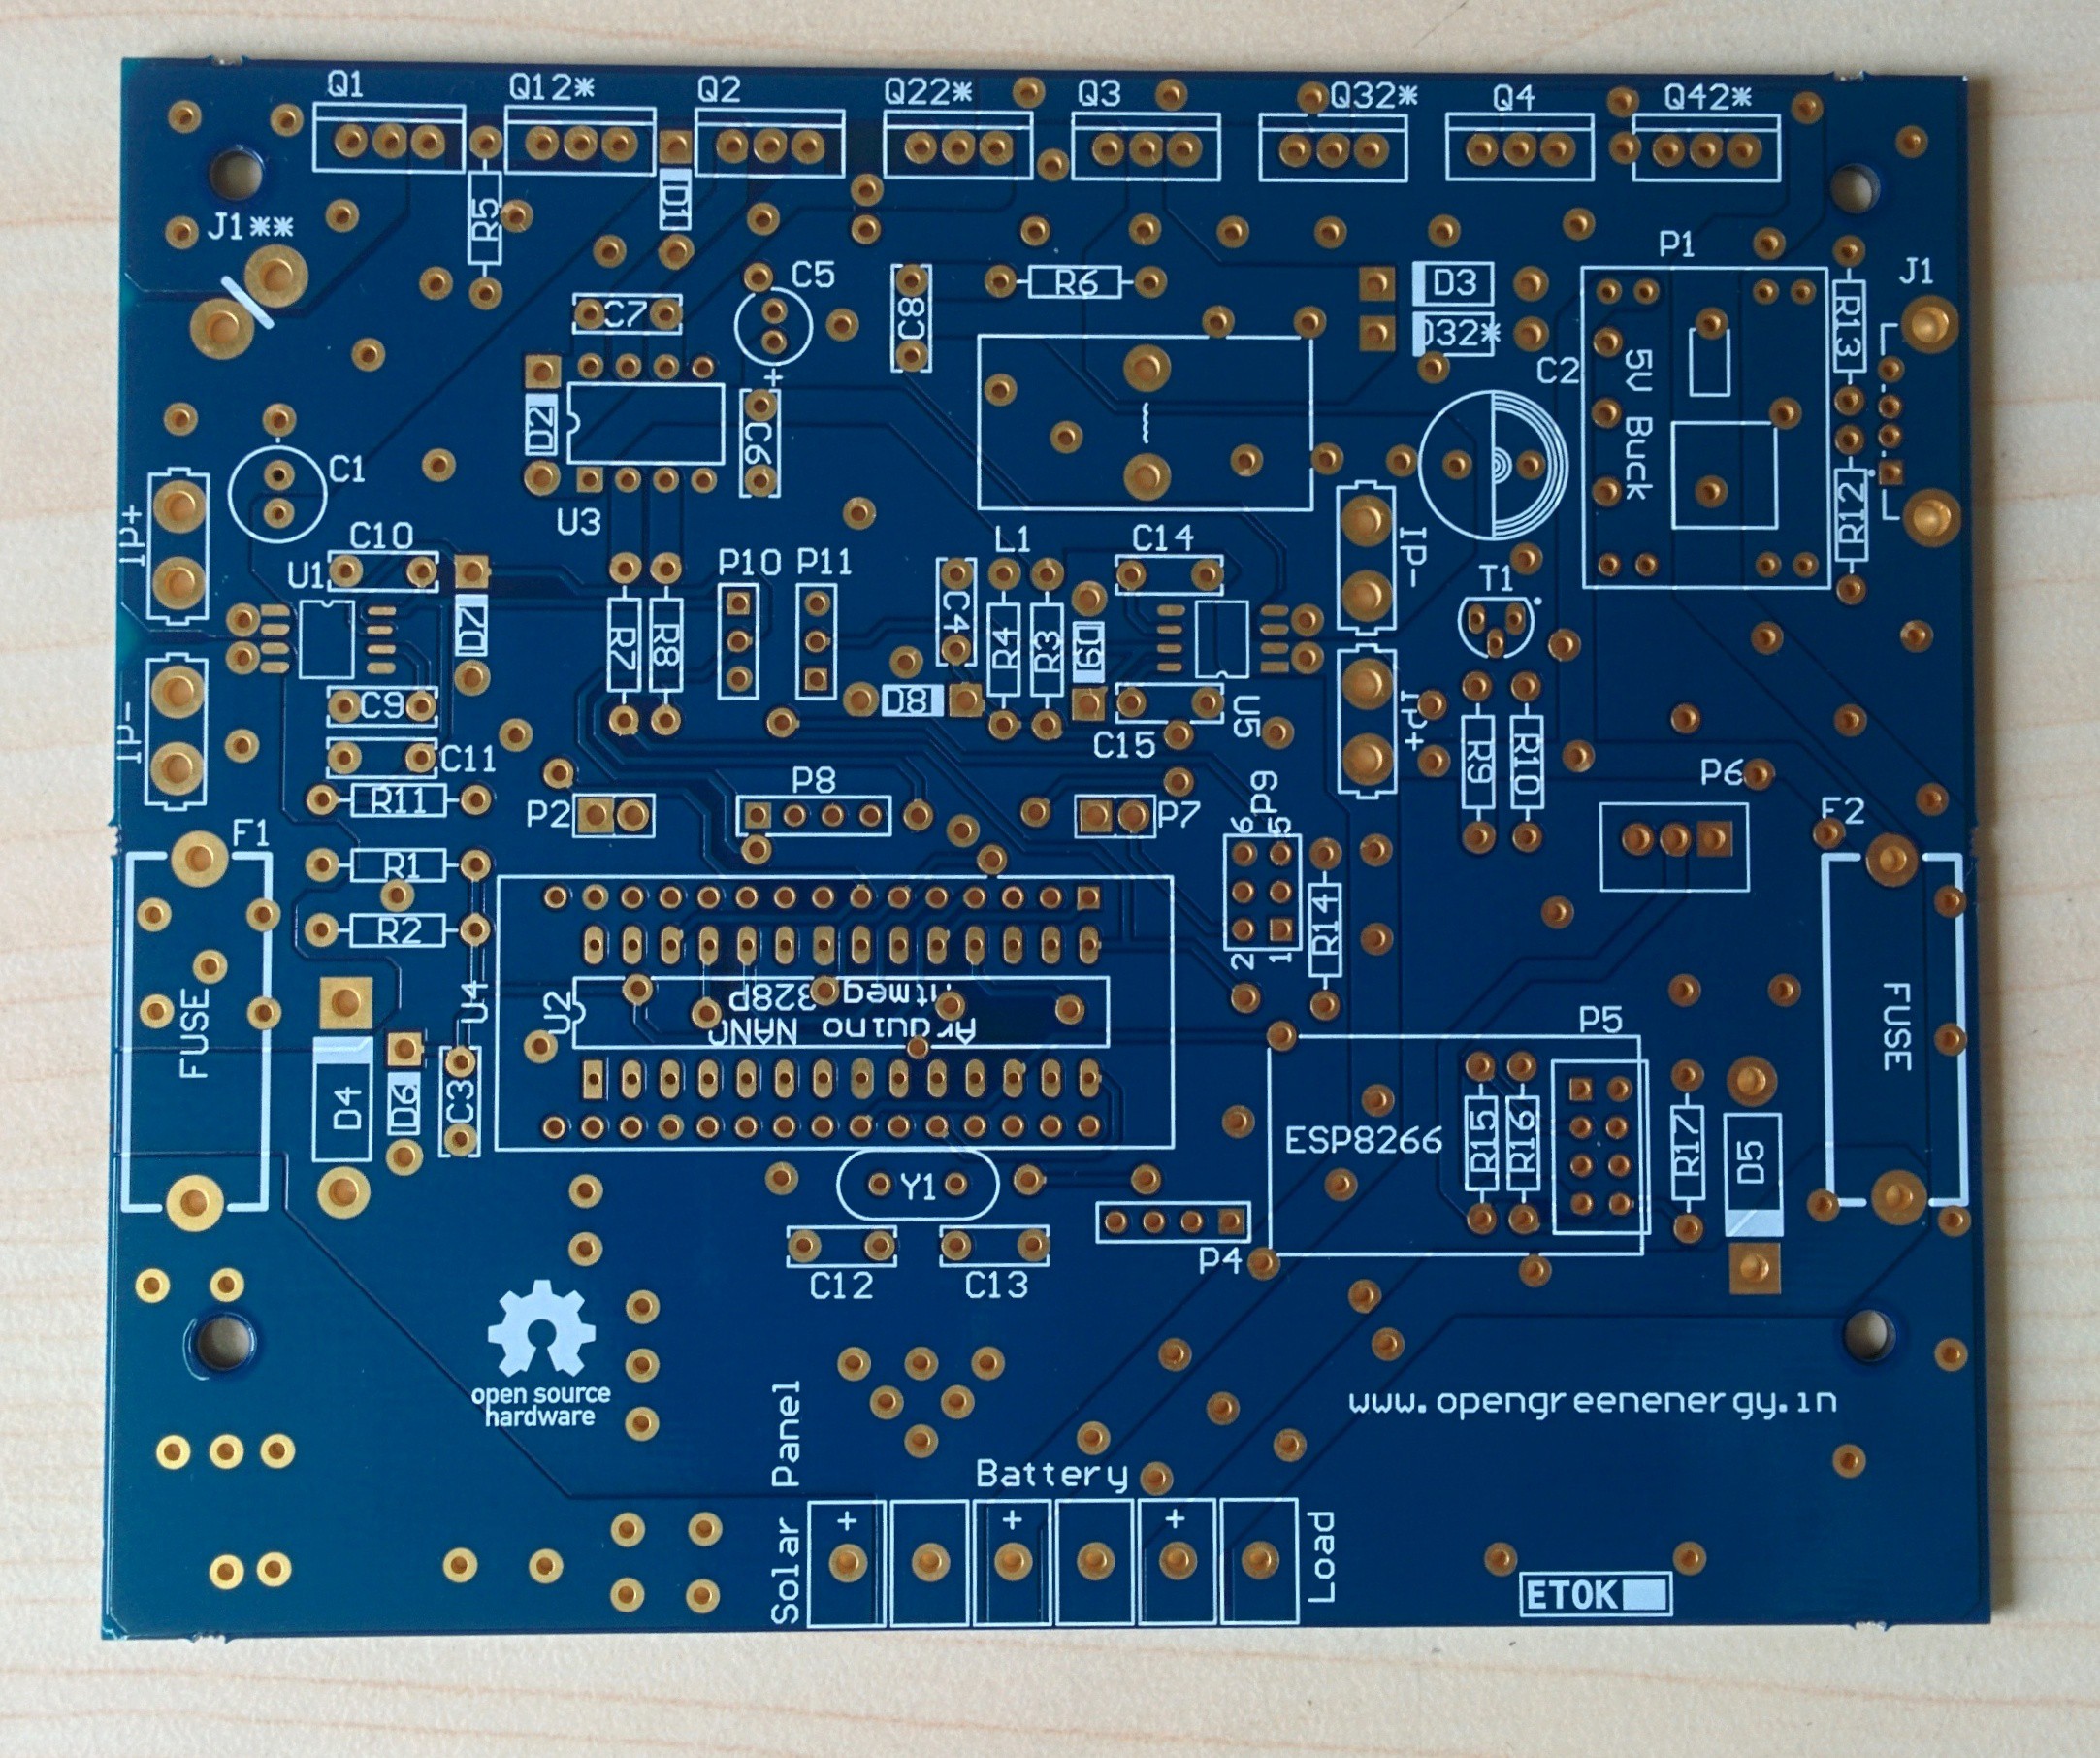
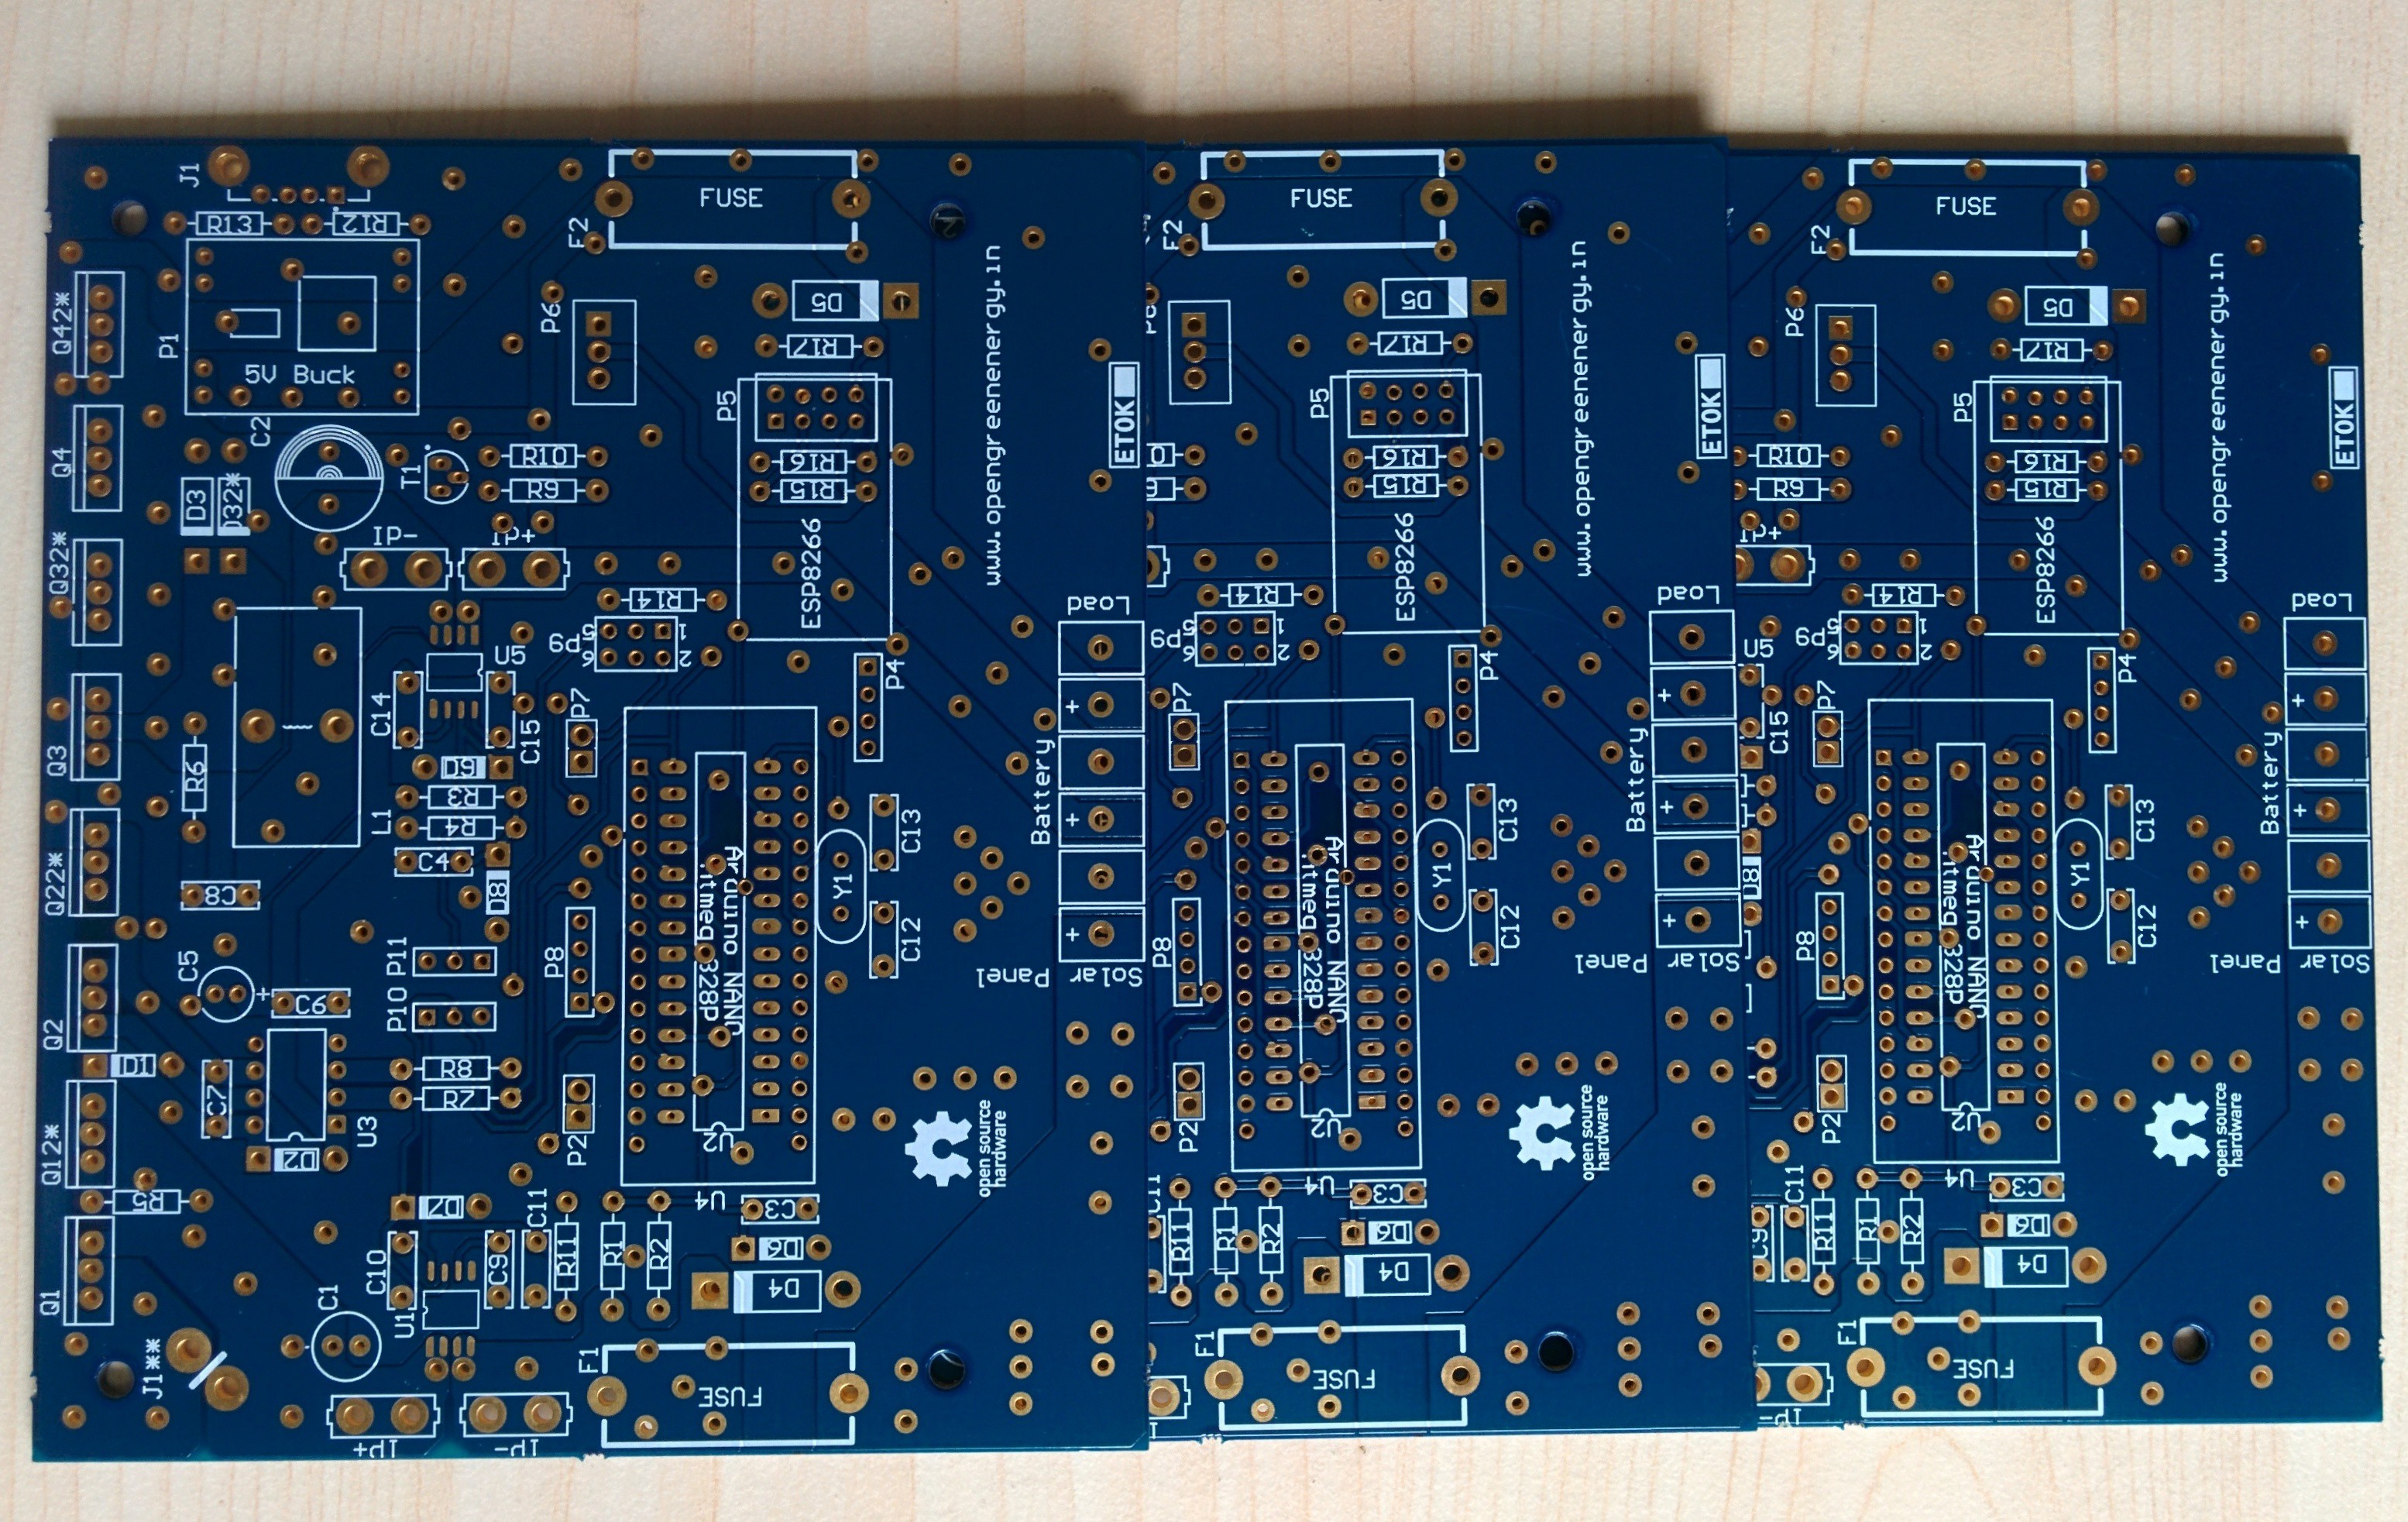
    On 4th August 2015, I received the PCB from fab house.It is manufactured locally at PCB Power.The board are looking really nice.The size of the board is 12.5mm x 10mm.

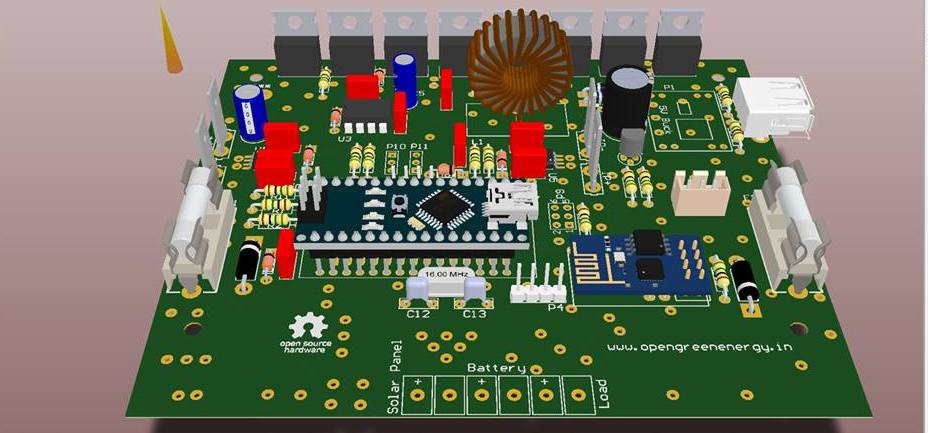
    This is 3D out look of the board after soldering the components.

View all 14 project logs

View all instructions

Enjoy this project?

Share

Discussions

bamideleelusade wrote 10/09/2015 at 15:49 point

Good day everyone, thank you for this project Mr Debasish Dutta and thanks Mr keith.hungerford for the mod. i downloaded the code for version 3.1 as i go through it i noticed that in the code the function read_sensor_data() is missing some things like all the readings were not averaged. Division by the number of time it was sampled, please some one should please look in to that and correct my misconception.

I try compiling the code but i got this error message from the IDE  'lcd' was not declared in this scope  this code was pointed to lcd.print(spinner_chars[cspinner%sizeof(spinner_chars)]); i will need an urgent help from any body thank you.

  Are you sure? yes | no

Open Green Energy wrote 10/09/2015 at 16:22 point

You have to download the correct liquid crystal library.

https://bitbucket.org/fmalpartida/new-liquidcrystal/downloads

  Are you sure? yes | no

morozaw wrote 10/07/2015 at 17:46 point

Hello Debasish and everybody!

Really nice project!
I have few questions about this project!
I am also working with MPPT design, but my own - little similar to this.

Did You or anybody have problems with charging the bootstrap capacitor?
Did You or anybody used blocking diode at output of dc converter?
How
is it possible that, the bootstrap works pretty well with output
voltage at VS of mosfet driver? There should be problem if Vin < 24V
in my opinion!
Did You have or anybody problems with reverse current from battery, through main inductor, via low side mosfet to GND?

Waiting for Yours reply!
Greetings from Poland!
Dominik

  Are you sure? yes | no

Open Green Energy wrote 10/09/2015 at 16:26 point

Hi morozaw,

Thank you for your appreciation.

We are facing the reverse current from battery through inductor,via the low side MOSFET to GND. Still now the problem is not solved.If you have a solution please help us.

  Are you sure? yes | no

smiley8088 wrote 08/24/2015 at 14:21 point

Congratulations for making it into the semifinals! Good luck for the next stage.

  Are you sure? yes | no

Open Green Energy wrote 08/24/2015 at 17:49 point

Thank you so much.

  Are you sure? yes | no

bandi94 wrote 08/20/2015 at 09:57 point

I asked some opinions on a forum from my country about the circuit and i got some feedback maybe your intrested to improve the circuit. The pump cap from the IR2104 should be increased from 100nF to something around 470nF ( considering that he need to drive two Mosfets insead of one). The Q3 will short when the IR2104 is not powered and gived the shutdown function. I was advised to use a simple async buck because the low voltage difference ( PV 17V battery 14V the power loss is significantly low about 2.5W difference at 10Amp, and will not cause headache of shorting out the battery) , anyway if you are looking for maximum efficiency / you want to be able to run 24V PV would not be your case. No mater what you will do Q3 will be under stress,simple sync buck converters are not made to drive a capacitive load ( when you don't drive capacitive load like a battery there is no current than can flow back to short Q3) but if you hook up a battery no-mater how less that Q3 is opened the battery is simply shorted ( for a smaller time or longer achieving a small time that doesn't burn Q3 out doesn't mean the batter is not shorted, i can guess that Q3 is building up some heat. How high end MPPT charger use sync buck well they must have some fancy way doing it hardware or software driven by a special designed uC. Driving an N-Mosfet on high side would require his Gate to be atleast 8-10V more positive that the PV voltage, driving the IR2104 from the 12V battery ( lets say 12.3V if we take a discharged battery) the bootstrap pump will double that so we will have 12.3*2 = 24.6 lets make it 25V if the PV voltage is 17V thats 25-17 = 8V only the very low end of the requirement, it works but if the battery is less than 12.3 or the PV voltage is bigger than 17V those Mosfets may not be able to fully turn on , at least Q1 with D1 dropping 0.7V that Mosfet will get only about +7.2V below the 8V limit. IR2104 should be powered at aprx. 15V like Tim Nolan did ( powered from the PV maybe there should be added a 20V zener to protect it if the battery would be disconnected and the PV voltage rise above 20V, in the datasheet dosen't realy says that the 20V limit is the uC's max power or is duet most mosfets Vgs is 20V, if the uC could handle more than 20V the software could fast stop the uC when it detects that the PV voltage is more than 19.5V si the mosfets are protected) but if you power it from the Solar Panel you will get Q3 shorted duet when IR2104 is not powered to hold Q3 closed Q3 may start conduct and short out . As i see the things i think i will attempt to build it with an async buck and IR2104 powered from the Solar Panel input ( in async mode you can't short the battery even if the IR2104 is not operation, R5 will discharge Q1 the battery is sealed). Maybe the IR2104 should be powered in the middle of two diodes one from the Solar Panel one from the battery somthing like this http://postimg.org/image/iifbi4791/ , daytime Solar Panel will have more potential so it will power IR2104 at 15V+ for an optimal Mosfet drive, night time the battery will have bigger potential so it will power the IR2104 this way it will be always powered hopefully the switch is fast enough to don't short Q3 ( the downtime of IR2104 durring the power supply switch should be low enough to IR2104 power up again and hold Q3 switched off).

D3 UF4007 reaction time is greater than the mosfets internal diode so it should be removed.

  Are you sure? yes | no

case06 wrote 08/13/2015 at 05:12 point

wetherall i like much your prototype-board designs, this new pcb looks great. Do you plan to sell it ?

  Are you sure? yes | no

Open Green Energy wrote 08/13/2015 at 05:18 point

Thanks.

Till now not planned as some issues are present. After solving everything, I will think for it.

  Are you sure? yes | no

Lars Sorensen wrote 08/03/2015 at 19:28 point

So... How is it going with the project?

I found these really cool power supplys for USB, that might be cool for the project:

http://www.ebay.com/itm/281588476204?_trksid=p2060353.m1438.l2649&ssPageName=STRK:MEBIDX:IT

http://www.ebay.com/itm/291214704965?_trksid=p2060353.m1438.l2649&ssPageName=STRK:MEBIDX:IT

  Are you sure? yes | no

Open Green Energy wrote 07/13/2015 at 10:04 point

Thank you to all of you for your valuable support and feedbacks.

I  won a DSlogic analyzer  for using Atmel parts in my 2015 Hackaday Prize entry.

http://hackaday.com/2015/07/09/50-winners-using-atmel-parts/

  Are you sure? yes | no

K.C. Lee wrote 07/13/2015 at 12:35 point

Congrats!  You've earned it!

  Are you sure? yes | no

Open Green Energy wrote 07/13/2015 at 12:38 point

Thanks and Congrats to you too :)

  Are you sure? yes | no

Petar wrote 07/13/2015 at 12:57 point

Congratulations!

  Are you sure? yes | no

Open Green Energy wrote 07/15/2015 at 09:32 point

Thank You 

  Are you sure? yes | no

antscran wrote 07/10/2015 at 14:58 point

Just joined the site and was reading some of the posts on here, I have built an MPPT tracker on the Texas Instruments C2000 platform back in January 2014.  It used a synchronous buck converter and also in a interleaved design to reduce the peak current, although it was only used on a 10W panel it could be easily scaled.

I am working on a new design which can be used with any microcontroller and currently have code for MSP430, working on Tiva C and will also bring over to the Arduino when I have time.  No battery charger circuit yet but will add this functionality as well.

The 4 part tutorial can be found here as well as some videos demonstrating the P&O algorithm working:

http://coder-tronics.com/c2000-solar-mppt-tutorial-pt1/

http://coder-tronics.com/c2000-solar-mppt-tutorial-pt2/

http://coder-tronics.com/c2000-solar-mppt-tutorial-pt3/

http://coder-tronics.com/c2000-solar-mppt-tutorial-pt4/

Shamlessly advertising my site :-)

  Are you sure? yes | no

Open Green Energy wrote 07/11/2015 at 02:53 point

Hi friend ,

No problem.I have already seen your tutorial.Its really nice.

If you have any suggestions please comments on my project.

  Are you sure? yes | no

aplavins wrote 07/02/2015 at 01:05 point

There are a few things about the code that I found issue with, I'm trying to fix them without messing up the rest. Please let me know if these issues make sense.

The variable pwm is a number between 0-100 whichis then divided by 100 and multiplied with 1024. This means that every % step we jump about 10 intergers. We could use all 1024 steps and have better duty cycle accuracy and therefore better voltage regulation.

When the sol watts is low, the charger goes into full on, which is the opposite of what it should do. We would want to use MPPT in this instance to get as much out of the panel as possible.

The decision of which state to be in relies on sol watts, I think it should be dependent on voltage only. We can use sol watts in the tracking algorithm and for display and data collection purposes but not here.

  Are you sure? yes | no

keith.hungerford wrote 07/02/2015 at 13:38 point

Hi Adam, a few comments on your suggestions. I don't have answers, but thoughts on some lines of inquiry to get the best system. 

I agree the use of 0 - 100 in units of 1 for PWM, then converting to an integer between 0 and 1024 is clumsy. It would be more logical just to set the number to its final binary value. However what is the best step size, ie 10 or 1 or whatever, is not so clear. I think there are several issues to think about here. Smaller step size will lead to slower convergence on the "best" value, and perhaps a more accurate setting. On the other hand, the quantisation of current and voltage measurements may have a role as well. Further, the environment may be unstable - that is, there may be variable illumination on the panels. Sometimes there will be steady, slowly changing illumination (eg on a clear day when the sun is at an angle which changes hour by hour). At other times there may be patchy clouds which come and go between the sun and the panels. Or the panels may be affected by shadowing from trees which are moving because of wind. Just how complicated we should be, can be, I don't know. There may be some good references out there (someone may have done their PhD on MPPT algorithms?) 

So maybe there is a PWM quantisation "sweet spot" that gives us good performance across the whole range of conditions. Some analysis and modelling might help.

Another thing has become clear to me working on sizing the inductor and capacitors, is that there is a substantial ripple current in capacitor C1, some of which is seen at the panel as voltage and/or current excursion. Is there some way of getting value out of that ripple to direct the MPPT algorithm?

I agree it seems logical that the decision to start MPP tracking should depend on solar panel voltage. But it also should depend on battery state of charge and the load current - if the output requirement is much less than what the panel can produce, we don't need MPPT at that time, we need to control the output current so that the voltage at the battery is the appropriate value for Float or Boost charging. I have not checked back over the code but I think this is already in there. I THINK  the right behaviour is to reduce the PWM so that the panel current falls, panel power falls, until the current into the Battery + Load just matches the demand, to give us the desired Float or Boost charging voltage. This is a sort of tracking, but it is not maximum power point tracking.

I think it would be good to have a clear description of all the states, and the conditions that lead to transitions to and from each one.

Keith

  Are you sure? yes | no

aplavins wrote 07/02/2015 at 14:55 point

Thanks for the reply Keith,

I uploaded a new version of the code to my github. I need someone with the standard hardware to test it. See if it does it's job and maybe some info on how long it takes to find MPP. link is here: https://github.com/aplavins/MPPT_Master/blob/master/MPPT_Code/MPPT_Code.ino

The charger has 5 states:

no_battery: If the voltage is below 10V, the battery is either too dead to charge or not connected. Charger is off, displays "noBat".

sleep: If the panel voltage drops below 15V, it's probably night. Turn the charger off to prevent current leaking back into the panel. (I think we are all still using Q1 right?)

bulk: If the panel voltage is above 15V and battery voltage is above 10 but below 13.5, go into bulk charging. begin MPPT algorithm. duty cycle starts at 50% (512) and changes by 1 each time through the loop. First direction is positive (more loading of the panel). MOSFET driver is enabled. sol watts begins at 0, on the second loop, it will have a value and on the third loop that value will be stored in old_sol_watts. Then begins the tracking, if the new value of sol_watts is less than the previous one, change direction of travel. In case of my panels MPP is at around 44% so we began at 50% and went up so in my case we would switch direction here. At this point it loops until it finds (and just passes) the MPP and then switches direction again, forever.

float: if the battery voltage rises above 13.5, we stop MPPT and begin PWM on the ShutDown pin. At 13.5 the charger is on 99.9% and is enabled. At 13.6 charger is still at 99.9% but is disabled. voltage will hover at the threshold of 13.5-13.6.

error: If the battery voltage goes above 15V, something is wrong. The battery will be over-charged. Turn off charger. display "error"

The % of pwm is now derived from pulseWdith(0-1024) instead of the other way around. 

The switch case happens in a seperate "if" statement and uses only voltage to decide which state to be in

Unless the battery is full, we are always using MPPT now. This applies to adding additional loads as well.

My CC has been working unsupervised for about 2 weeks now on a similar version of this code. Only difference is the way PWM is sent to the driver and the MPPT algorithm.

If you find any issues with the code, put them in "issues" on github and I'll try to correct them. Unfortunately it's tough to test when you don't have the same hardware. Anyone in Ontario, Canada that has it?

  Are you sure? yes | no

keith.hungerford wrote 07/03/2015 at 06:17 point

Hi Adam, this is all clear to me except  for: "float: if the battery voltage rises above 13.5, we stop MPPT and begin
PWM on the ShutDown pin. At 13.5 the charger is on 99.9% and is enabled. At 13.6 charger is still at 99.9% but is disabled. voltage will hover at the threshold of 13.5-13.6."

Can you please explain a bit more. Is it correct that when you "begin PWM on the ShutDown pin" that you hold the IN pin at 1 (High) and that the duty cycle on the SD pin is reversed? - it it has a short period of 0 (when HO will go high) and a long period of 1 (when HO will go low). Maybe the "enabled" and "disabled" relates to the IN pin? 

I guess that if the 0.1% PWM is not sufficient to hold the battey at 13.5 volts, then it will go down a bit and the charger will revert to MPPT briefly, so there will be an alternation between around 13.4 and 13.5 to 13.6. Is that correct?

Thanks, Keith

  Are you sure? yes | no

Petar wrote 07/03/2015 at 08:42 point

Hi guys! I found something interesting. It's for Microchip but is useful:

http://ww1.microchip.com/downloads/en/AppNotes/00001521A.pdf

  Are you sure? yes | no

aplavins wrote 07/03/2015 at 16:13 point

Hi Keith,

The pwm of 99.9% is always on the IN pin while in float. The SD pin is set high (on) when the voltage is at 13.5 and low (off) when at 13.6. If the voltage drops below 13.5, the charger will go back into bulk and MPPT will resume. It's like having a PWM charge controller switching from full on to open circuit, except that full on is 99.9% for the charge pump.

This is in contrast to the previous method which was to reduce the pwm on the IN pin lower and lower to prevent the voltage going too high without changing the SD pin state. The problem was that at very low pwm values, the inductor would saturate and Q3 would be shorting the battery and fail.

Now we are just setting the whole system to open circuit when voltage reaches 13.6. In the future I want to add a diversion load feature with it's own control MOSFET similar to the LOAD MOSFET. When the charger goes into float, it would turn on the diversion load to continue to utilize the power coming from the panel(s) even when the battery has been charged. The load would be best matched to ~90% of the output of the panel(s). It could be used to pump water from a well or heat/cool a space. I think this would be a useful feature in V4.

  Are you sure? yes | no

keith.hungerford wrote 07/04/2015 at 05:10 point

Hi Adam, thank you for the clarification. I believe that now a) I understand what your software is doing and b) I have corrected my misinterpretation of the IR2104 datasheet (for some reason I had the logic of the SD_bar pin upside down). 

I think that even with the new version of software you have written, there is still an opportunity to  have Q3 burnout. This will happen if the battery voltage sits and stays at 13.5 V for an extended time. At that voltage, the IN pin will be running at 1 on, 1023 off which means that Q3 will be 99.9% ON and the short OFF periods will not be sufficient to stop the reverse current flow. Therefore the reverse current flow will steadily increase, cycle after cycle, until something breaks.

You previously said "begin PWM on the ShutDown pin" and I think that is exactly what you need to do. If you hold the IN pin at a steady 1, and do PWM on the SD_bar pin, then when SD_bar is 1, HO is high making Q1 and Q2 ON, and LO is low making Q3 OFF, In the other part of the PWM cycle, SD_bar is 1, so both HO and LO are low, so Q1, Q2 and Q3 are all OFF (Q1 a little bit delayed by the RC circuit controlling its gate).

With this configuration, the converter is operating Asynchronously and in Discontinuous Current Mode (DCM). This mode is appropriate for all current levels below the threshold where if Q3 is left ON the current flows backwards through the inductor. I have been studying this mode in relation to the V4 efficiency modelling, and will show the results in the not too distant future.

I will respond to your suggestion about a "diversion load" a bit later and probably in the V4 development log which is where I think it will be most easily found. by others.

I think it is really good to have found an explicit reason for the Q3 burnout problem, so this is really important progress.

Thanks again, Keith

  Are you sure? yes | no

keith.hungerford wrote 07/07/2015 at 13:48 point

Hmm. Several things. I have made a local copy of your code and made a number of suggested adjustments to it. Most of them are just to do with editing comments. However there are a couple of "real" suggestions as well. I am not sure what is the best way of putting this into "the system". Currently it is in Word format with the changes highlighted with Track Changes. 

In addition I have a few issues I have been unable to resolve. 

a) polarity of PWM. My understanding is that if you set pulseWidth to (say) 102 (being about 10% of 1024) then you will get a signal out which spends 10% of its time as a 1 and 90% of its time as a 0. This seems to be the reverse of what you do in the code for case Float in the switch (charger_state) routine, where you set pulseWidth to 1022 which gives you close to 100% 1 (ie direct connection of solar panels to battery). 

b) granularity of PWM. Even though the pulseWidth parameter taken by the Timer1.pwm function is a 10-bit value, it does not give a 1024 step granularity to the actual PWM, because it cannot (as I understand it). This is because a 20 microsecond period requires just 320 cycles at 16 MHz, which is the frequency of the Arduino clock. There is a function that translates the pulseWidth parameter (10 bit) into the counter value that causes the PWM transitions. I think it is in TimerOne.cpp in the function setPeriod; however I find it a bit opaque. But anyway I reckon that changing the pulseWidth parameter in units of 1 will result in no change in actual PWM ratio for 2 steps and then a change on the 3rd step (or in some cases the 4th step), because the 1024 values of pulseWidth have to map onto 320 values of the counter that determines the PWM transitions. 

c) Minimum PWM to keep the IR2104 charge pump going: To keep the charge pump capacitor C7 giving around 10 V to the IR2104 VB pin, we need no less than a certain amount of time with HO at 1 and 0. I have not tried to work it out, but it must be at least a few 10s of nanoseconds. Now HO goes High about 700 ns after IN goes High, and goes Low about 200 ns after IN goes Low. So the pulse width on HO is about 500 ns shorter than on IN. There is a bit of variability in this, but I think we need a minimum pulse of about 800 nanoseconds on the IN pin, which would generate a pulse of 300 ns on the HO pin, with a further variable from the IRFZ44N which has a nominal rise time of 60 ns and a fall time of 45 ns, reducing our 300 ns by another 15. To get a minimum pulse of 800 ns we need to set pulseWidth no higher than 983 and no lower than 41. These should mean PWM counter settings of 307 and 13 and thus actual pulse widths of  812.5 ns on IR2104 pin IN. The next step down would be 750 ns. If this produces too high a charge rate in "Float" state, it will be looked after by the cycling between enable_charger and disable_charger. A further option, if we need to reduce the actual duty cycle further, is to increase the PWM period, as Debasish did in his original code.

d) DCM mode is a challenge. With the current hardware connections, it is not possible to do what I suggested in my previous post, that is to perform PWM on the SD pin. Reasons for this include the fact that currently the SD pin is connected to Arduino pin D8, which is not equipped to do PWM. However Arduino pin D10 is currently unused, and is equipped for PWM from Timer1, the same timer that runs the PWM on pin D9 connected to IN. Now this is where I get a bit unsure since there is a lot of complexity, some of it hidden and hard to find and understand. Timer1 has 2 counters, one of which is used to set the PWM period (ie the 20 microseconds that takes 320 clock cycles). The other one is used for performing PWM, currently only on pin D9 (IN). I think that if we want to do PWM on the SD pin (so as to implement Discontinuous Current Mode and reduce losses in the inductor, FETs and capacitors) then we just need to issue a new command similar to "Timer1.pwm(PWM_PIN, pulseWidth, 20), but for the SD pin. With some suitable logic to use this at the right time, of course.
Requests please:

Suggestion of how to provide my comments/suggestions on the code

Comments on the above 4 issues a) to d).

Thanks, Keith

  Are you sure? yes | no

Open Green Energy wrote 06/22/2015 at 15:14 point

Hi all,

Hackaday starts their second round of community voting for 2015 Hackaday Prize , and it’s time to select the community choice for the project Most Likely to "Save The Planet".

I made this project to harvest green energy and  help people to use clean energy.If we can use solar energy we can reduce the environmental pollution to a great extent.

I request you to vote for me,if you think it is useful.Your vote is valuable for me.

Thanks

You can vote  by click on the link  https://hackaday.io/prize/vote

http://hackaday.com/2015/06/22/new-round-of-astronaut-or-not-most-likely-to-save-the-planet/

here’s a video tutorial on how to vote: 


  Are you sure? yes | no

keith.hungerford wrote 06/23/2015 at 12:39 point

Well I voted, went through all my 50 votes, but this Arduino MPPT project did not come up, so I could not vote for it. 

But I discovered a couple of other interesting projects along the way! Keith

  Are you sure? yes | no

Open Green Energy wrote 06/23/2015 at 15:01 point

No problem :)

Anyway you discovered few interesting project is good news.Thanks

  Are you sure? yes | no

Juan Perez Estrada wrote 06/17/2015 at 19:42 point

Hi, 

I begin to simulate this circuit in Multisim14. My power source is not a Solar Panel, it is a VDC Power Source of 15.2 V, I have also a square signal for IR2104 with a 80% duty cycle, so I expect a 12.16V as output.

The simulated output is 11.7V (with a 2ohm load) but what scares me is the first miliseconds. As you can see in this screen capture, output can reach 19 or 20V. I don't know if this is a big problem or is normal, and no item will be hurt about this little overvoltage. 

The image show both square signal and output signal. Blue line is where output voltage is 19V and yellow one: 11.6V.  The time at yellow line is 3.4 miliseconds.

Is a 3.4 miliseconds overvoltage to worry about it ?

Link:  http://thirdpartysoft.comlu.com/150617_MPPT.png


Does anybody know about it ?

  Are you sure? yes | no

aplavins wrote 06/19/2015 at 14:34 point

In the real world circuit, the battery would clamp the output voltage to it's own voltage. Only if the battery were disconnected in mid-charge would the voltage spike up that high.

More important is that at startup if you begin PWM at a value less than ~20% (say 0) and the code is slow to bring it up, you will have several milliseconds of a near dead short from B+ to B- through Q3. Which is the problem that the previous design was suffering. Simple fix is never allow the PWM to go below 30% or above 95%. I use constrain() to do this. When the battery is almost fully charged, the code will drop the PWM down as far as it can until it hits the constrain limit. At that point we have to stop modifying PWM on IN(pin) and start modifying PWM on SD(pin). During shutdown, both high and low side MOSFETs are off so no shorting and no over-charging.

  Are you sure? yes | no

Open Green Energy wrote 06/19/2015 at 16:02 point

Thanks for clarifiaction.

I expect you will solve it by modifying the v-3 existing code .

  Are you sure? yes | no

juan3211 wrote 06/21/2015 at 06:31 point

Thanks for clarification apalvins, Great!!! I understand you perfectly. In any case, should it be avoided ? Or TVS will do his work ? 

Another think, will Debasish and you work in the same github area ?

  Are you sure? yes | no

Open Green Energy wrote 06/21/2015 at 06:41 point

You are right.We are rectifying few issues in the code.You can see the updated code in GitHub.

  Are you sure? yes | no

aplavins wrote 06/17/2015 at 01:34 point

Hi all,

Hope this finds you well, it's going to be a long one...

So I've built a copy of Deba's V3 charge controller with the newest circuitry. I wrote my own code for it because I'm not using current sensors. You can find it here https://github.com/aplavins/Arduino-MPPT.

A bit of background first, I've already built one of Jullian Ilett's arduino MPPT charge controllers and it was working great. His current version relies on a 9V battery to produce the required gate voltage to switch the high side MOSFETs. The battery dies eventually and the controller becomes inoperable. He has a nice solution with discrete components and opto-isolators but hasn't implemented or shared it yet. I stumbles across Deba's instructable that uses an IR2104 to do the high-side switching which is solution to the problem I was dealing with.

So I built one and I've been testing it on a 250W panel and a standard car battery. It works quite well after the new schematics were done (I had to learn the hard way). So far I've blown up 2 irfz44Ns in position Q3, 2 ir2104s (probably because of the shorting), and the charge pump capacitor. Repaired it each time without much hassle, no problem, it's all part of the prototyping process. The next thing to go will probably be the capacitors across the input of the ir2104. They are getting uncomfortably hot (even with a fan).

I added a few things: 

- a large 12V fan that turns on during bulk state

- 5.1V zener diodes protecting all of the inputs to the arduino (I blew an arduino mega and almost my laptop while building the last charge controller)

- changed the voltage divider on the input side and other input side components to handle my solar panels (~35V open circuit in full sun)

Things I could do without:

-USB charger (I have about 10, don't need anymore but I understand that others might)

-WIFI chip (too complex, I just want to charge a battery)

-Current sensors (Would be nice to see the power, efficiency, etc. But don't need it to do MPPT)

-5V Buck converter (no usb charger so no buck converter. (we could make one from discrete components running off the same arduino))

-No LCD (If I really need to know what's going on, I'll plug in the serial cable. Other than that, I'll probably never need to know what it's doing, as long as it's doing it's job)

Improvements I think are needed:

- Fan (no question that this thing needs a fan)

- more accurate voltage measurement (I'm using 1% resistors and still my error is tenths of volts)

- better code (I'm working on this with Deba)

- more protection (If I can still blow up stuff, other peple are going too also)

- more reliable design (This will come with time and testing)

- greater current handling capabilities (putting MOSFETs in parallel)

- higher input voltages (less losses if panels are put in series)

I see this project going in 2 directions. People that need a tool that works for as cheap as possible (barebones design), and the serious hacker. The first group doesn't care about volts or watts or WIFI or data logging, they just want to plug in and do the job. The other group wants that with all of the goodies; displays, WIFI datalogging, LCD, etc.

phew....

I can help write code and test electronics, I'm very interested in this project for my own use and for sharing with others. I know the circuitry inside and out now, as well as the code. it's only a matter of making it suit the needs of everyone.

-Adam

  Are you sure? yes | no

Open Green Energy wrote 06/17/2015 at 01:54 point

Hi Adam,

Thanks for sharing your experience and ideas.I am very happy to see you as a contributor to this project.

  Are you sure? yes | no

keith.hungerford wrote 06/21/2015 at 00:00 point

Hi Adam, great posting. I have a few questions I would like to put.

You say you can do MPPT without current measurement. From the code, I understand that every 15 seconds you disconnect from the solar panel(s), allow them to reach OC voltage, measure it, then set the PWM to draw current so that the on-load voltage will be 76% of the OC voltage.  My question is, do you have an estimate of how much potential power you are losing from this simpler scheme?

Can you share the schematic diagram of your version of this controller? I am interested to see all the detail changes you have made to component values etc.

Most important to me, can you please share the design and construction details of the up-rated inductor you are using?

I think I am likely to have more comments and questions but will write them later. Keith

  Are you sure? yes | no

aplavins wrote 06/21/2015 at 15:56 point

I estimate the power loss to be 1.2% for the time that it takes to measure the OC voltage. Since measurement only takes about 200ms every 15s. There is a schematic on my github page.

https://github.com/aplavins/Arduino-MPPT/blob/master/MPPT charge controller barebones.pdf

I used Deba's V-3 page 5 and http://www.daycounter.com/Calculators/Switching-Converter-Calculator.phtml to calculate the required Inductance. Both sources gave me a value around 20uH. I knew that my peak current was about 26A so I chose 14awg enameled copper wire for winding. I went to the local electronics shop and found the biggest toroid ferrite core they had. The ferrite was green and this page http://www.badcaps.net/forum/showthread.php?t=19594 toldme that green color ferrites are type 52. This page http://www.fair-rite.com/newfair/materials52.htm told me the permeability of that particular material. Then I used http://coil32.net/online-calculators/ferrite-torroid-calculator.html to find out the number of turns required for the inductance I wanted. 

My result was 7.6 turns but I wanted to have more inductance than I needed so I just rounded up to 10.

Not very scientific but it seems to work.

To mount it to the PCB is pretty straightforward, just drill out the holes to fit the wire, remove the enamel coating and solder.

  Are you sure? yes | no

keith.hungerford wrote 06/22/2015 at 04:18 point

Thanks Adam, Some comments. Re power loss from calculating the MPP as 76% of Voc: In addition to the 1.2% you lose from turning off the panel for a short time every 15 seconds, you inevitably don't sit exactly on the Max Power Point of the panel. From the sample of grid connect panels on my spreadsheet, the quoted Vmpp ranges from about 79% to 84% of Voc. I tabulated the power difference between 76% of Voc times MPP current for these panels, and got numbers ranging from 90% up to 99% of MPP power. These numbers may be a little pessimistic since the MPP current will be marginally lower than the current at a slightly lower voltage. So your total power reduction is somewhere between 2% and 10%, probably dependent on a lot of variable factors, as well as panel characteristics. 

In addition to losing a bit of power, by omitting the current measurement you also give up on a mechanism to prevent a too-large panel from generating more current than the internal components can take, and as a result creating a reliability problem. I regard this as the more serious issue.

Thanks for the look at the schematic. I am studying it, comments later maybe.

Regarding the inductor, I used this as my first exercise in the arithmetic on skin effect, expecting to find a significant problem. However I did not find any serious issue which is good news I think. This is what I found. 

Although you did not give dimensions of the toroid, I guessed some numbers: 40 mm of OD, 25mm for ID, and 15 mm for height. I back-calculated the L100 value as 3500 microhenries per 100 turns, based on needing 7.6 turns for 20 microhenries. That means that with 10 turns you actually have 35 microhenries. According to my reading of your sofware code, you are using a switching frequency of 40 kHz, which means that to get a required inductance of 20 microhenries you allow the current ripple to be 45%. With the extra turns giving 35 microhenries, the ripple goes down to 26%, and the ripple current is 5.2 Amps p-p, which is 1.5A RMS. 

Using the assumed toroid dimensions, I calculated your wire length as 455 mm (allowing for 30mm tails) which gives a DC resistance of 3.77 milliohms, giving a heating effect of 1.5 Watts or 0.6% of the total power - quite acceptable.

Next I calculated the skin depth for the AC component, which at 40 kHz in copper is 0.33 mm. (66.2 * f^-0.5)

This gives a wire diameter to skin depth ratio of 4.9, which in turn looking up the best reference I have on the subject, a paper by Bruce Carsten for Micrometals Inc, results in Rac / Rdc of 3.2. So that means your Rac = 3.77 * 3.2 = 12 milli Ohms. Multiplying that by the AC RMS current (this is a bit approximate because the AC current is triangular and has components at 3f, 5f etc.  but they are pretty small) gives an AC power loss of 0.03 Watts - way down in the noise. 

This may be a bit of a non-result, however I guess one thing I can conclude is that if you are experiencing excessing heating in your controller, it is not coming from the inductor. 

I hope you find this interesting. Keith

  Are you sure? yes | no

Open Green Energy wrote 06/22/2015 at 07:22 point

Hi Keith,

Thanks for the detailed analysis of adam's controller.Can you share a good reference on skin effect ?

  Are you sure? yes | no

keith.hungerford wrote 06/22/2015 at 10:15 point

The best reference I have found is by Bruce Carsten titled "CALCULATING THE HIGH FREQUENCY RESISTANCE OF SINGLE AND DOUBLE LAYER TOROIDAL WINDINGS"

The web address is http://www.micrometals.com/appnotes/appnotedownloads/chfsdltw.pdf

There are several other application notes on the Micrometals web site of interest, relating to practial winding of toroid cores, and the properties of the various materials used for core manufacture. 

It turns out that the Yellow/White material No. 26 used in the original V3, and the Green material No. 52 used by Adam, are almost identical in behaviour.  

I continue to study this subject.

Keith

  Are you sure? yes | no

keith.hungerford wrote 06/22/2015 at 10:16 point

The best reference I have found is by Bruce Carsten titled "CALCULATING THE HIGH FREQUENCY RESISTANCE OF SINGLE AND DOUBLE LAYER TOROIDAL WINDINGS"

The web address is http://www.micrometals.com/appnotes/appnotedownloads/chfsdltw.pdf

There are several other application notes on the Micrometals web site of interest, relating to practial winding of toroid cores, and the properties of the various materials used for core manufacture. 

It turns out that the Yellow/White material No. 26 used in the original V3, and the Green material No. 52 used by Adam, are almost identical in behaviour.  

I continue to study this subject.

Keith

  Are you sure? yes | no

aplavins wrote 06/22/2015 at 11:51 point

Wow great work Keith, it looks pretty sound to me. I don't have a scope so I can't measure the output ripple. I can say that the inductor never even gets warm. On a side note, my other charger that has a current sensor peaked at 251W out of a 245W panel using the same algorithm. Don't know of that's because of inaccurate measurements or if it was a real value. Hardware was different as well.

  Are you sure? yes | no

keith.hungerford wrote 06/23/2015 at 12:52 point

I am continuing to work on the inductor design, finally got to what I thought might be a good answer for the 40A controller, and did the sums to check flux density and core losses due to flux hysteresis. I found they were pretty bad in the inductor I had selected, so I need to go back over it and redesign.

Using the same method I thought I would check Adam's inductor, and found that my calculations show it to be heating up a lot as well. 

What I got at 20 Amps and 40 kHz was 1.5 W of resistive loss and just under 3 W of magnetic hysteresis loss, adding to a total of nearly 4.5 W. If my method is correct, and if Adam's core is of the dimensions I have assumed, it should get to about 30 C above ambient. There are some significant "ifs" in there. The inductor should really feel quite hot, which is contrary to Adam's report. 

Maybe worth a double check. Keith

  Are you sure? yes | no

varun94171 wrote 06/08/2015 at 06:54 point

Hi Keith
I am working on a solar power system of 3Kw/48v.I am using a MPPT solar Charge controller of 48v/60A & 12 solar panels of 250W each.The problem is that the specific gravity of the battery is not increasing ie the specific gravity is near to 1120 even when i remove the load from batteries.on a good sunny day i'll try to just charge my batteries to increase their specific gravity without putting any load but when i checked the batteries gravity in the evening it is same ie near to http://1120.So i want to ask that even on a good sunny day when ampere are very good near about 45 A then why the gravity will not increase just only the voltage increses to 58v of the 4 series http://batteries.so help me to solve my problem....

Thanks in advance..........

  Are you sure? yes | no

aplavins wrote 06/17/2015 at 00:51 point

Is it just one battery or all of them?

  Are you sure? yes | no

keith.hungerford wrote 06/03/2015 at 14:22 point

I have been studying the circuit and the component specs some more, as well as looking at the software code. 

I remain puzzled as to why you experienced burn-out of Q3. I think that if there is a battery connected with 12 V, but no solar panels connected, then all of the MOSFETs will be OFF, simply because all of them will have their gates at zero (ground) voltage. This must be wrong (because you had the problem) but I can't work it out from the circuit. This is especially so with the VCC of the half bridge driver IR2104 fed from the solar panel voltage, which is zero in this case, so all its outputs must be zero also. I am sorry this is not very helpful.

I am now convinced that VCC of the driver IR2104 should be fed from the battery voltage (12 volts nominal) and not from the solar panels. There are several reasons for this: 1. it means the driver will always be working, and so  you have positive control over the switching MOSFETs at all times. 2. the voltage from the solar panels has been specified as up to 25 volts, which is a bit more than needed to connect a standard 36 cell solar panel. The voltage doubler circuit that generates the Vb voltage for the driver will turn that into 50 volts, which in turn will put 25 volts onto the Source-Gate interface of both Q1 and Q2. The maximum rating of this interface is 20 volts, so either of these FETs may become unreliable with a high solar panel voltage of more than 20 volts. Using the battery for Vcc of the driver means that Q1 and Q2 both only have Source-Gate voltages equal to the battery, which is comfortably within the 10 - 20 Volt range of these MOSFETs.

When investigating the problem with burn-out of Q3, perhaps you could connect the battery via a suitable resistor (say 5 ohms, 20 Watts) which will let you experience something close to your original conditions, without risking losing another Q3.

I am still not convinced that there is a need for Q1 and its driver circuit. Removing it would slightly improve the efficiency of this converter, and simplify the construction. I think that in all the cases when Q1 is OFF, then Q2 is OFF as well. So Q1 is not actually doing anything useful.

I am also a bit concerned about the driver circuit for Q1, which is a bit complicated as follows.

Normally the PWM cycle runs at 20 microseconds, with adjustments made in 1% steps (this is my understanding from examining the software code, and may be wrong). The maximum PWM value for this mode is 99%. If the algorithm finds the next value would be 100%, instead it increases the cycle to 1000 microseconds and changes the PWM duty cycle to 1022/1023, which is very close to 99.9%.

At a 20 microsecond period and 99% duty cycle, we have "OFF" pulses of 200 nanoseconds (20 microseconds / 100). 

At a 1000 microsecond period and 1022/1023 duty cycle, we have "OFF" pulses of 977 nanoseconds. 

The driver IR2104 has some delays built in, partly as a means to guarantee that Q2 and Q3 are never both ON at the same time. Those delays have some tolerances built in. According to my reading of the specs, for an OFF pulse length on the IN pin of X microseconds, the LO pin gets a minimum of X - 0.67 microseconds ON, and HO gets a maximum of X + 0.84 microseconds OFF. The "typical" figures are a bit less extreme but I think it is better to work with the guaranteed max and min values. This means that the minimum OFF pulse length on IN that will produce actual conduction in Q3 is 670 ns. This means that a PWM duty cycle of 96% is OK (pulse length 800 ns) but 97% and over may produce no conduction in Q3. No conduction in Q3 means that capacitor C7 does not get recharged and eventually the voltage at Vb will be insufficient to keep Q2 ON. 

The PWM duty cycle of 99.9% at a period of 1000 microseconds is always OK, because we always have a guaranteed 300 ns of ON for Q3 (977 - 670 = 307 ns).

The situation for Q1 is even more problematic. As I understand the circuit, the pulses from HO are fed not only to the gate of Q2 but also through a diode D1 to the gate of Q1. Q1 has a Gate capacitance of about 1400 pF, which with the resistor R5 of 470 k produces a time constant of about 700 microseconds. Thus if the pulses from HO come every 20 microseconds, the gate of Q1 stays at about the peak HO voltage, since 20 microseconds is much less than 700 microseconds. However if we reduce the frequency of HO pulses to 1000 microseconds ("99.9%" duty cycle) there is some chance that the gate voltage of Q1 may fall below 10 Volts and its ON resistance will be increased, possibly with bad consequences. OR if we try to use 97%, 98% or 99% PWM, there may not be any pulses at all and within a few milliseconds Q1 will be fully OFF. 

My favoured approach for Q1 is to remove it. However if you think it is needed, then putting a small capacitor (say 4700 pF) between its Gate and Drain would extend the time constant sufficiently to cover the 1000 microsecond cycle (subject to more accurate arithmetic). 

To deal with the cases of 97% to 99% PWM, my favoured approach would be to use a longer cycle period, either the same 1000 microseconds as for 99.9%, or something in between - say 100 microseconds. 

I think the main issue with the longer cycle time is that the inductor L1 may saturate when fed current for such a long time. However that in itself may not be a problem. It will certainly have enough energy stored to cover the short pulse when Q3 is ON, which is its main function. 

I hope this is useful.

  Are you sure? yes | no

Open Green Energy wrote 06/03/2015 at 14:33 point

Thank You So much for analysing in details.

My next task is to change the power supply of MOSFET driver IR2104 from solar to battery and removal of MOSFET Q1.

  Are you sure? yes | no

Open Green Energy wrote 06/05/2015 at 11:27 point

Can I test without Q1,D1 and R5 ?I think there is no need of R5.

  Are you sure? yes | no

keith.hungerford wrote 06/05/2015 at 12:48 point

You are right there is no need for R5.

First., you have taken Q1, D1 and R5 out of the circuit. So the IP+ terminal of the ACS712 goes to the capacitor C1+ and to the Drain of Q2. 

Next,  VCC of the driver IR2104 now goes to the battery terminal JP2 #1, as well as to D2, C5 and C6,.

Also maybe the battery terminals feed the package buck converter that produces the 5V rail for the Arduino, LCD, and the linear regulator for 3.3V that feeds the WiFi module?.  

When powering up, I would have the osilloscope probe or a voltmeter on the Drain of Q3, which should immediately rise to the full battery voltage when you connect the battery. If it only rises a little bit, it means Q3 is ON, and you need to quickly disconnect the battery again and work out what is going on to cause Q3 to turn on. 

Best wishes,

Keith

  Are you sure? yes | no

ghandi galila wrote 07/30/2018 at 04:20 point

hi, kieth

i have read the problems in the mppt circuit.

correct me if i am wrong. the mosfet burnt out only when there is no solar panel is present or when the sun is down? 

if that happens the only thing to do is turning off the Q3 right?

i have also built the my mppt and also encounter the problem. the only solution I've made is to put diode before the battery but it is lowering the efficiency. 

so removing the diode before the battery (improve efficiency) and making the Q3 off when the sun is down is the right solution for the mppt to prevent the Q3 from burning?

  Are you sure? yes | no

keith.hungerford wrote 07/30/2018 at 09:23 point

Hi ghandi,

It has taken me a long time to work out any solution and then the best solution to this problem. I have done a lot of simulations of a variety of configurations, but I am not yet quite at the point where I can "go public" with a coherent story about this problem and its solution.

The Q3 burnout problem occurs when Q3 is turned on but there is no corresponding period when Q2 is turned on. Current flows from the battery through the inductor and Q3 to gound, an builds up to an excessive level. It is part of the interplay between the various voltages and the PWM starup strategy which is in the software.

My currently favoured solution is exactly the one you mention - a diode between the charger and the battery. Preventing the battery voltage from feeding back to the charger has 2 beneficial effects: the first is that it is impossible for Q3 to short out the battery and carry a large current. The second is that the startup sequence becomes very easy, because Q2 can be turned ON with a gate voltage that is no more than the battery voltage.

The breakthrough is to use a MOSFET diode between the charger and the battery. You can find some circuits and simulations of MOSFET diodes at https://github.com/farmerkeith/circuits/tree/master/MOSFETdiode

You can also find an example of a solar charger using a MOSFET diode exactly as you describe at  https://github.com/farmerkeith/SolarChargerSZBK07ModuleV2

This project is also available on hackaday.io at https://hackaday.io/project/159748-solarcharger-szbk07v2

There are quite a few MOSFET diode circuits, some of them using a special purpose IC LTC4414 which is for P-channel MOSFET. There may be an equivalent part for N-channel MOSFET but I don't know its type code. In my preferred design I use a N_channel MOSFET with a very low On resistance (<4 milli ohms) and 2N7000 N-Channel MOSFETs for the control. Very simple and it gives a very good, low ON resistance and minimal power loss.

Please let me know what you decide to do.

Keith

  Are you sure? yes | no

ghandi galila wrote 07/30/2018 at 12:50 point

hi kieth

thank you for your past response, as new solution to the problem. i have powered the mosfet driver from new dc-dc which gives stable 15v. there for, whether the sun is down, the mosfet driver will still have power. may be that would be solution from burning? and also. Other soltuion is that. i have to turn off the low side mosfet when the sun is out or mppt is in Off State. I ordered my pcb already hoping no problem occur. also using the p channel mosfet is not advisable in my place really hard to find here. all i can use is the n channel mosfet. the problem also with p chanel is that low current. what can you say about my two solution?

  Are you sure? yes | no

keith.hungerford wrote 07/30/2018 at 22:35 point

Hi ghandi, I don't think either of your "solutions" in  your second message will help.

I think you need the MOSFET diode between the charger and the battery. My previous answer gave you links to a suitable design using an N-channel MOSFET, and I think you should go with that.

Keith

  Are you sure? yes | no

ghandi galila wrote 07/30/2018 at 23:52 point

sorry forgot to tell you i am not using ir2104. i am using different driver which the lower side can be off independent. when thats happen, you can now shut down the pwm so both  mosfet will shutdown. preventing current flows in any direct.

  Are you sure? yes | no

keith.hungerford wrote 07/30/2018 at 23:59 point

Hi ghandi, I understand what you say. However I think the problem is not when the solar panel is not producing, the problem is when the charger is starting up, at which time the panel is generating a voltage higher than the battery.

The critical task is to get the high side MOSFET to turn on during the startup phase.

I am interested to know what driver you are using. Can you tell me that please?

Keith

  Are you sure? yes | no

ghandi galila wrote 07/31/2018 at 00:10 point

i am using MIC4102, can you look at this driver may we could prevent the burning of mosfet.

  Are you sure? yes | no

ghandi galila wrote 07/31/2018 at 01:08 point

as i understand, putting diode parallel to lowside mosfet, and turning off lowside mosfet  will put the buck into nonsynchronous. i dont think that could be a problem for lowside mosfet to burnt out? (referring MIC4102).

http://www.ti.com/lit/ml/slyp089/slyp089.pdf 

take a look at this. same problem.same solution.
turning off both mosfet prevent from reverse current. but in my case i put my vin mosfet at the ground side. but same function. look at the figure 20.

here my solution, mppt code will be greatly change. first thing is we need to priority read the reverse current from the sensor going to the battery. small amount of reverse current must be a trigger to off the low side mosfet. jsut like the http://www.ti.com/lit/ml/slyp089/slyp089.pdf  solution given. only that is the best solution.

  Are you sure? yes | no

Open Green Energy wrote 05/31/2015 at 18:56 point

Hi all ,

I am really sorry for not replying your comments from long time.

As my exam was on May ,I was busy in my exam preparation.But now exam is over,I will try to involve more in to this project.

I need some help.I am facing few problems in my controller.I want to solve one by one.

Problem -1 :

When I connect the battery to the controller,the connection between the battery and the switching ( buck converter ) become very hot and then MOSFET Q3 burn out.

I think it is due to shorting of MOSFET-Q3.Current flows from Battery -MOSFET Q3- GND which is unexpected.

Suggested solution by a friend :

http://www.instructables.com/image/FBTYJBFI7KBCRM9

As per the above schematic link ,The blue arrows show the expected current flow in the buck circuit. The red arrow shows how current could flow in a faulty condition.

He suggested to put a diode at the output to prevent it.Though after using the diode the problem was  rectified but it reduce the converter efficiency.I do not want this.

Please help me to rectify the problem.I request to go through the software as well as hardware for rectifying.

Thanks to all for your support.

  Are you sure? yes | no

keith.hungerford wrote 06/01/2015 at 08:27 point

Hi Debasish, Evidently the problem is that Q3 is ON when conditions are not suitable. 

I got a report from my son who looked at  your software code, and I understand that the initial state is for PWM period of 20 microseconds and a PWM duty cycle of 0. I believe that means Q2 is OFF and Q3 is ON continuously until a PWM adjustment is made. 

The buck converter concept only works if the input voltage is at or greater than the battery voltage. So I think you need to turn off the PWM (or not turn it on) until the voltage coming from the panels is at least as big as the battery voltage.

The most obvious thing to me is that the software should initialise with the SD input of the driver enabled, so as to turn off both Q2 and Q3. You need to do a check on the respective voltages of battery and panels, and not start the PWM until VPanels > VBattery. A slightly more complex approach would be a 3 state solution:

VPanels < VBattery - everything OFF

VBattery <= VPanels <= VBattery + VOffset - Q2 ON, Q3 OFF. VOffset is maybe 1 volt. This equates to PWM=100%. 

VPanels >= VBattery + VOffset - Active PWM to generate extra current through Q3. 

To make this work you need to be sure that the driver is working even with no PWM signal, at least sufficiently to turn off both Q2 and Q3. This is the same problem I raised in my Question 2 in my original posting.

I think you should not need a diode (or a Q1 either, for that matter). 

Regards,, Keith

  Are you sure? yes | no

keith.hungerford wrote 06/01/2015 at 09:56 point

Hi, I think I don't understand a few things about the interactions between the half-bridge driver IR2104 and the circuit is it embedded in.  One possibility is that you need to feed the battery voltage to the VCC connection of the IR2104. With the existing circuit, if the panel voltage is zero then the IR2104 has no VCC input. This may make its behaviour unpredictable (I don't see that situation covered in the spec sheet, which asks for VCC between 10 and 20 Volts for "proper operation". 

Still thinking about this. You probably have a clearer understanding, and can check actual circuit behaviour.

  Are you sure? yes | no

keith.hungerford wrote 06/01/2015 at 13:11 point

Hi again. I found what I think is a relevant piece of literature on the IRF website at http://www.irf.com/technical-info/appnotes/an-978.pdf. This document has a section titled 10 HOW TO DRIVE A BUCK CONVERTER which explains some more things.

  Are you sure? yes | no

Open Green Energy wrote 06/01/2015 at 17:17 point

Thank You for your help.

Let me do some test and modification in software.Then I will inform you.

  Are you sure? yes | no

Juan Perez Estrada wrote 05/30/2015 at 06:06 point

Hi,

Is there anyone who has checked this MPPT solar charge controller vs a normal PWM with real data ?  I have a litlle solar power system (60W) and I want to do it if I can get more power from my solar panel. I'm used to Arduino, but before buying all components, I want to know about any real data or comparation.

Best regards,

  Are you sure? yes | no

Hacker404 wrote 05/30/2015 at 00:35 point

Battery specifications can be very broad and don't account for any features that may exist with a specific installation so going by the spec sheets is not always the best thing. The best way (most accurate) to measure the charge state of Pb HCl cells is to measure the specific gravity of the fluid with a hygrometer. 

  Are you sure? yes | no

C. Prichard wrote 05/28/2015 at 15:53 point

MPPT payoff may be realized with a large array. 

Off-grid application presents changing battery states as a temporary load such as pumping water may retard the battery, setting it back to a state that requires recovery to accept charging. Recovery depends on extent that the battery supplies power. The controller must stimulate the battery, bring the charge rate back to a safe maximum level. Fifteen minutes recovery seems typical. To diminish the disruptive effect of a temporary load, the array can be increased. Large enough, and the battery will not be reset each time a large temporary load is switched ON.  

Using weighting system to reflect approximate hourly input, it makes sense to turn panels to distribute input, reducing peak power, and maximizing the solar window to 130-140 degrees. Strategy is to maintain bulk PWM charge mode, allowing the pulse width to decrease as a function of having reached maximum charge threshold, and not simply to manage midday protection. I will try this with a 1200-watt array, shifting half the panels 30 degrees east, the other half, 30 degrees west. Midday, there will be a peak, but the array will tend to produce more power to the batteries than it would if the panels were aligned at south.

Do the weighted analysis, and consider how at midday the controller is often protecting the batteries from intense charging. It makes sense to distribute input to the PWM controller.

  Are you sure? yes | no

keith.hungerford wrote 05/29/2015 at 13:11 point

Hi Charles, Can you provide a reference describing the battery behaviour you are talking about? I would like to learn more about this.

I think the main payoffs for using MPPT charge controllers are a) getting the full power available from the solar panel(s); and b) enabling the use of panels designed for grid connect in an off-grid system. Grid connect panels are the main market these days, so economies of scale means the per-watt price is lower than panels designed for an off-grid system.

Your thesis that facing your panels East and West, rather than directly towards the equator, will even out the power flux through the day is correct, and this separation of the panels into two groups may well improve the usability of the power generated by avoiding  making too much power for the battery to absorb in the middle of the day, and generating more power in the early and late parts of the day. This smoothing out does have a cost however. According to my modelling, panels positioned 30 degrees East and West as you propose will generate about 94% of the energy generated through the day by equator-facing panels (ie a loss of 6%). The payoff is a considerably flatter power curve through the day. The flattest possible power curve is obtained with a 60 degrees angle between the midday sun and the panels. At this angle the energy loss is 23 % (production of 77% compared to equator facing panels) but power production is virtually constant from sunrise to sunset. The curve does go up and down a bit but is between 0.4 and 0.5 of the potential peak power through the whole day. The two sets of panels can be run on a single MPPT controller with little if any loss of power, so long as they have the same number of cells in series in each set.

  Are you sure? yes | no

C. Prichard wrote 05/29/2015 at 17:29 point

Midday. Batteries are charging, robust bubbling sound very obvious. Run a heavy load for a few minutes. Batteries become silent. Load switches off, and depending on input from the array, it will take awhile before one can detect robust bubbling. Batteries must return to the state where they can fully accept the charge. Recovery is not instantaneous.

This effect is seen when the load far exceeds input, as in running a pump with 700-watts midday input. Batteries must supply a large portion of the current to the load. The lead-acid battery changes its chemical state.

  Are you sure? yes | no

keith.hungerford wrote 05/29/2015 at 23:02 point

Hi Charles, My interpretation of what you are observing is as follows: 

Midday and batteries bubbling. This bubbling is hydrolysis of the electrolyte, which is what happens when the battery is fully charged so the only place for the current to go is into breaking down water into Hydrogen and Oxygen. 

Applying the load consumes all the current from the panels and also takes some from the batteries (as you said). 

When the load switches off, the current from the panels goes into the batteries and starts to recharge them. It takes a while (as you observe), but after some time the batteries become fully charged and the hydrolysis of electrolyte starts again.

Assuming your batteries are of the Flooded type, there is no serious problem with running the batteries like this, but the hydrolysis does consume water, so it means that you need to top up the electrolyte more often than if you did not have so much hydrolysis. Solar charge controllers (including this MPPT project) usually have a "Float" state for the battery, where the charging voltage is limited to around 13.8 volts. This voltage is intended to be just enough to keep the battery fully charged, while avoiding hydrolysis. 

Useful things you could do are a) check the voltage with a multimeter on your battery when it is bubbling vigorously; and b) check at what time in the day the bubbling starts (indicating how long it is taking for your panels to replace the charge that was used in the previous night). These bits of information will tell you if your current controller is working properly, and how much excess capacity you have in your panels. 

  Are you sure? yes | no

C. Prichard wrote 05/30/2015 at 19:57 point

Batteries are common deep cycle sold in local store for electric trolling motors (fishing.) The bubbling begins in morning with charging and lasts until input drops. Voltage is maintained by the MorningStar 60 AMP PWM controller. A bulk charge mode is used until 14.6 circa charge is detected. Pulsing then begins as it is useful to protect, as well as perform some equalization. Equalization can be programmed to happen automatically once a month, and I then have measured 15.15 volts, and more robust bubbling in my eight batteries configured for 24 volts (4 banks.)

Point here is that the bubbling is NOT indicative of a charged state. It occurs throughout the charge phase as plates/surfaces in the battery interact with the acid.

There is no loss of water consequent of a normal cycle. The batteries are sealed, though water could be checked infrequently.

I guessed, and used a conservative setting, mid-range as offered by the controller for various types of batteries, I have noticed imbalance between high and low side (24v bank) batteries, and seek a way to equalize and maintain equilibrium (both batteries at 14.65 volts or whatever.)

  Are you sure? yes | no

keith.hungerford wrote 05/31/2015 at 10:57 point

Hi Charles, re bubbling, I can only suggest you have a look at some internet resources such as 

Wikepedia  http://en.wikipedia.org/wiki/Lead%E2%80%93acid_battery 

or Battery University  http://batteryuniversity.com/learn/article/charging_the_lead_acid_battery

  Are you sure? yes | no

C. Prichard wrote 06/02/2015 at 14:31 point

Batteries bubble while charging. Result is a differential between two Pb plates. 

  Are you sure? yes | no

C. Prichard wrote 05/29/2015 at 17:33 point

Yes! The modeling you are doing is interesting. I just guessed that trying 30 degrees offset would open the window, with benefits. Going to pulse-mode should preferably be a function of having reached a threshold through flat, even charging.

  Are you sure? yes | no

mooneyj wrote 05/27/2015 at 13:02 point

Thanks for the project, so useful! Could you speculate on the steps required to adapt this design for 50V solar panels? I have a bunch of 'broken' 200W panels which just needed the diodes between the cells replacing. I'd love to build a 50V version of this.

  Are you sure? yes | no

keith.hungerford wrote 05/27/2015 at 23:55 point

Hi Mooneyj, I think the first thing you need to do is assess  your requirements at a system level. Such as how many panels you want to connect, and whether a 12 V battery is the best choice. Typically panels designed for battery systems (off grid) have 36 solar cells giving a MPP voltage of about 18V, while panels designed for grid connect have 60 solar cells giving a MPP voltage of about 30 V. With an MPPT controller either type of panel can be used, and multiple panels can be run in series or parallel. Depending on how many panels you want to use, the power flow could get quite large and so the voltages and currents may be much greater. The extent of modifications will depend on your power requirement, number of panels and their connection, and battery type. 

  Are you sure? yes | no

mooneyj wrote 05/28/2015 at 07:52 point

Hi Keith, thanks for your input. I have 7 panels, so 1.4kW total max output. I'm thinking parallel setup is best; 50V 28A. I imagine a set of buck converters in parallel, controlled by a single arduino should work. Ideally i'd like to start with just 1-2 panels, with the ability to expand the system later on. Is this feasible? Also LiPo battery would be ideal, any advice on integrating a lipo charge controller?

  Are you sure? yes | no

keith.hungerford wrote 05/28/2015 at 13:03 point

Hi Mooneyj, There are lots of issues buried in here. I don't know, but I suspect that 7  converters, one per panel, controlled by a single Arduino, is possible but is not the cheapest solution. It may give you a gradual development path that suits your needs. However when you dig into the design details, you may find that an increased current rating so each converter can handle 2 or 3 or 4 panels, is not much more difficult, which would cut down on some of the other complexities.  

I remain dubious about your panels producing an MPP of 50 Volts and 4 amps. At least we need to know the open circuit voltage provided by the manufacturer, or measured in bright sunlight. The MOSFETs in the reference design have a breakdown voltage of 55 volts, which is likely to be inadequate if your panels produce 50 volts at MPP. Another thing you can do is count the number of cells in one of your panels. Typical solar cells at MPP produce 0.5 volts per cell, implying your panels have 100 cells - a design I have not come across.

There are a number of relatively straightforward changes that go with the higher input voltage and higher panel power capability, including: voltage rating of key components; current ratings of key components; new scale factors in the voltage and current measuring devices; new capacitor and inductor values in the current pathway. These are all straightforward arithmetic exercises. 

As part of the analysis of these changes, I think it would be worthwhile to do some sensitivity analysis on converter efficiency versus cost of parts. There might be some good pay-offs in this space.

The idea of a single Arduino controlling multiple converters raises several issues. There are practical ones like the number of interfaces required (the reference converter uses 3 analogue inputs and 7 digital outputs). No doubt expansion is possible if you want to go down that road. Running one panel per converter does mean you can get performance data for each panel, which may have some interest especially if there are site issues such as shading and panel orientation that you want to explore. However running several panels in parallel on a higher capacity converter is probably cheaper to build and will usually give similar performance. My expectation is that there is no issue with processing power of the Arduino to run multiple MPPT algorithms and PWM outputs simultaneously.

I have no experience with Lithium batteries (other than as a user of cordless drills) so I can't help you there. If you use lead acid batteries, there is a lot of experience around on good charging algorithms. Despite this, the cycle lifetime of lead acid batteries is always disappointing - no more than 800 charge-discharge cycles at a 30% depth of discharge, which is less than 3 years if you are cycling them to this depth every day. LiFePO batteries are supposed to be much better (like, 5000 cycles). NiFe batteries will also provide many many cycles (like, more than 10,000) which equates to a more or less indefinite life.

Please let me know what you think. Keith

  Are you sure? yes | no

keith.hungerford wrote 05/27/2015 at 12:27 point

Hi. Great project, and a good tutorial and documentation chain explaining how the design was done. This project has impelled me to join Hackaday and spend quite a few hours studying this project. I have a few questions.

Q1. This goes to the point made a month or so ago by brucedurant, about how the solar panel sees the controller. The project instructables (as far as I can find) give no information about the sizing of capacitor C1. This is the critical component that addresses the brucedurant question. Look at the solar panel characteristic graph,  which for a given illumination level shows a specific current/voltage curve, and consequent power/voltage curve. With Q2 OFF and Q3 ON, the current from the panel is just going into C1, and the panel voltage is tracking to the right (increasing).  With Q2 ON and Q3 OFF, the current from the panel, and also from C1, is going through Q2 into the inductor L and C2 and thence to charge the battery. The panel voltage is tracking to the left (decreasing). So over a full 20 microsecond cycle, there is a ripple in voltage, current and power generated by the panel. The size of that ripple is a function of C1. There are a number of factors at play here, but the extent to which the ripple takes the average operating point away from the true single Maximum Power Point is one factor in the "efficiency" of the controller.  The bottom line for this question is that it would be nice to see the calculations that led to the selection of C1 = 100 uF. 

Q2. I have been having trouble understanding the need for Q1, or the blocking diode mentioned as being used in a previous design. According to the application notes for the MOSFET driver (IR2104) the Arduino can shut off both MOSFETs using SD, which will prevent any reverse current flow when it is dark. 

Q3. The converter uses a buck converter to generate the 5V power rail for most of the logic components, including the Arduino board. The component list just shows it as "buck converter" with a rating of 3A, but no part number. It is not shown on the overall schema diagram. I would like to know its details. 

Q4. The sizing of L1 and C2, and the clocking frequency of 50 kHz, have been driven by what seems to me are quite reasonable but arbitrary assumptions. The target of this controller is to extract the maximum possible amount of power from our solar panel, taking into account the cost of the controller. It would be nice if the selection of components was directly related to that tension (output vs cost). In the typical buck converter design, the objective is to meet specific output power quality parameters (like ripple and voltage accuracy). In this case of the solar charge controller, it is different. I am not aware of lead acid batteries being fussy about ripple current in charging (maybe they are, this might need some research).

I am sorry if these questions/issues seem a bit picky. I found this project very interesting (I can expand on why another time) and I think the author deserves a lot of credit for it. 

  Are you sure? yes | no

Similar Projects

Does this project spark your interest?

Become a member to follow this project and never miss any updates