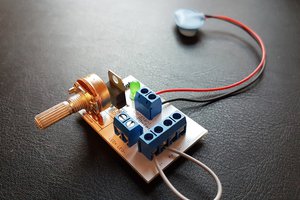
I recently found myself needing to measure response curves for LEDs for one project, and laser diodes for another. Whenever I've done this kind of measurement before, I've always wondered about building a system to automate the painstaking data collection process. So, faced with having to take a bunch of tedious measurements, I'm naturally going to spend twice as long building a system to do it automatically :-)
The system described here will capture the following data:
- I/V curves for LEDs and Laser diodes over currents from 100uA to 1A full-scale ranges
- Relative optical output vs current and forward voltage
- Angular light output distribution
- Lasing threshold (LDs only)
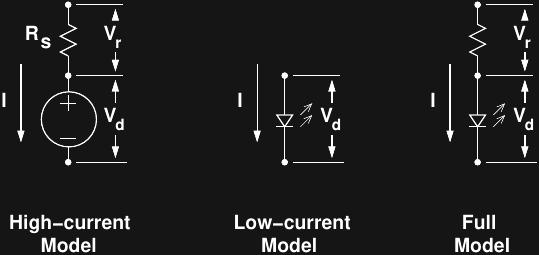
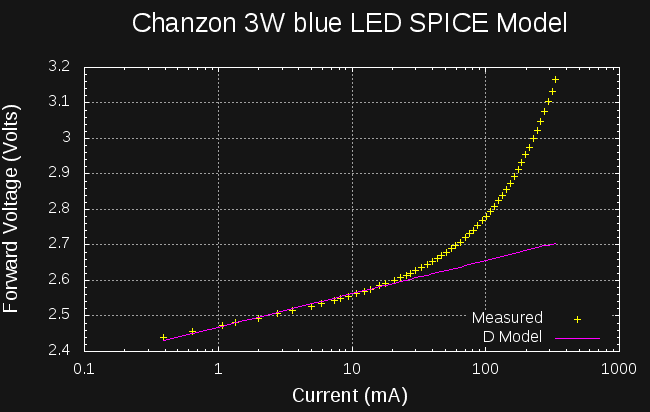
From these measurements, the system can fit the parameters of the Shockley diode equation to generate a SPICE model suitable for DC analysis (although AC and high-speed transient analysis is unlikely to be accurate, since the system won't measure capacitive effects in the diode junction). This data is also sufficient to determine the relative efficiency of devices at different current levels - required if you are trying to build very efficient lighting systems, but rarely, if ever, found on datasheets. Of course, this system could be used to characterize other (non-optical) diodes as well.
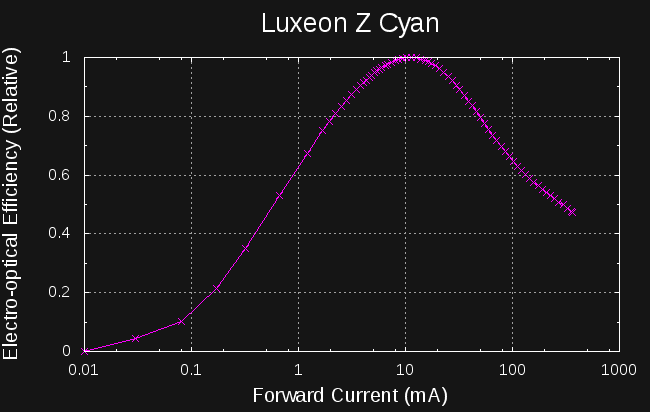
Here are two examples of the type of data I want to automatically collect:
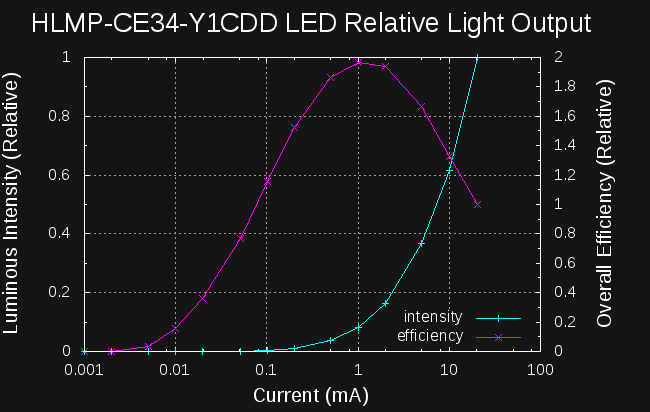
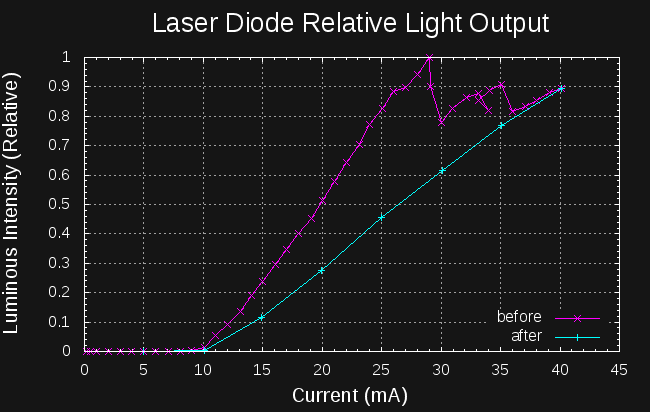
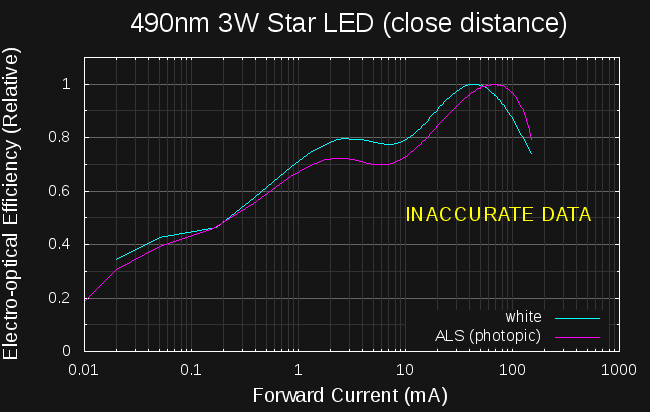
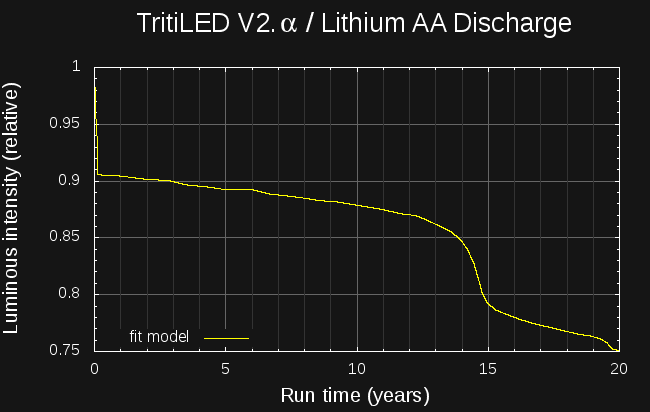
These show data collected manually using the light sensor board: on the left, the peak efficiency point for a cyan LED is easily found (2X as efficient as the recommended operating conditions), while on the right, the lasing threshold and maximum power (before and after over-stress damage) for a destructively-tested cheap ebay laser module is shown. This data is invaluable to a thorough design using these parts, but manual collection of the required data points is extremely tedious; the perfect thing for automatic test equipment.
The missing piece I'd eventually like to include is spectral measurements, but I've decided to postpone this for now.
System Design
Here's a top-level block diagram for the system:
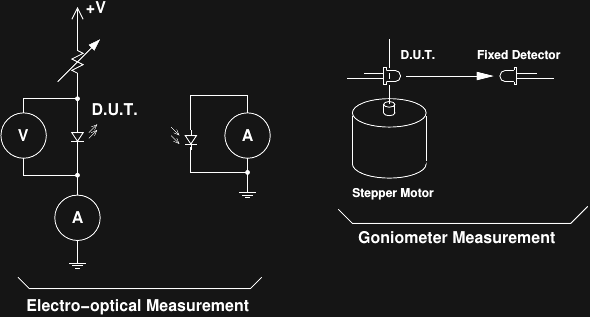
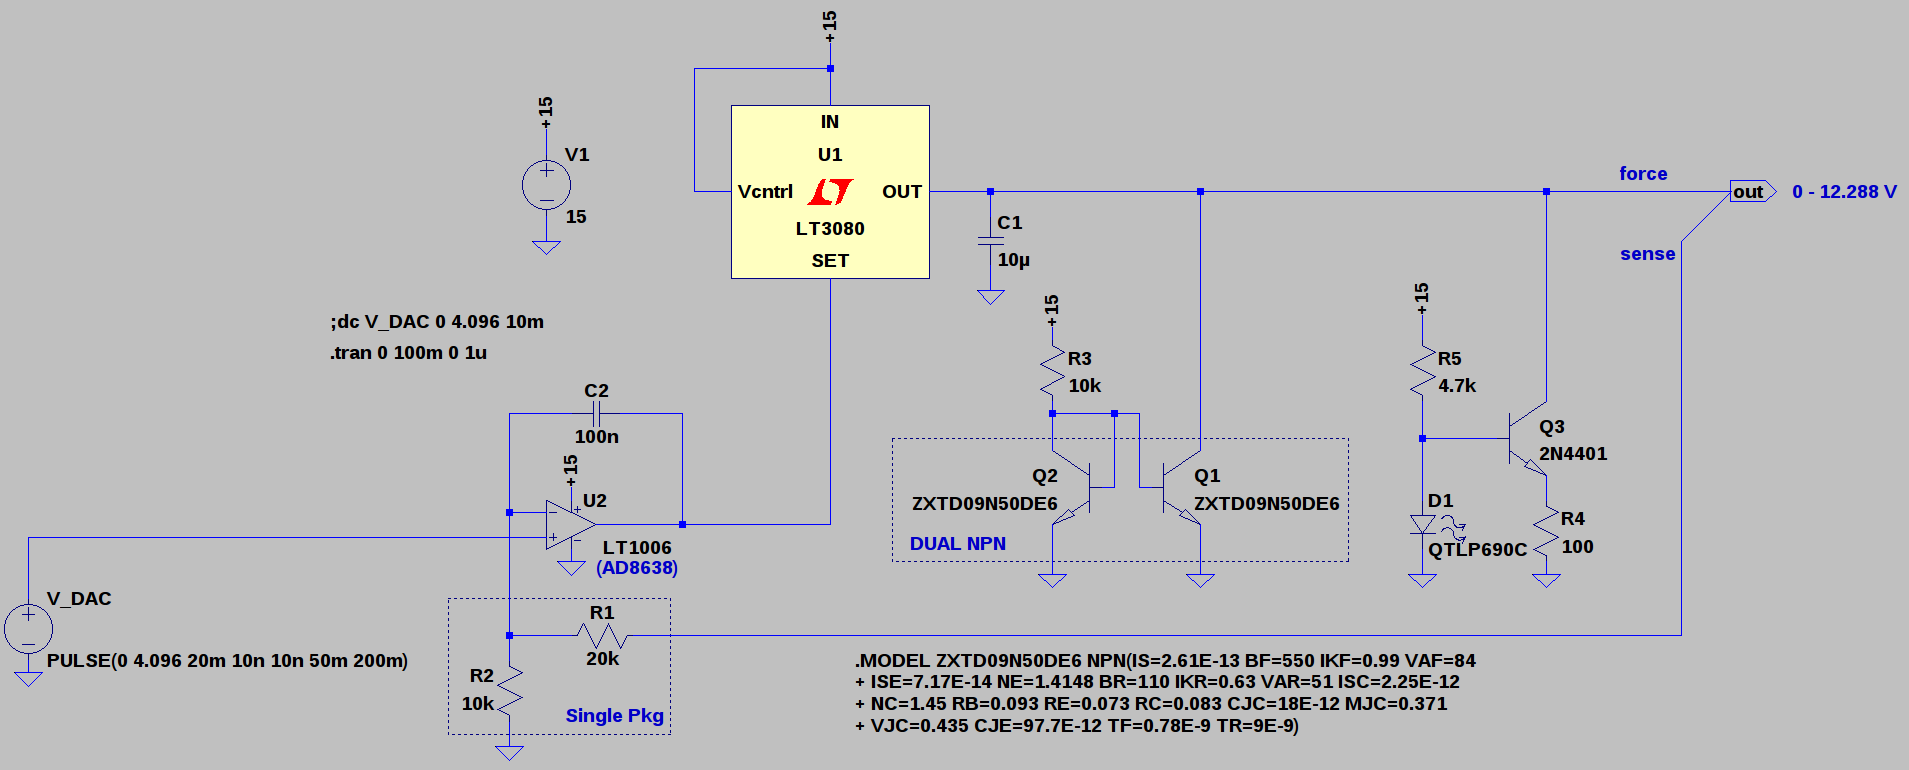
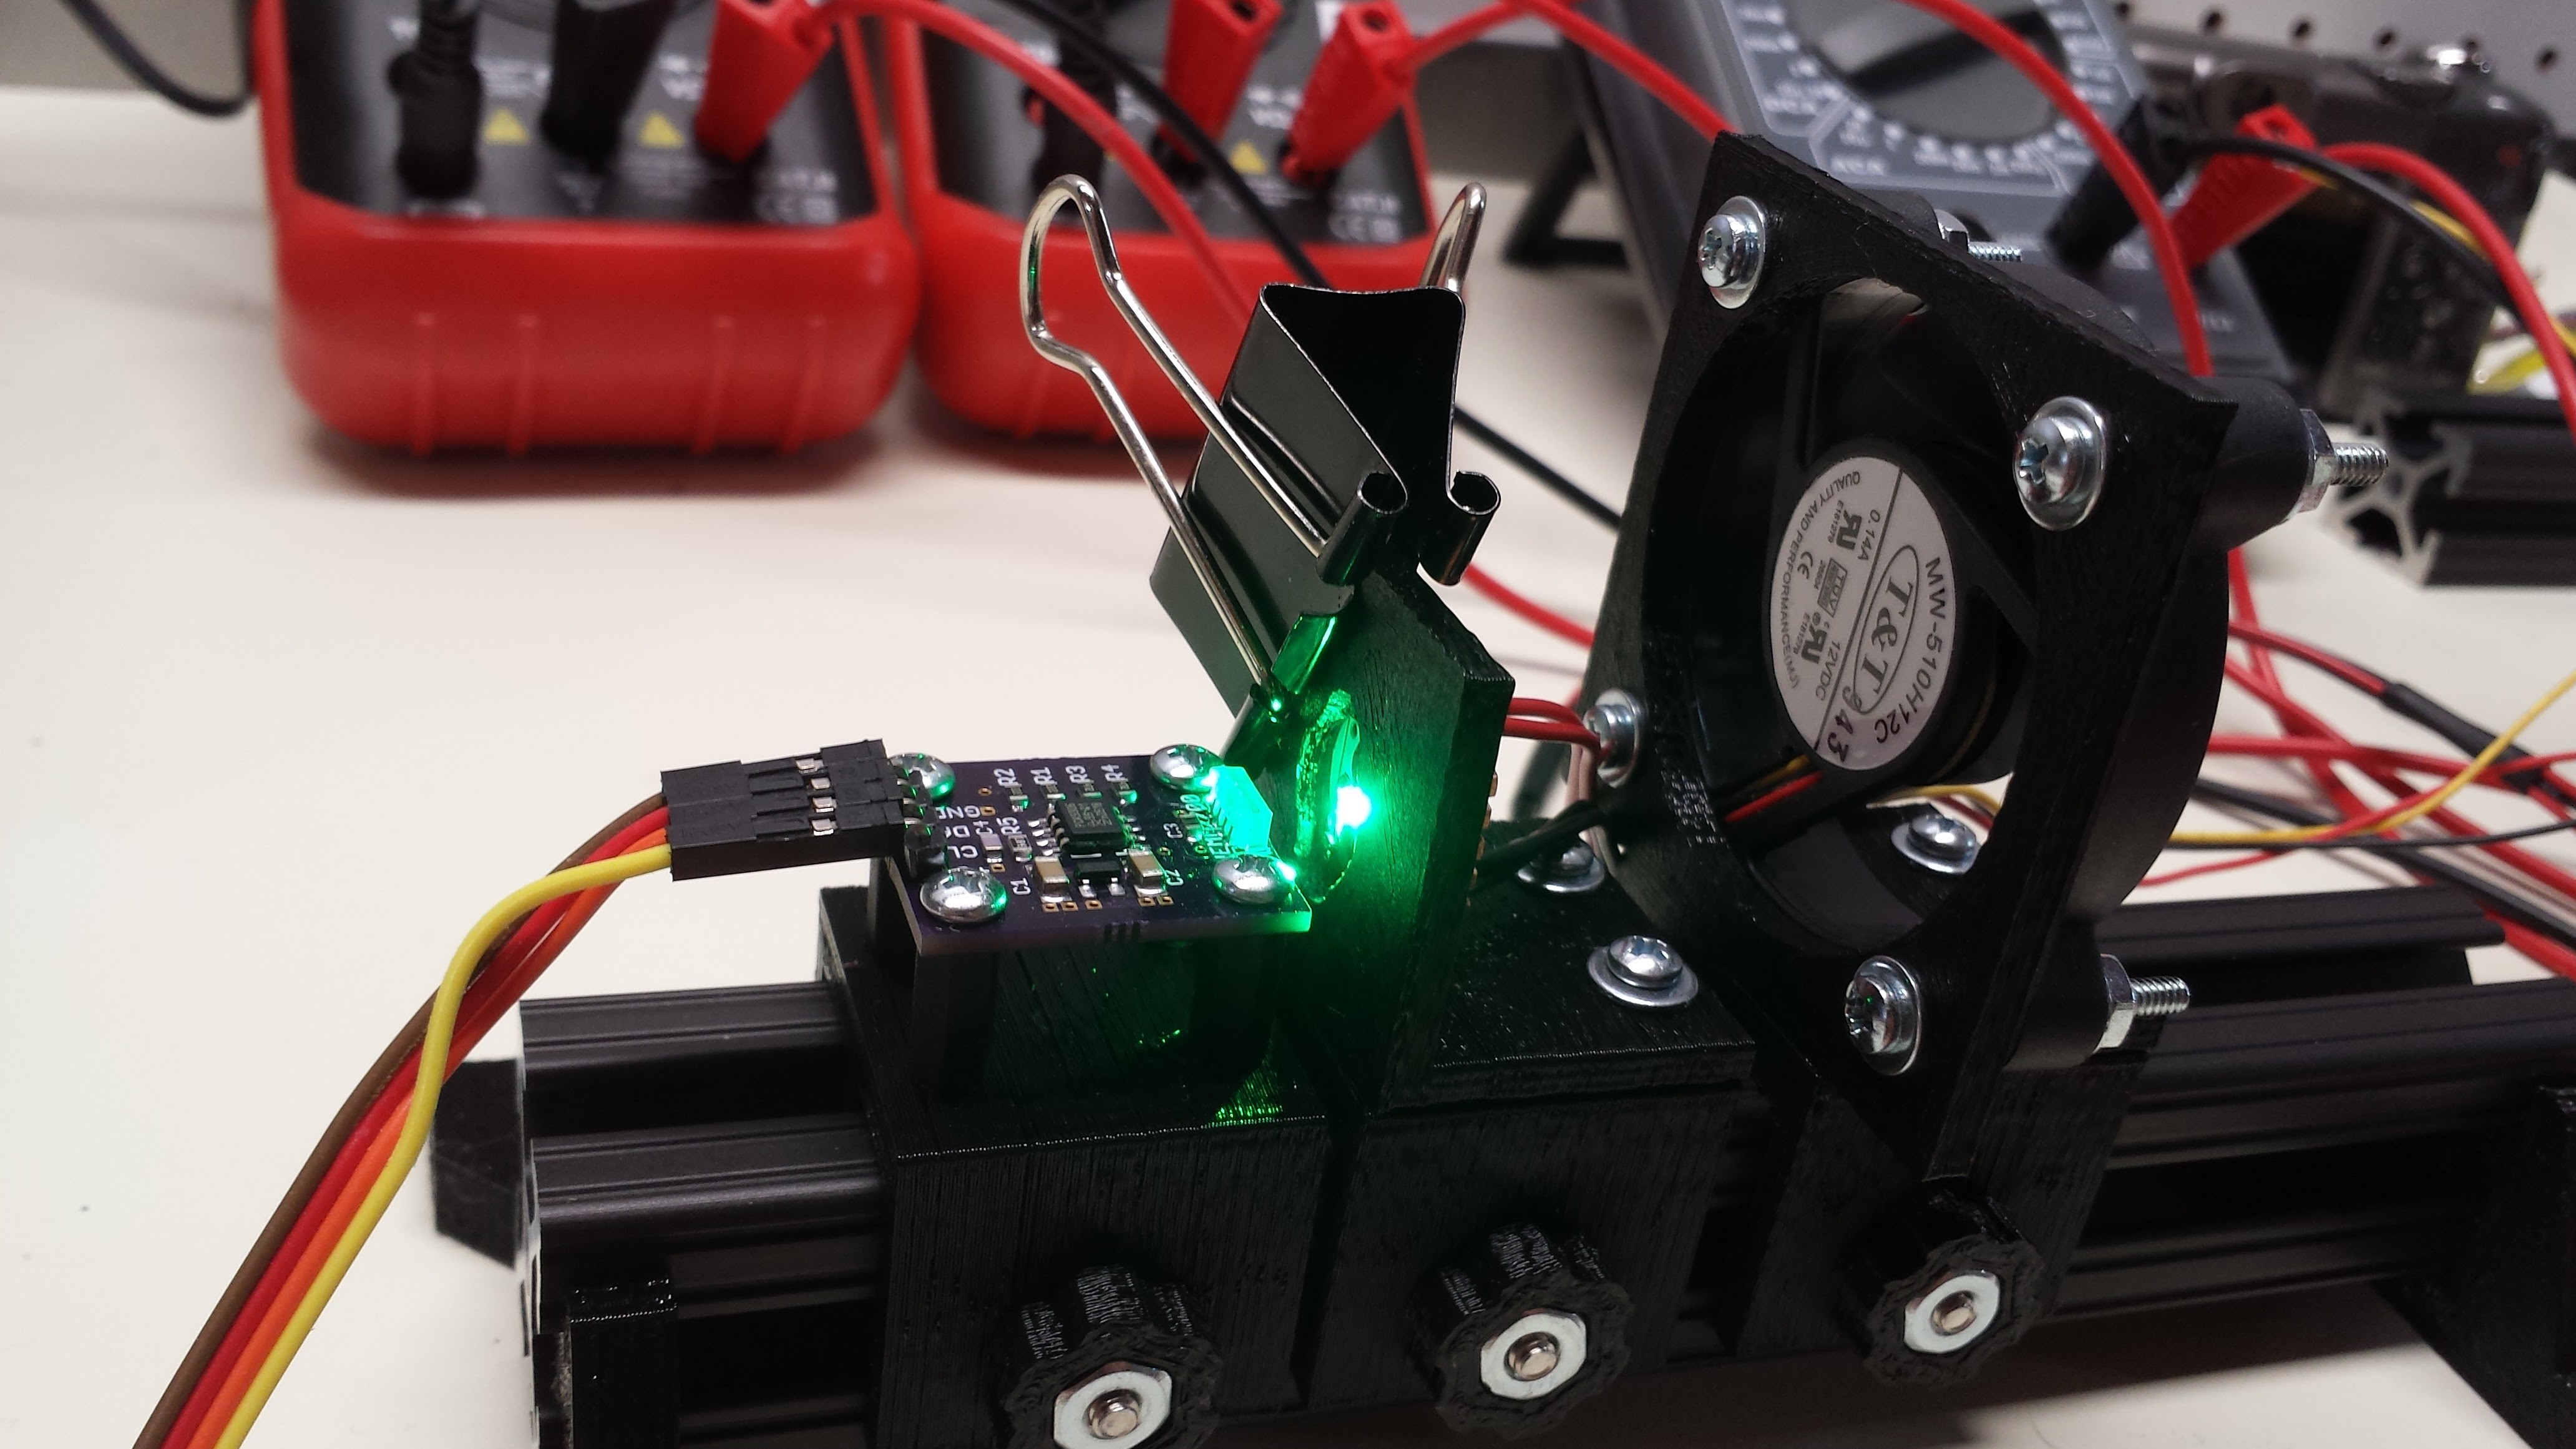
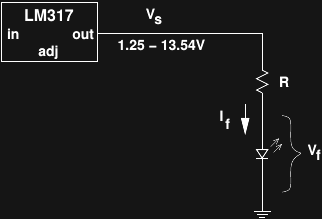
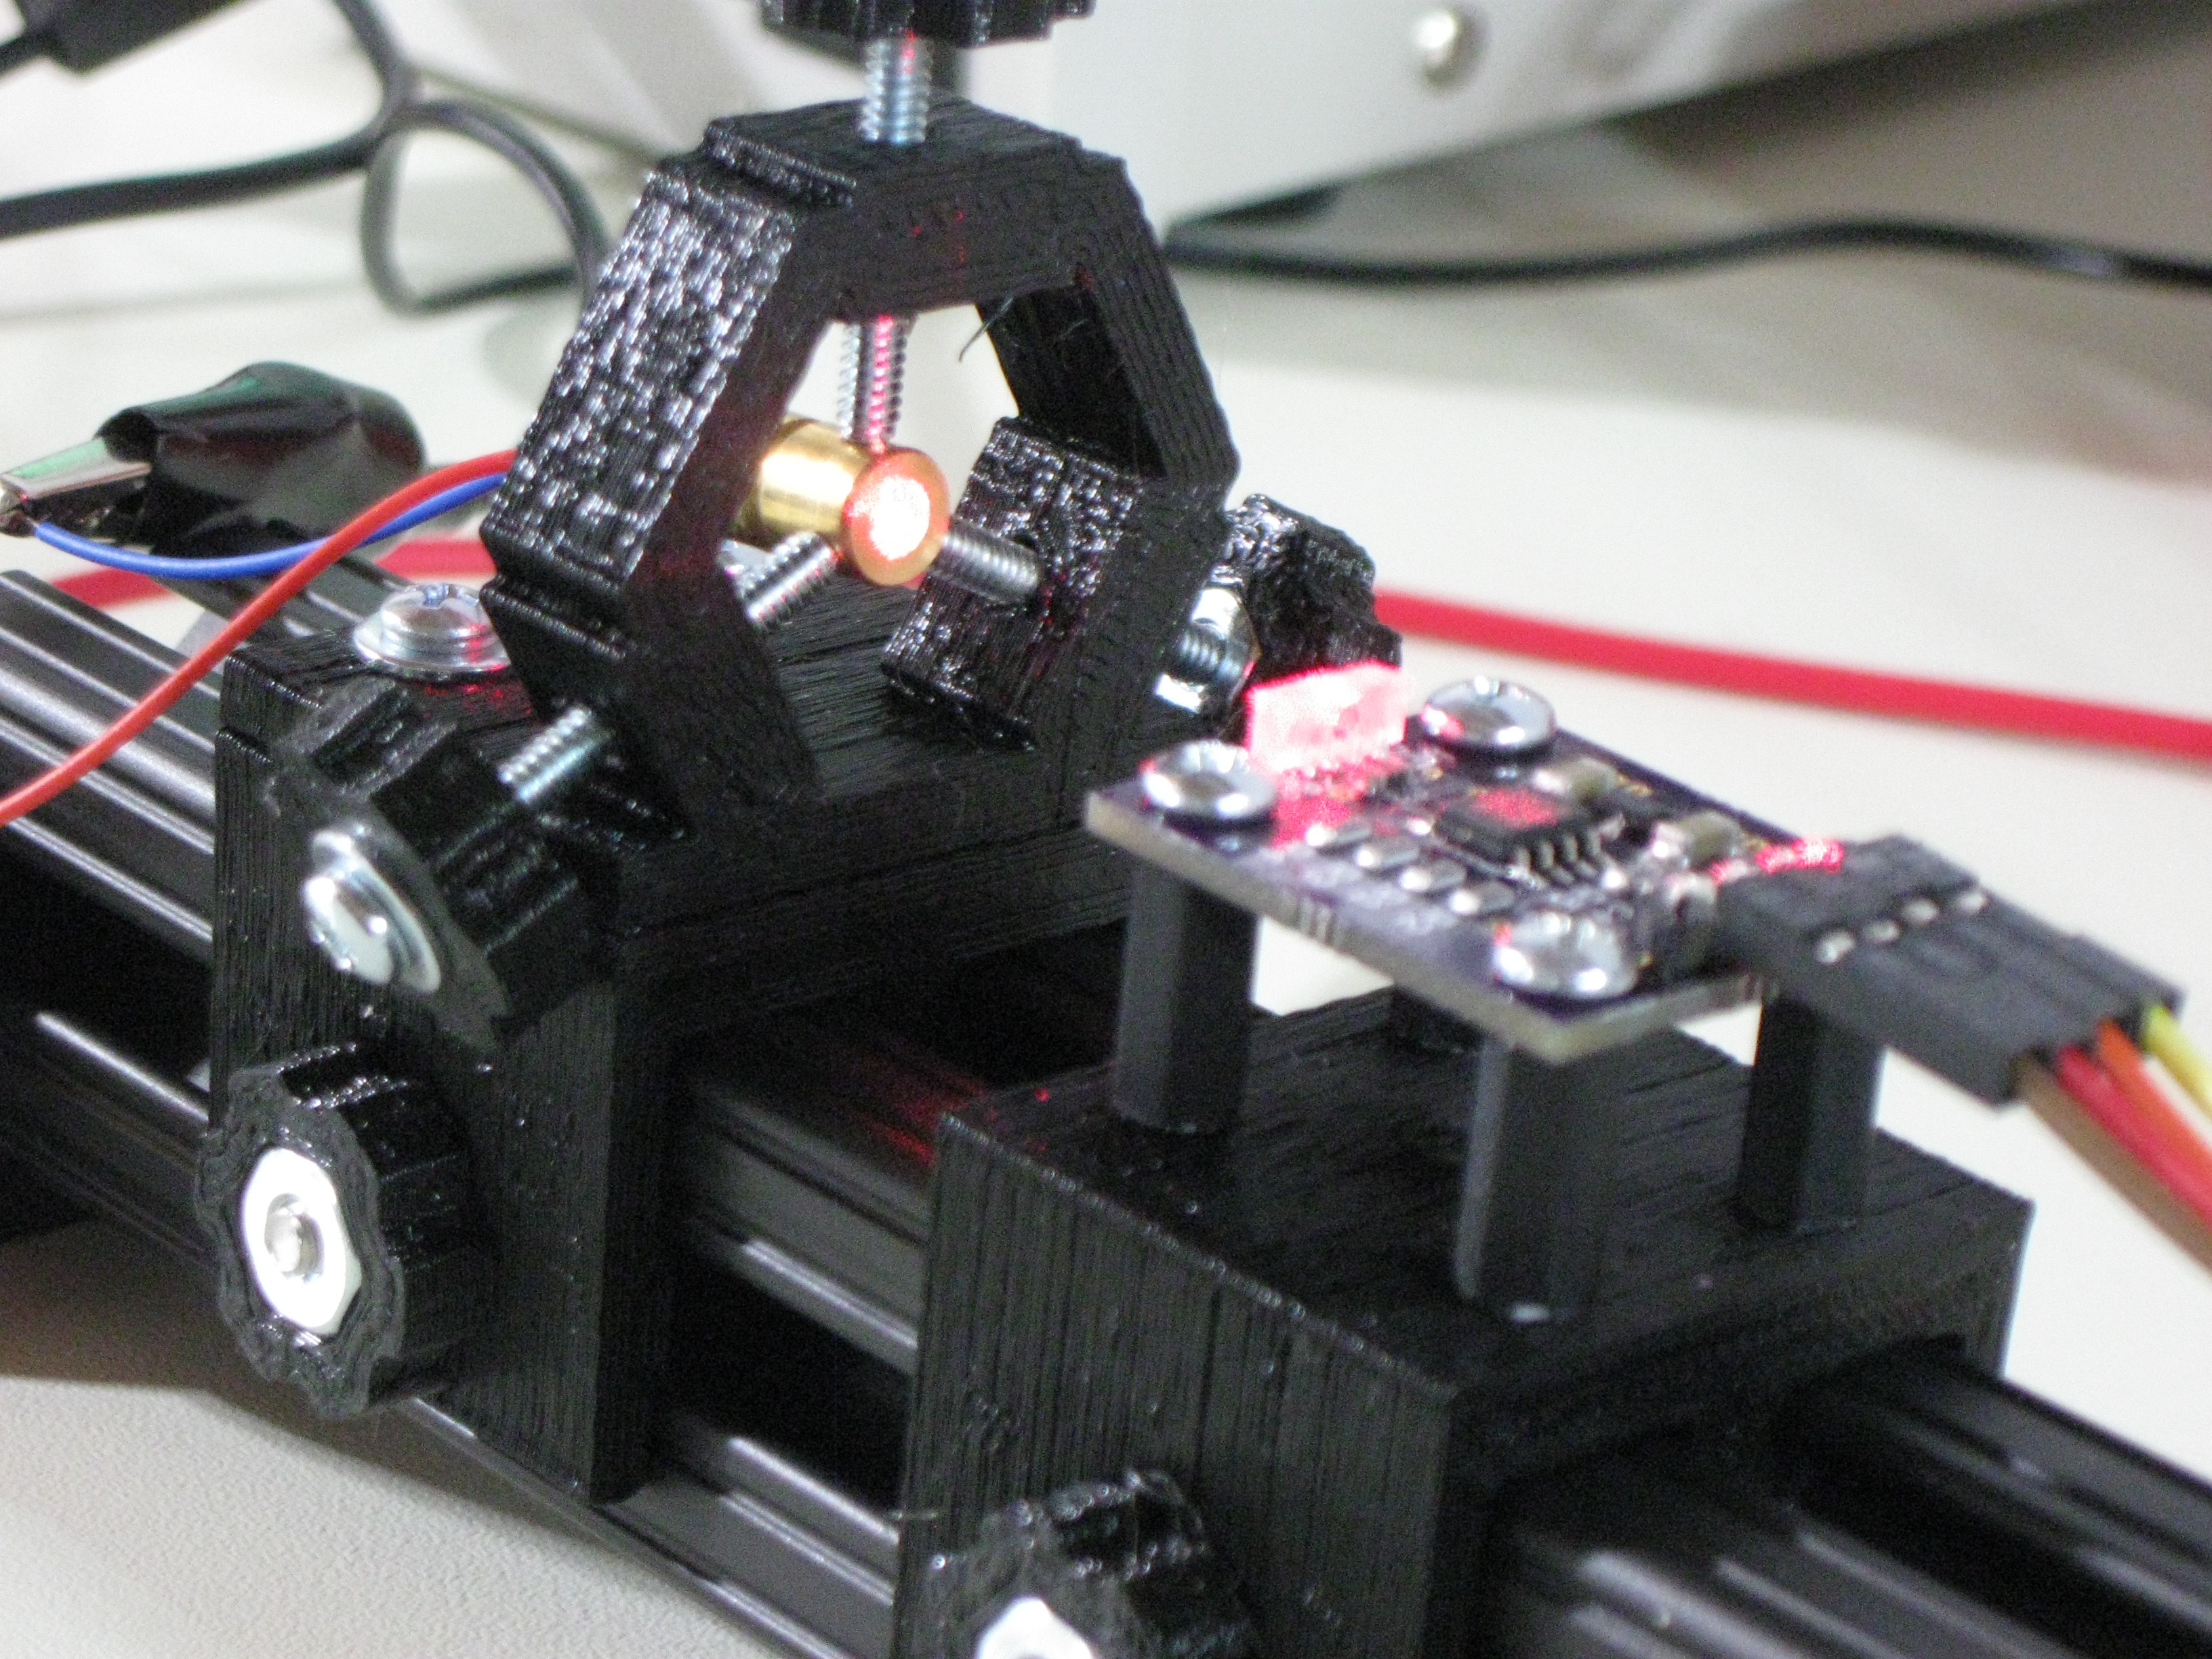
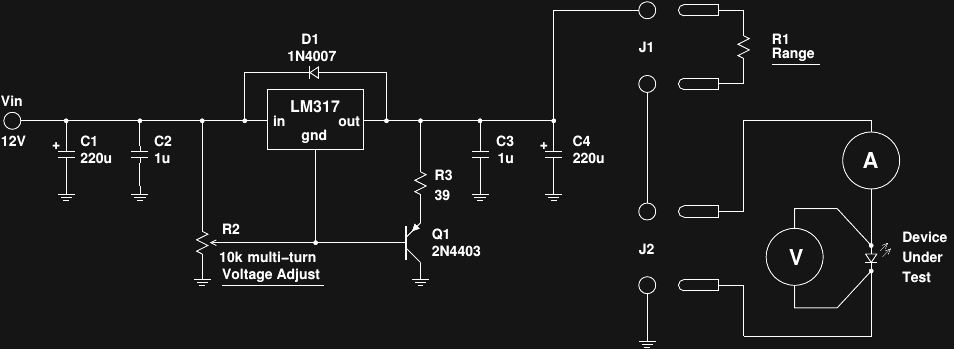
The device-under-test (DUT) is driven by a pseudo current source consisting of a variable voltage and fixed resistor (shown in the diagram as a fixed voltage and variable resistor). The DUT is optically coupled to a linear-response photometer which measures relative light output. As the current through the DUT is swept over adjustable ranges, the exact current through the DUT, the forward voltage drop, and the optical output are recorded. To capture the angular light distribution, a simple goniometer made from an inexpensive geared stepper sweeps the DUT through a series of angles while the received output is recorded. The simple 1-D goniometer planned here will work well for DUTs with radially symmetric output distributions, which covers most devices. For devices with asymmetric output, the DUT can be rotated 90 degreed to capture the distribution along a second axis, which is probably sufficient for most uses. A full 2D goniometer seems too complex for the amount of use it would see in this application.
Current Status
I'm actively developing this project, and will be documenting the progress in the build logs.
 Ted Yapo





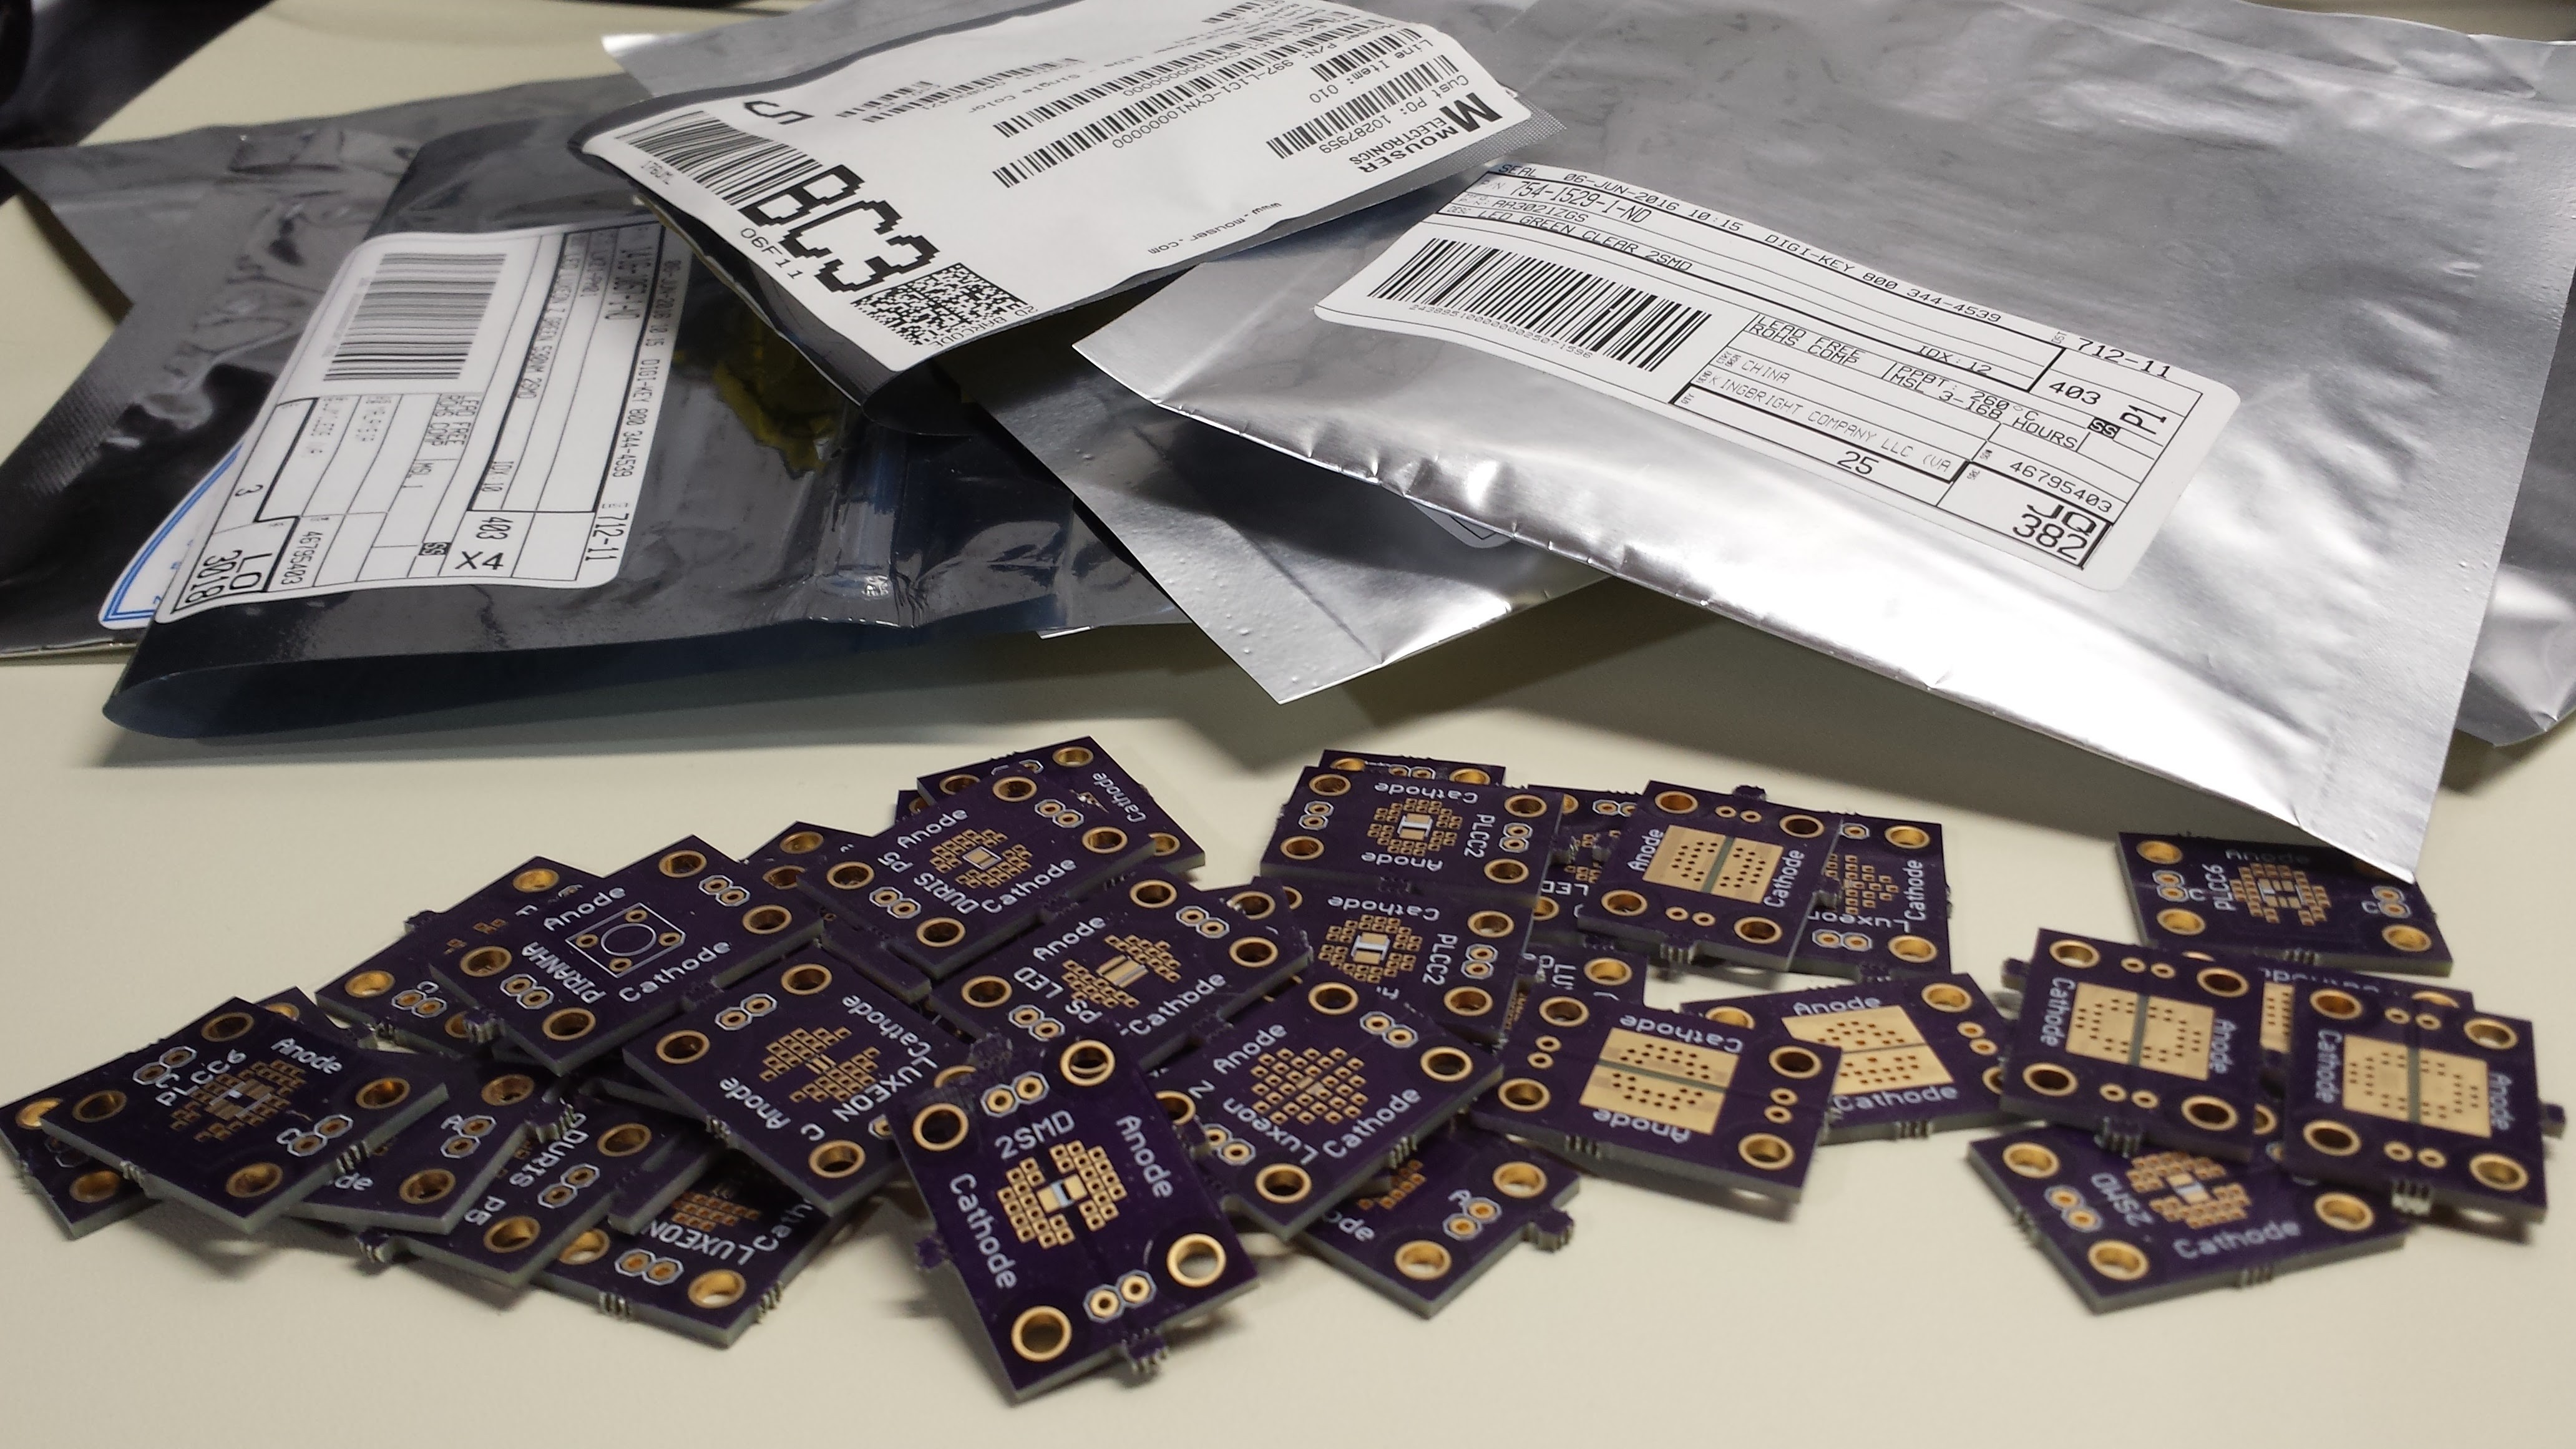
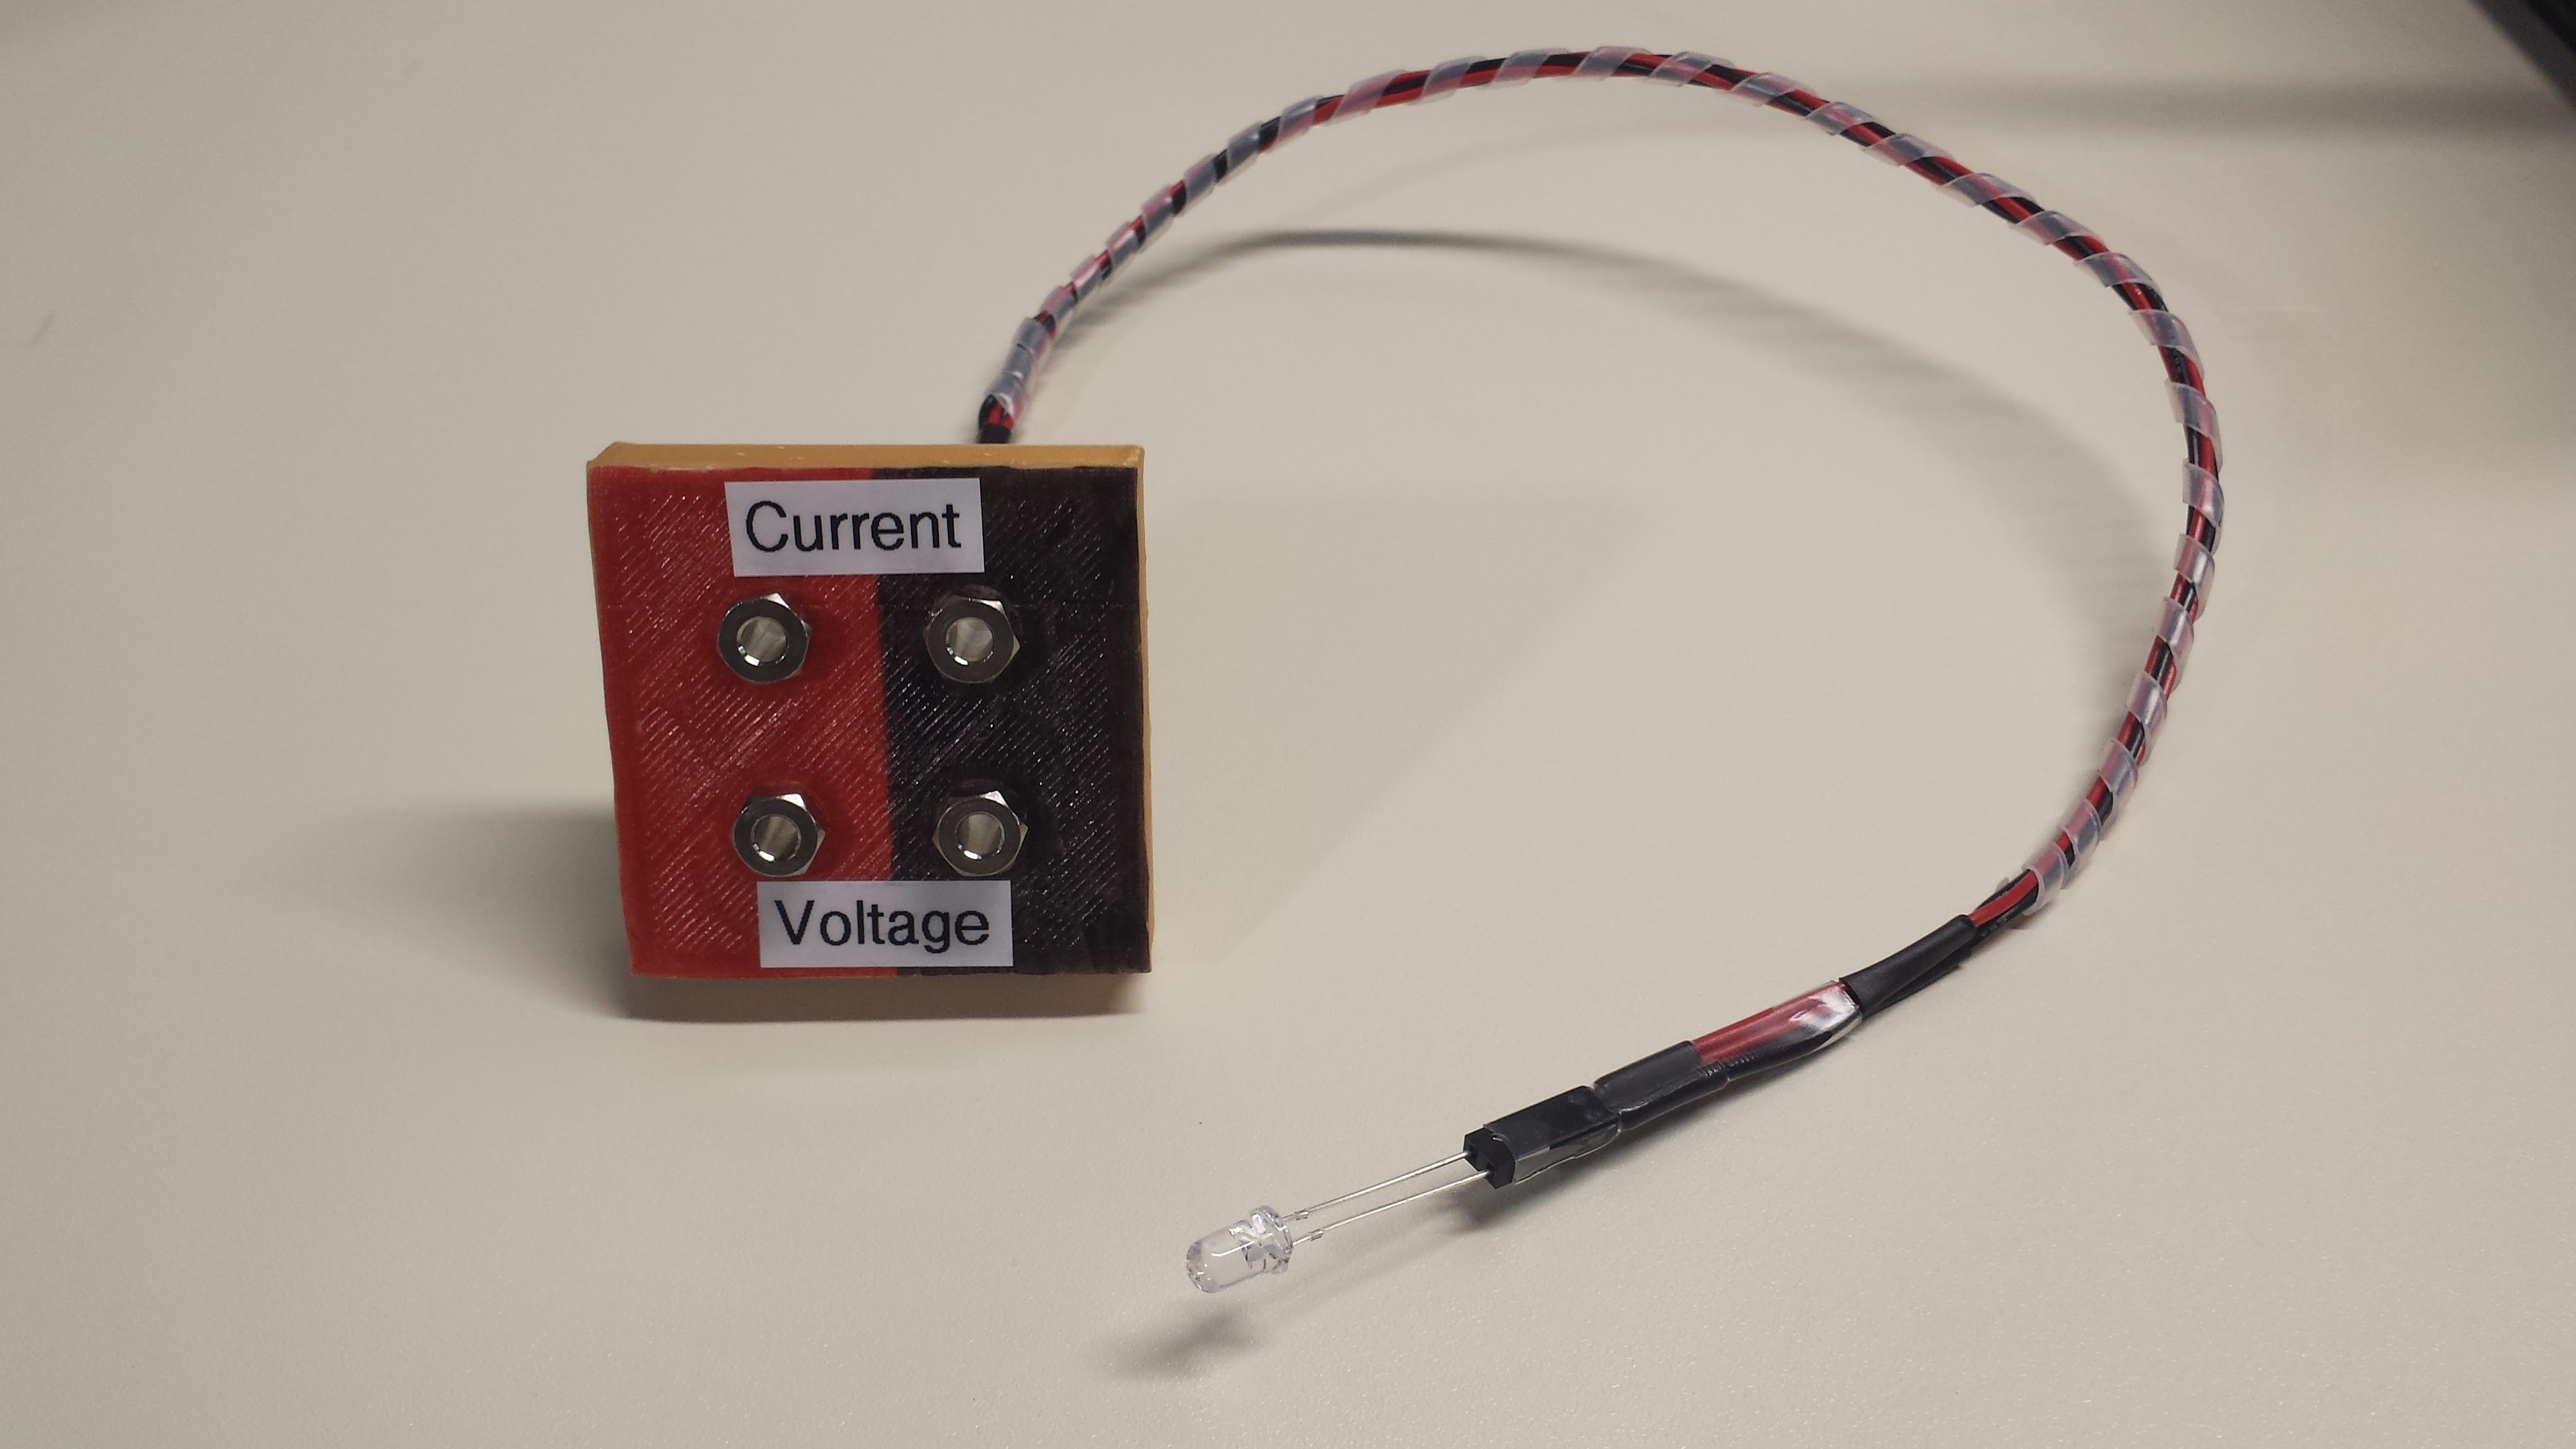
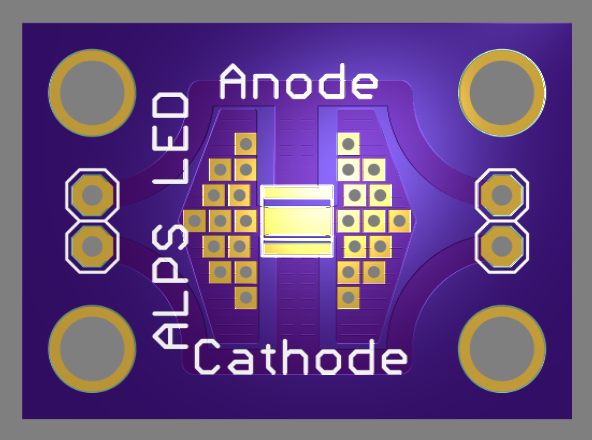
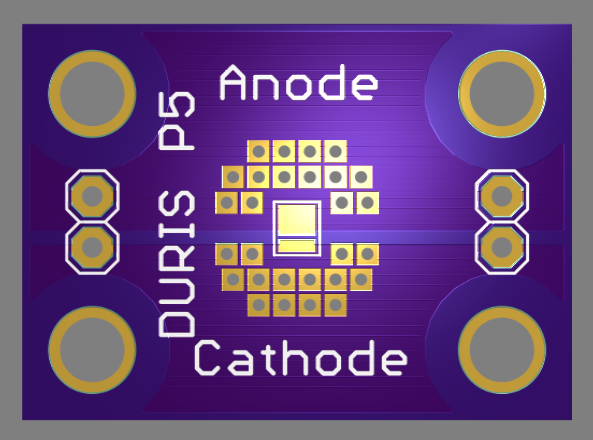
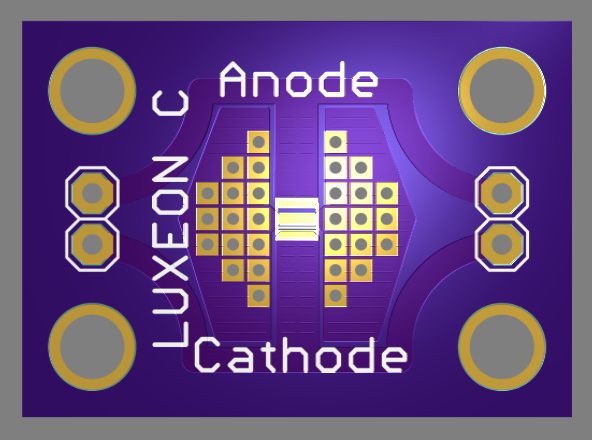
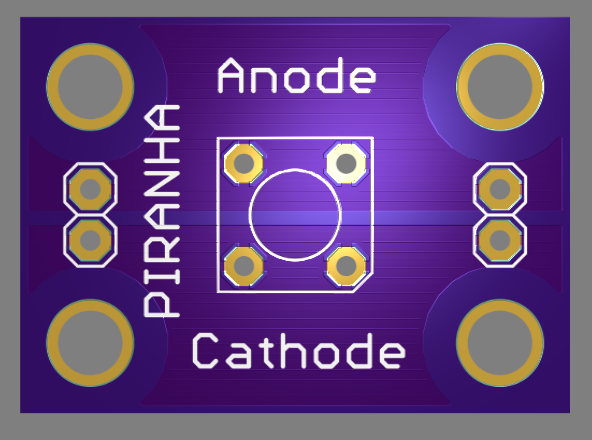
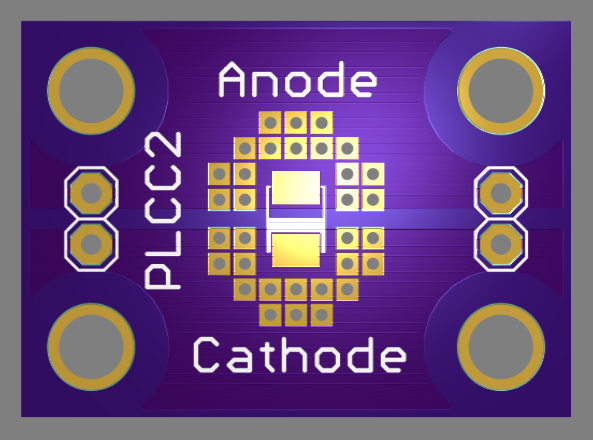
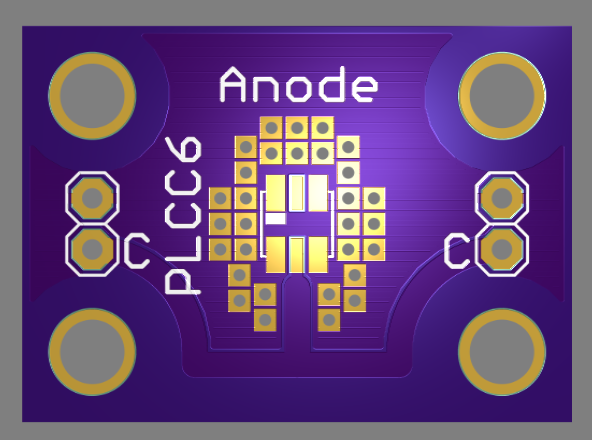
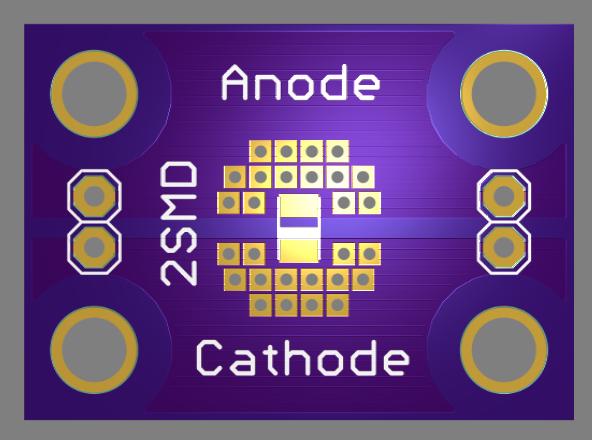
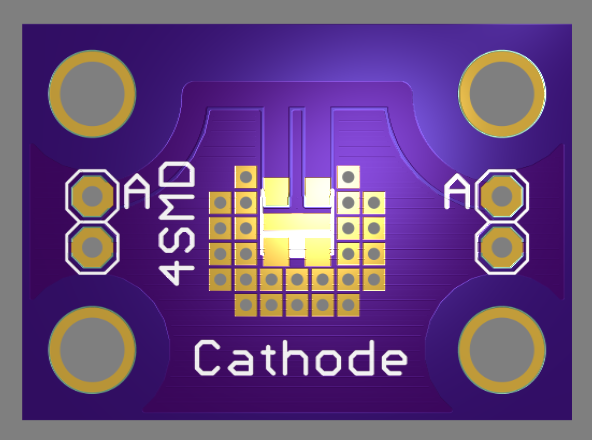
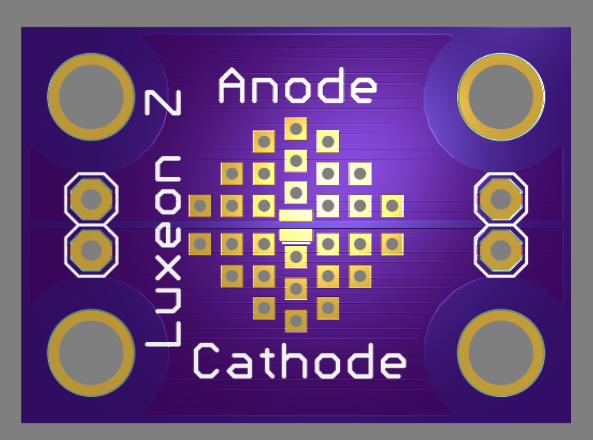 there are two sets of pin headers (left and right) for connections to the voltage and current ports of the analyzer. I'll need to make up another cable.
 Piranha / Super-Flux


 Simon Merrett
 DeepSOIC