-
01/06/2022 Project log entry #7
06/01/2022 at 21:59 • 0 comments# -*- coding: utf-8 -*- ############################################## # QuadMic Test for all 4-Microphones # ---- this code plots the time series for all # ---- four MEMS microphones on the QuadMic # ---- attached to the Raspberry Pi # # -- by Josh Hrisko, Principal Engineer # Maker Portal LLC 2021 # import pyaudio,sys,time import matplotlib matplotlib.use('TkAgg') import numpy as np import matplotlib.pyplot as plt # ############################################## # Finding QuadMic Device ############################################## # def indx_getter(): quadmic_indx = [] for indx in range(audio.get_device_count()): dev = audio.get_device_info_by_index(indx) # get device if dev['maxInputChannels']==2 : print('-'*30) print('Mics!') print('Device Index: {}'.format(indx)) # device index print('Device Name: {}'.format(dev['name'])) # device name print('Device Input Channels: {}'.format(dev['maxInputChannels'])) # channels quadmic_indx = int(indx) channels = dev['maxInputChannels'] if quadmic_indx == []: print('No Mic Found') sys.exit() # exit the script if no QuadMic found return quadmic_indx,channels # return index, if found # ############################################## # pyaudio Streaming Object ############################################## # def audio_dev_formatter(): stream = audio.open(format=pyaudio_format,rate=samp_rate, channels=chans,input_device_index=quadmic_indx, input=True,output_device_index=(0),output=True,frames_per_buffer=CHUNK) # audio stream stream.stop_stream() # stop streaming to prevent overload return stream # ############################################## # Grabbing Data from Buffer ############################################## # def data_grabber(): stream.start_stream() # start data stream channel_data = [[]]*chans # data array [stream.read(CHUNK,exception_on_overflow=False) for ii in range(0,1)] # clears buffer for frame in range(0,int(np.ceil((samp_rate*record_length)/CHUNK))): if frame==0: print('Recording Started...') # grab data frames from buffer stream_data = stream.read(CHUNK,exception_on_overflow=False) data = np.frombuffer(stream_data,dtype=buffer_format) # grab data from buffer stream_listen = stream.write(data) #writting the data allows us to have the microphones' feedback for chan in range(chans): # loop through all channels channel_data[chan] = np.append(channel_data[chan], data[chan::chans]) # separate channels print('Recording Stopped') return channel_data # ############################################## # functions for plotting data ############################################## # def plotter(): ########################################## # ---- time series for all mics plt.style.use('ggplot') # plot formatting fig,ax = plt.subplots(figsize=(12,8)) # create figure ax.set_ylabel('Amplitude',fontsize=16) # amplitude label ax.set_ylim([-2**15,2**15]) # set 16-bit limits fig.canvas.draw() # draw initial plot ax_bgnd = fig.canvas.copy_from_bbox(ax.bbox) # get background lines = [] # line array for updating for chan in range(chans): # loop through channels chan_line, = ax.plot(data_chunks[chan], label='Microphone {0:1d}'.format(chan+1)) # initial channel plot lines.append(chan_line) # channel plot array ax.legend(loc='upper center', bbox_to_anchor=(0.5,-0.05),ncol=chans) # legend for mic labels fig.show() # show plot return fig,ax,ax_bgnd,lines def plot_updater(): ########################################## # ---- time series and full-period FFT fig.canvas.restore_region(ax_bgnd) # restore background (for speed) for chan in range(chans): lines[chan].set_ydata(data_chunks[chan]) # set channel data ax.draw_artist(lines[chan]) # draw line fig.canvas.blit(ax.bbox) # blitting (for speed) fig.canvas.flush_events() # required for blitting return lines # ############################################## # Main Loop ############################################## # if __name__=="__main__": ######################### # Audio Formatting ######################### # samp_rate = 48000 # audio sample rate CHUNK = 12000 # frames per buffer reading buffer_format = np.int16 # 16-bit for buffer pyaudio_format = pyaudio.paInt16 # bit depth of audio encoding audio = pyaudio.PyAudio() # start pyaudio device quadmic_indx,chans = indx_getter() # get QuadMic device index and channels stream = audio_dev_formatter() # audio stream record_length = 30 # seconds to record data_chunks = data_grabber() # grab the data fig,ax,ax_bgnd,lines = plotter() # establish initial plot while True: data_chunks = data_grabber() # grab the data lines = plot_updater() # update plot with new data # Stop, Close and terminate the stream stream.stop_stream() stream.close() audio.terminate()Updates of the previous code :
# Stop, Close and terminate the streamstream.stop_stream()stream.close()audio.terminate()This solves the problem of the code being able to run only one time. So the py was busy because the stream and pyAudio were not closed at least for spyder.
stream = audio.open(format=pyaudio_format,rate=samp_rate,
channels=chans,input_device_index=quadmic_indx,
input=True,output_device_index=(0),output=True,frames_per_buffer=CHUNK)stream_listen = stream.write(data)
By adding the device outpout (headphones plugged) and writting on the stream we can listen to what the microphones are hearing. But there's a lot of latency which is going to be an issue if we want to implement the noise cancelling function. We can also hear clicks. I think it's because the codes is made to stream the audio by recording for 0.1s then stop and record again ect. We hear is cuts in the sound basically.
So when I raise the recording length, it's better but the the graph freezes. Raising the rates from 16000 Hz to 48000 Hz, the frames per buffer from 4000 to 12000 and the recording time from 0.1s to 30s allows the recordings to be more linked. I chose these values because I remember that when I was testing the mic I was at 48000 Hz so I did the ratio to 16000 which gave me 3. Therefore, I multiplied the frames per buffer number by 3. I also realized that you have to keep a ratio of 400 between the recording length and the frames per buffer number to lower the latency.
but if we set the recording length for a high value it is impossible to visualize the wave form in real time.
Since there's already latency in the sound coming through the headphones, we will have to calculate it and and subtract it to pi to have our counter wave. Why not just modify the recording length to de-phase the signal ? In the code the recording length is liked to the reading (microphones) and the writing (headphones) on the stream. So it will affect how the device reads the data from the microphones like we saw earlier.
Next step : noise cancelling (maybe by modifying the stream.write(data) )and adjustments
if you want to see the wave form in real time:
16000 Hz
4000
0.1s
-
01/06/2022 Project log entry #6
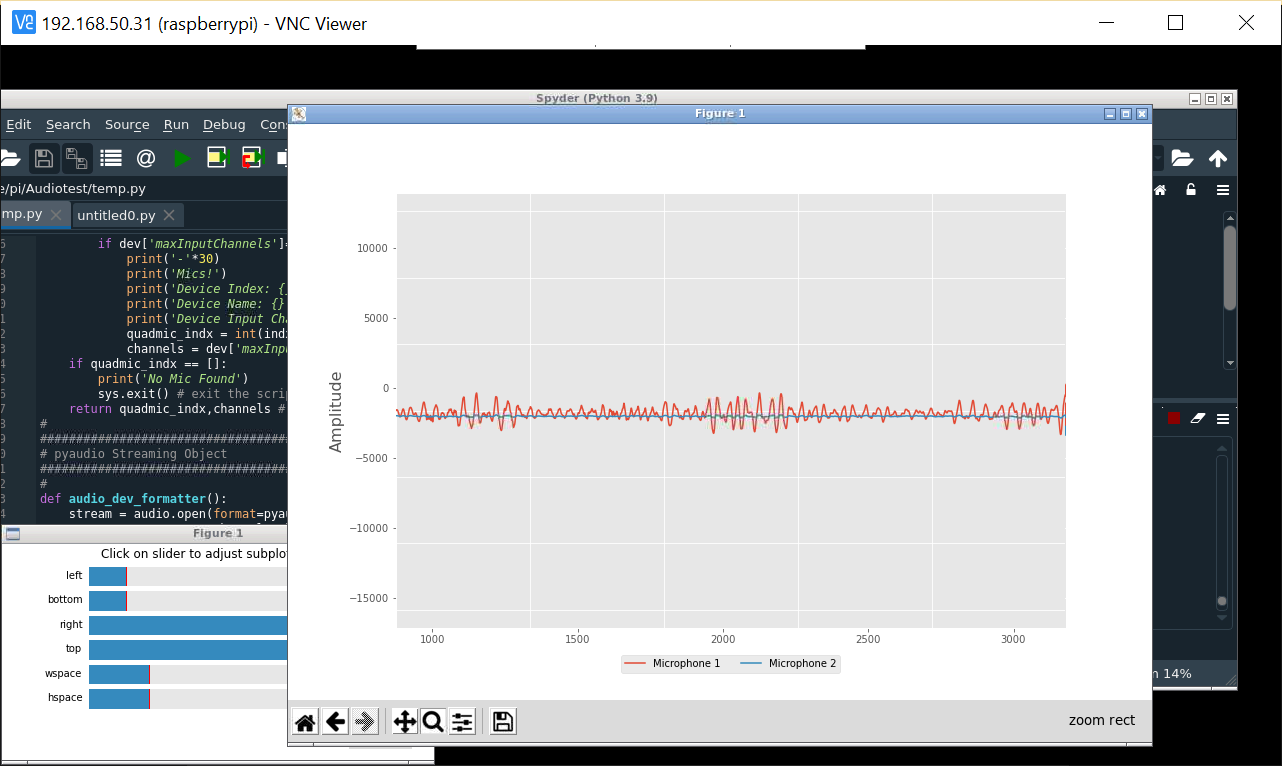
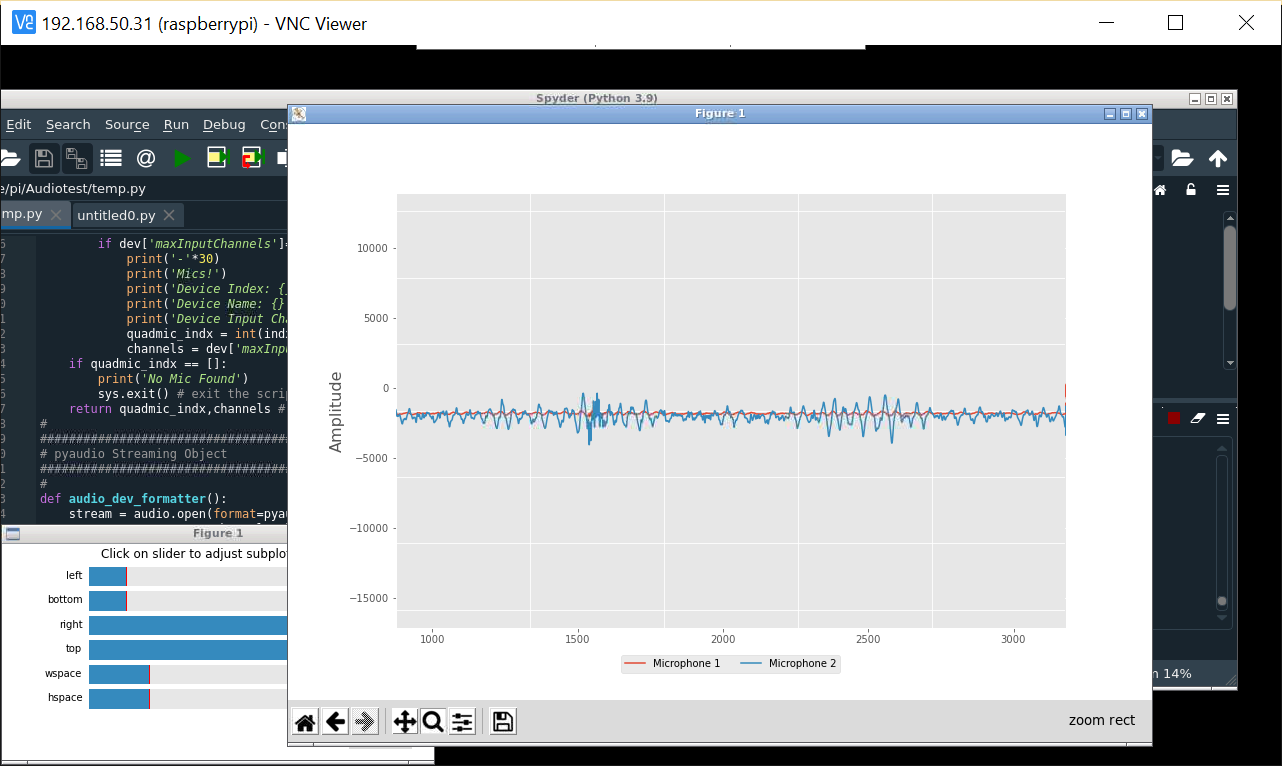
06/01/2022 at 10:02 • 0 commentsThis is the wave form of the sound captured by the microphones. Two colors, two channels, two microphone.
So In the previous log, I talk about different python code that I struggled with. I finally succeed at plotting the wave form with the code that was made for Quadramicrophones. Here it is :# -*- coding: utf-8 -*- ############################################## # QuadMic Test for all 4-Microphones # ---- this code plots the time series for all # ---- four MEMS microphones on the QuadMic # ---- attached to the Raspberry Pi # # -- by Josh Hrisko, Principal Engineer # Maker Portal LLC 2021 # import pyaudio,sys,time import matplotlib matplotlib.use('TkAgg') import numpy as np import matplotlib.pyplot as plt # ############################################## # Finding QuadMic Device ############################################## # def indx_getter(): quadmic_indx = [] for indx in range(audio.get_device_count()): dev = audio.get_device_info_by_index(indx) # get device if dev['maxInputChannels']==2 : print('-'*30) print('Mics!') print('Device Index: {}'.format(indx)) # device index print('Device Name: {}'.format(dev['name'])) # device name print('Device Input Channels: {}'.format(dev['maxInputChannels'])) # channels quadmic_indx = int(indx) channels = dev['maxInputChannels'] if quadmic_indx == []: print('No Mic Found') sys.exit() # exit the script if no QuadMic found return quadmic_indx,channels # return index, if found # ############################################## # pyaudio Streaming Object ############################################## # def audio_dev_formatter(): stream = audio.open(format=pyaudio_format,rate=samp_rate, channels=chans,input_device_index=quadmic_indx, input=True,frames_per_buffer=CHUNK) # audio stream stream.stop_stream() # stop streaming to prevent overloa return stream # ############################################## # Grabbing Data from Buffer ############################################## # def data_grabber(): stream.start_stream() # start data stream channel_data = [[]]*chans # data array [stream.read(CHUNK,exception_on_overflow=False) for ii in range(0,1)] # clears buffer for frame in range(0,int(np.ceil((samp_rate*record_length)/CHUNK))): if frame==0: print('Recording Started...') # grab data frames from buffer stream_data = stream.read(CHUNK,exception_on_overflow=False) data = np.frombuffer(stream_data,dtype=buffer_format) # grab data from buffer for chan in range(chans): # loop through all channels channel_data[chan] = np.append(channel_data[chan], data[chan::chans]) # separate channels print('Recording Stopped') return channel_data # ############################################## # functions for plotting data ############################################## # def plotter(): ########################################## # ---- time series for all mics plt.style.use('ggplot') # plot formatting fig,ax = plt.subplots(figsize=(12,8)) # create figure ax.set_ylabel('Amplitude',fontsize=16) # amplitude label ax.set_ylim([-2**15,2**15]) # set 16-bit limits fig.canvas.draw() # draw initial plot ax_bgnd = fig.canvas.copy_from_bbox(ax.bbox) # get background lines = [] # line array for updating for chan in range(chans): # loop through channels chan_line, = ax.plot(data_chunks[chan], label='Microphone {0:1d}'.format(chan+1)) # initial channel plot lines.append(chan_line) # channel plot array ax.legend(loc='upper center', bbox_to_anchor=(0.5,-0.05),ncol=chans) # legend for mic labels fig.show() # show plot return fig,ax,ax_bgnd,lines def plot_updater(): ########################################## # ---- time series and full-period FFT fig.canvas.restore_region(ax_bgnd) # restore background (for speed) for chan in range(chans): lines[chan].set_ydata(data_chunks[chan]) # set channel data ax.draw_artist(lines[chan]) # draw line fig.canvas.blit(ax.bbox) # blitting (for speed) fig.canvas.flush_events() # required for blitting return lines # ############################################## # Main Loop ############################################## # if __name__=="__main__": ######################### # Audio Formatting ######################### # samp_rate = 16000 # audio sample rate CHUNK = 4000 # frames per buffer reading buffer_format = np.int16 # 16-bit for buffer pyaudio_format = pyaudio.paInt16 # bit depth of audio encoding audio = pyaudio.PyAudio() # start pyaudio device quadmic_indx,chans = indx_getter() # get QuadMic device index and channels stream = audio_dev_formatter() # audio stream record_length = 0.1 # seconds to record data_chunks = data_grabber() # grab the data fig,ax,ax_bgnd,lines = plotter() # establish initial plot while True: data_chunks = data_grabber() # grab the data lines = plot_updater() # update plot with new dataSo I change the original code to be used with 2 microphones. The code allows you to record live. You have to run it on the raspberry desktop via spyder. My issues was that it didn't plot anything and then spyder displayed multiple imports errors. I had already installed the library needed, but I imported them with pip instead of pip3 since I'm running python3. After the import problems were solved, the chart showed up but with no signals. Then the times that I was running the code again nothing was showing and spyder told me that the raspberry was busy. So it's seems like every time I am using node red or spyder the raspberry is said busy but I can't find a way to stream the sound on a terminal.
Anyway later on when I was desperate and retrying everything that I tryied so far, I found out that I can stream with this code just one time every-time the Raspberry is on else it display errors. I also realize that the plotting scale is to high and that I have to put the sound source close to the microphones.
The next step would be to re-calibrate the scale, find a way to amplify the sound with the code and finally reduce the sound live. -
29/05/2022 Project log entry #5
05/29/2022 at 20:35 • 0 commentsI am frustrated.
We were trying to find a way to display sound signals on computer when streaming it. I tried to use python codes on the raspberry screen. One plotted a chart but there was no signal. I assume that it's because I'm failing to let the code acknowledge the microphone or even the raspberry. One of the codes that I found was used for a quadramic, where I thought I just had to change the device name and the number of channels but nooo. For the others I also tried to change the devices and channels and it's a nope.
Yes I tried node-red and it's a no too.
(this photo disappeared lol will re-upload it when I'll be less desperate)
When I used it on the raspberry desktop the terminal was saying that the microphone was silent because the raspberry was busy. So I started node red through ssh communication. You see on the picture that the microphone remain silent when I start streaming. It not, the microphone, not the wiring, I can record easily on a terminal. The mic node that I use is
node-red-contrib-micthat you can find in the library. With this microphone node I can input the recording card which is found typing arecord -l on the terminal. for me It is 1,0 which I indicate with plughw: 1,0 on the microphone properties.
I tried with different type of microphone node did'nt work. One of them saved a recording file in my raspi tough. But when I aplay it it's very short and can't hear anything.
With node-red-contrib-sox-utils :I really tried with a lot of mic node :'''''(.
All of the tutorials on how to use I2S mic with raspi 4 didn't work and there's like two :'( and some forums discussions. I searched and searched and searched nothing. Each time I find a solution there's another problem with the raspberry that I have to google and google and at the end the project is not going anywhere.
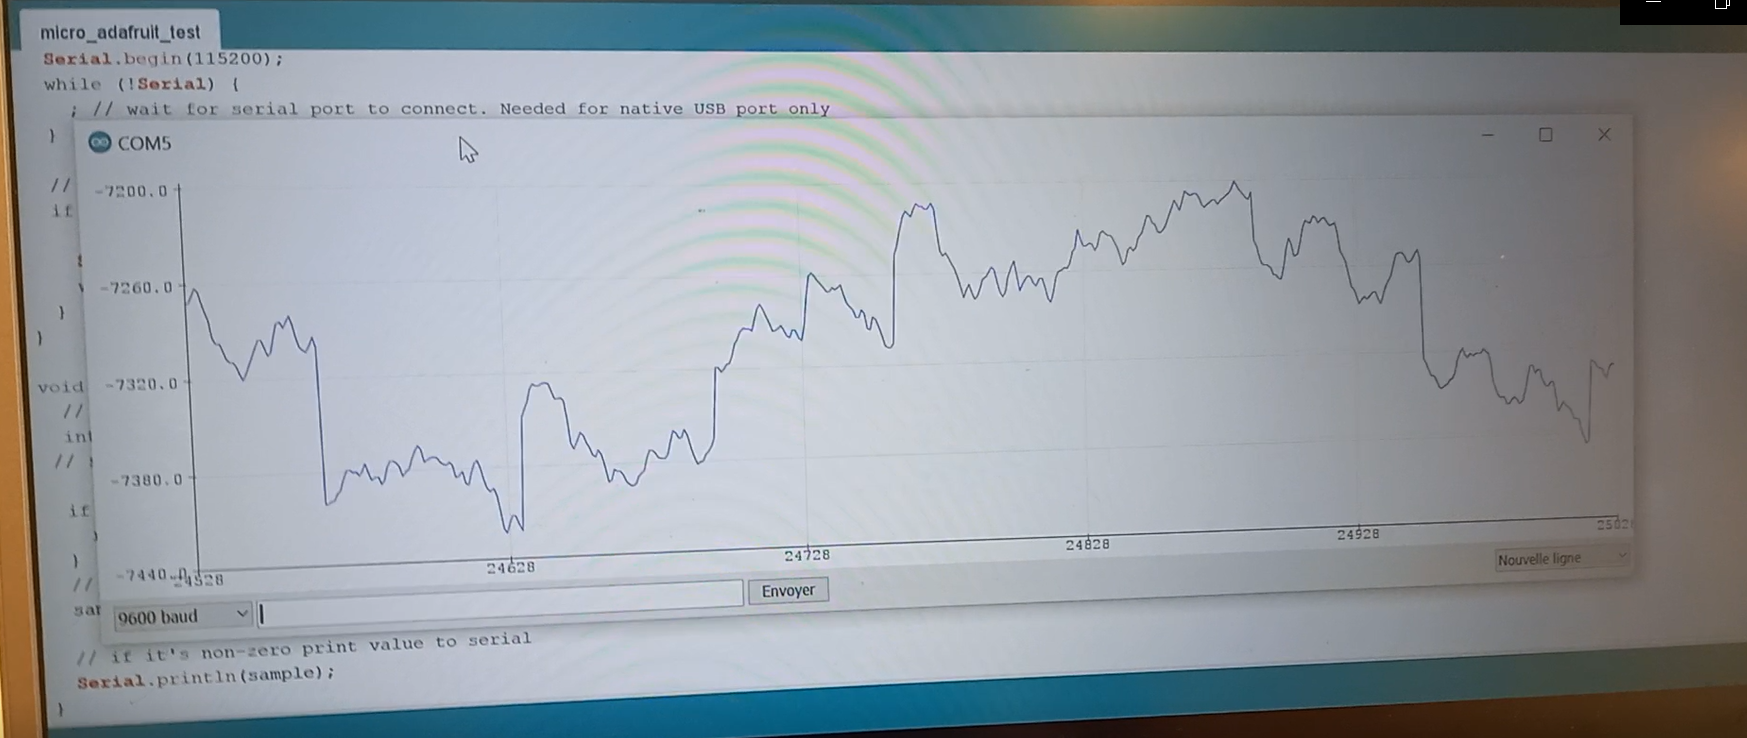
I think I would recommend using Arduino if you want to visualize something without struggling because it's already included in the software. I tried with the adafruit M0 card and here is a signal (me speaking).
-
19/05/2022 Project log entry #4
05/19/2022 at 10:55 • 0 comments19/05/2022
The headphones had STILL NOT ARRIVED.
The app for the earbuds is now finished.
After struggling a little bit, we succeed at making the microphones work. We soldered the mics pins. Now we are trying to find a way to visualize audio signals. We tried to have access to the raspberry pi screen via vnc but the screen is blank black and we can just run one application at a time. We manage to download spyder on raspberry and are currently trying to display the graphics on there.
-
12/05/2022 Project log entry #3 sequel - Connexion problem solved
05/12/2022 at 23:00 • 0 commentsSo we previously couldn't connect the raspberry pi to my computer.
Problems/Solutions :
Pb: the raspberry couldn't connect to my 4G when the connection file was in the ssh folder created at the sd card root.
S: I put the file directly in the sd card root
Pb : When connected to 4G, the raspberry wouldn't connect to the computer. The connection wasn't allowed. When it was allowed the raspberry default password didn't work.
S: I directly configured the wifi when enabling ssh on Raspberry Imager (when you install all the files on the sd card aka when you're flashing). I also chose a user name and a password for the raspberry (still at the flashing stage). The new imager version requires that now. /!\ Apparently, you still have to put the wifi connection file on the sd after flashing it this way.
Pb : the connection would time out
S : Your pc and rby might not be on the same wifi, or you have bad connection.
Pb : a lot of command that I found on internet where in linux and not window langage, plus my ubuntu didn't no matter even after re downloading 234655 times on internet or the windows store.
S: Just follow this https://codedesign.fr/tutorial/wsl2-linux-sous-windows/ it's how to install it via the windows shell
-
12/05/2022 Project log entry #3
05/12/2022 at 10:41 • 0 comments12/05/2022
The headphones that we ordered had still not arrived.
Meanwhile, we’ve continued trying to connect the Raspberry Pi to a computer and a phone. We also made good progress on designing an app for a phone through the help of the web site Glide. This app will have all functionalities necessary for the user.
-
05/05/2022 Project log entry #2
05/05/2022 at 10:45 • 0 comments05/05/2022
The road making of the project was produced.
We received the microphones and started wiring it with the Raspberry Pi. We also started looking for a SHELL code to use for the making of the app.
-
21/04/2022 Project log entry #1
04/21/2022 at 10:33 • 0 comments21/04/2022
We created the hackaday page for the project. The schematics and components were immediately added.
Half of the group worked on defining our user's persona model in order to better figure out the needs our project should solve. This process is to be completed by the next session.
Meanwhile the others were figuring out how the Node Red (the control interface for the Raspberry Pi) operates and started to test a few configurations.
Smart earbuds
The stmart earbuds are earbuds that helps you prevent ear damage for artists and staff on stage

 This is the wave form of the sound captured by the microphones. Two colors, two channels, two microphone.
  I really tried with a lot of mic node :'''''(.