Concept
The basic idea is to use a cheap 3-axis magnetometer (aka compass) sensor to sample the magnetic field vector, B, at a number of 3D positions within a volume, then use interpolation to estimate the field in between these positions. An off-the-shelf 3D printer is used to scan the sensor through the volume. The scanning program uses vanilla g-code commands suitable for any industry-standard printer. Compensation for external fields, such as those produced by our planet or stepper motors within the printer can be made one of two ways. For permanent magnets, an initial baseline scan can be made without the target, then the results subtracted from the actual scan. In the case of electromagnetic targets, taking two data points at each position - one with the current on, and one off - achieves the same goal. A number of different visualizations can then provide an interactive exploration of the field. Using python for the scanning app and WebGL for the visualization should provide a relatively platform-independent experience.
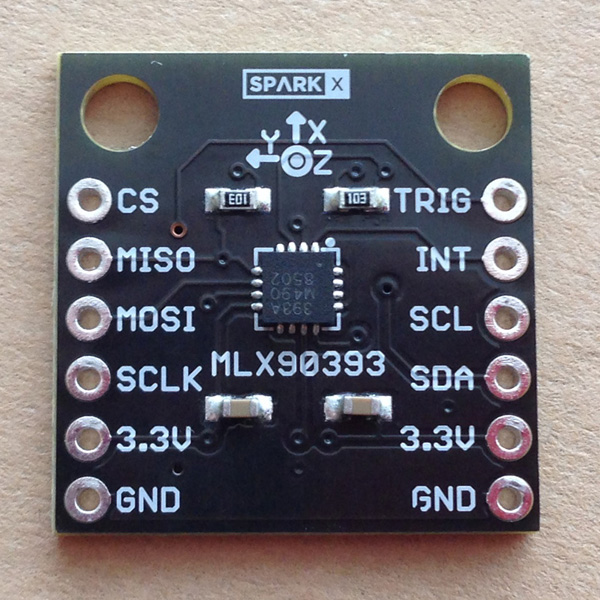
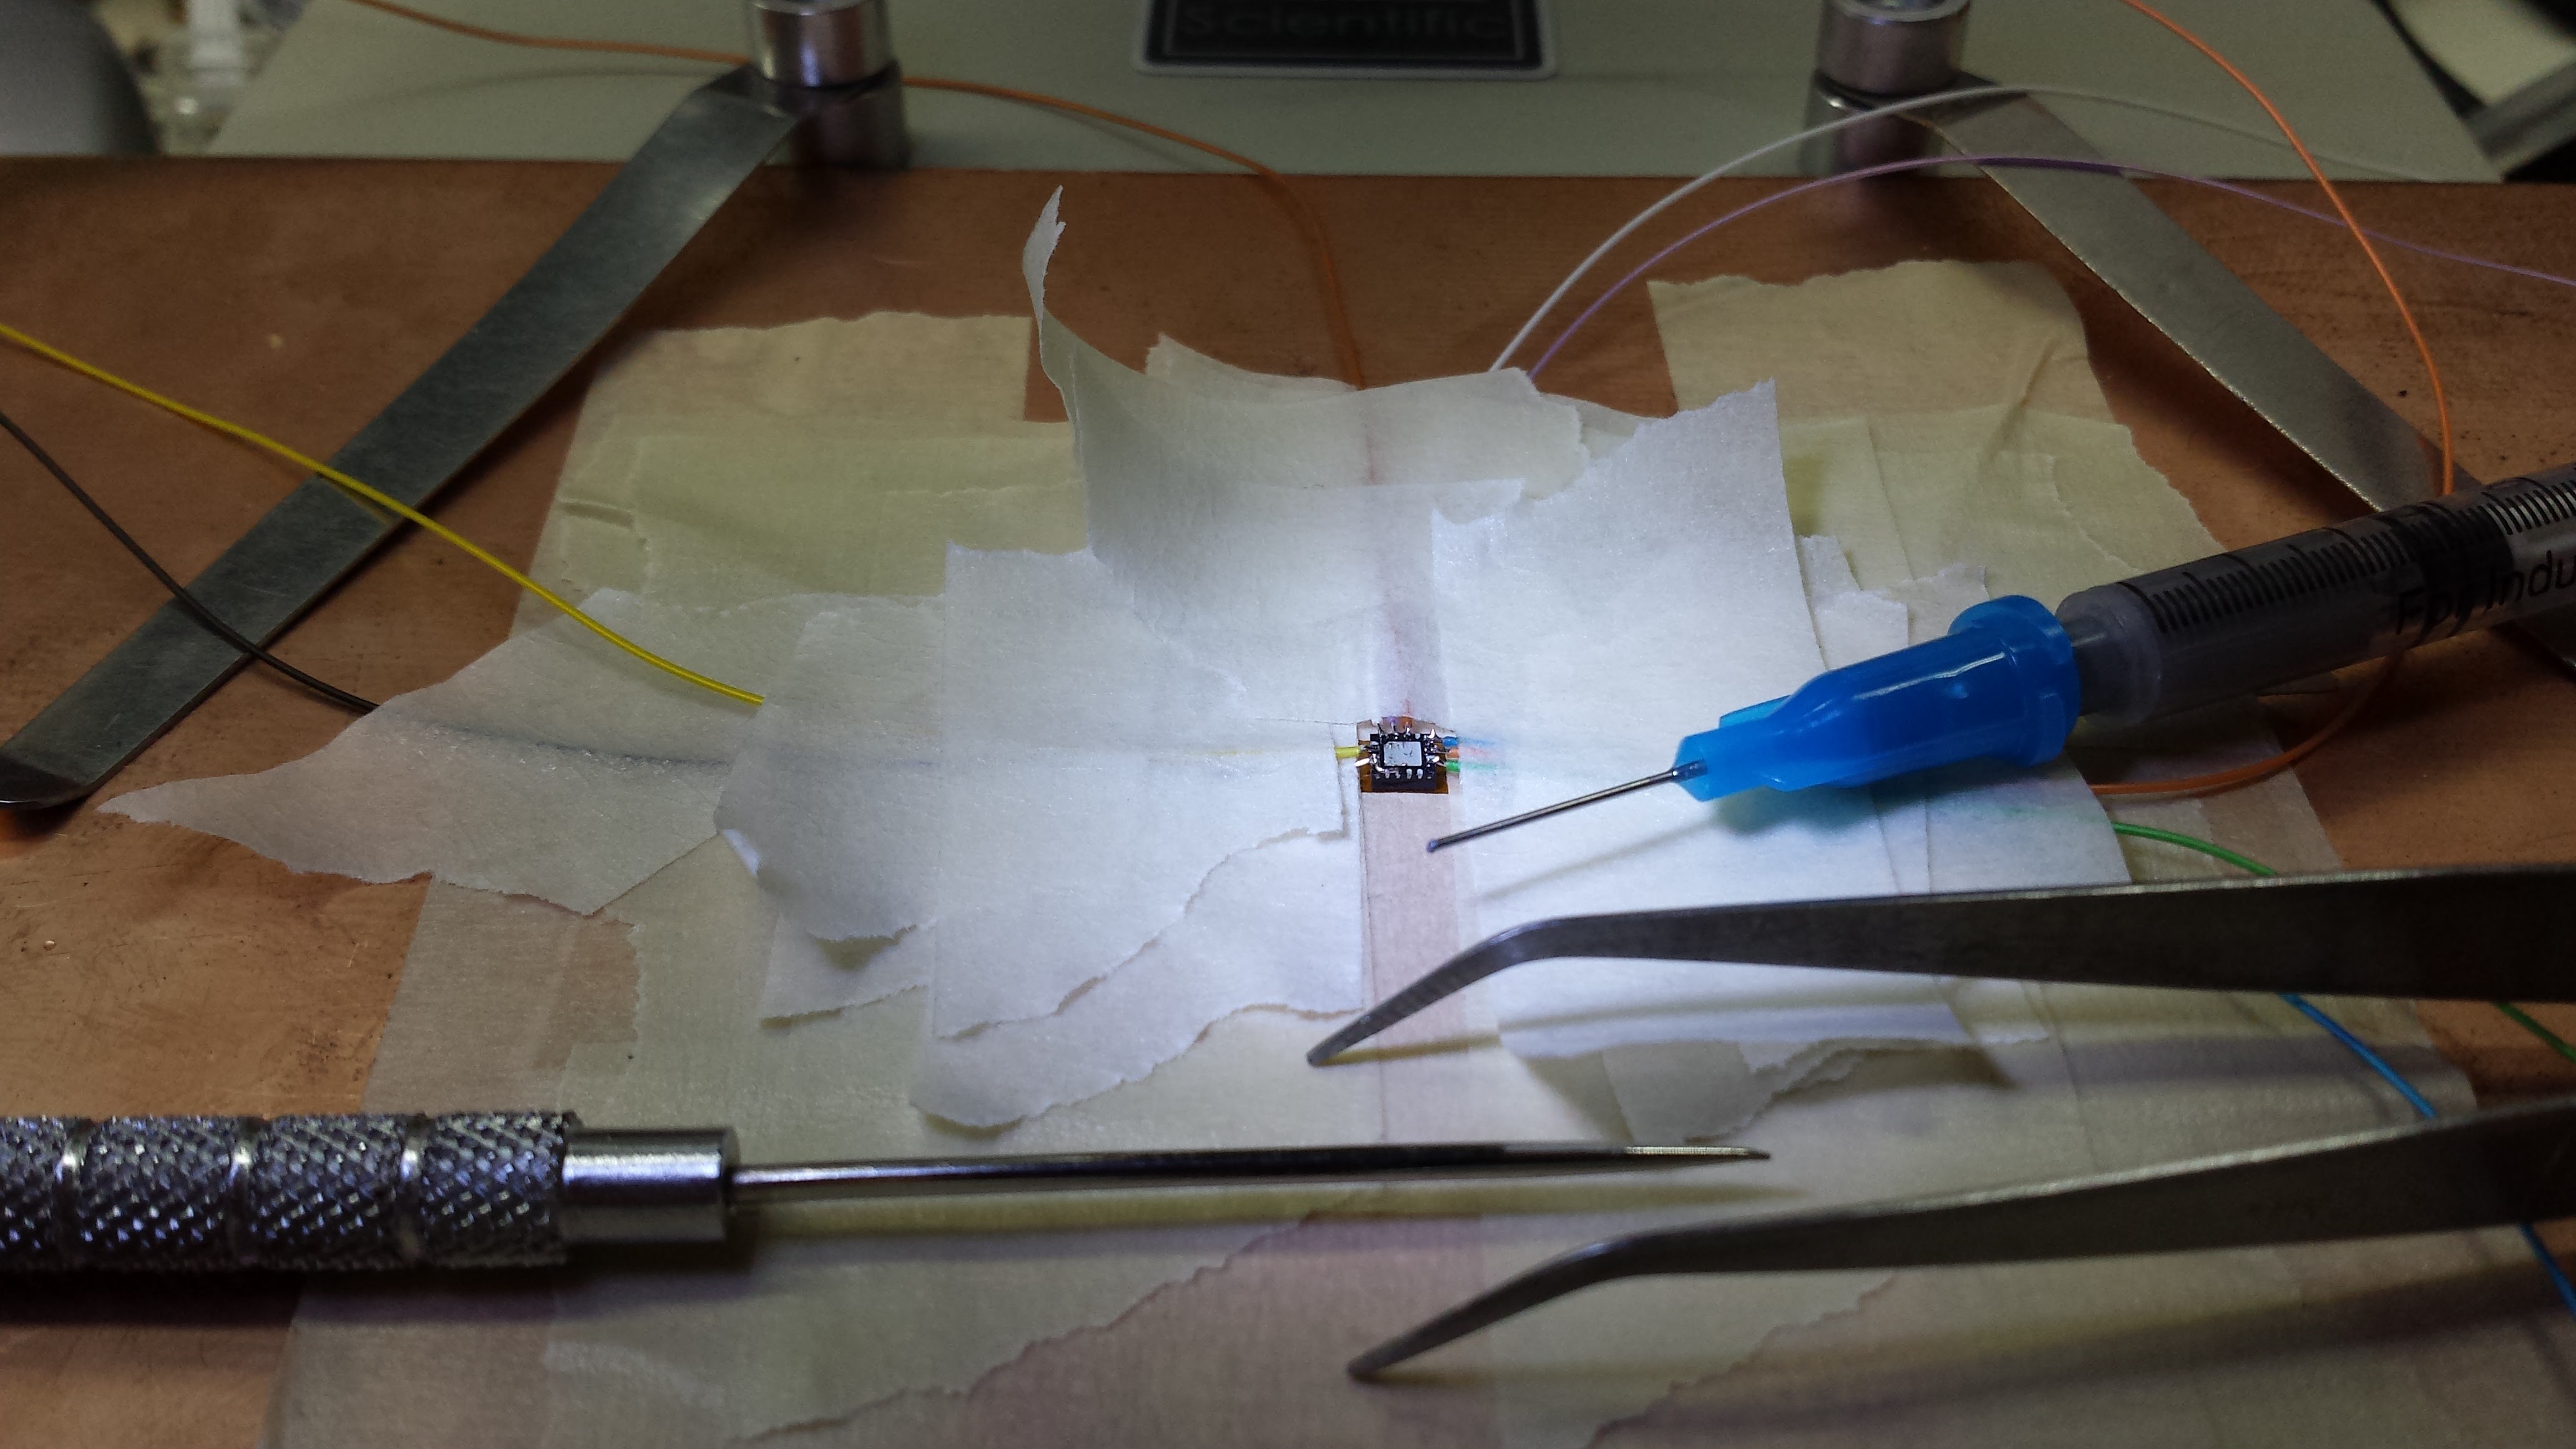
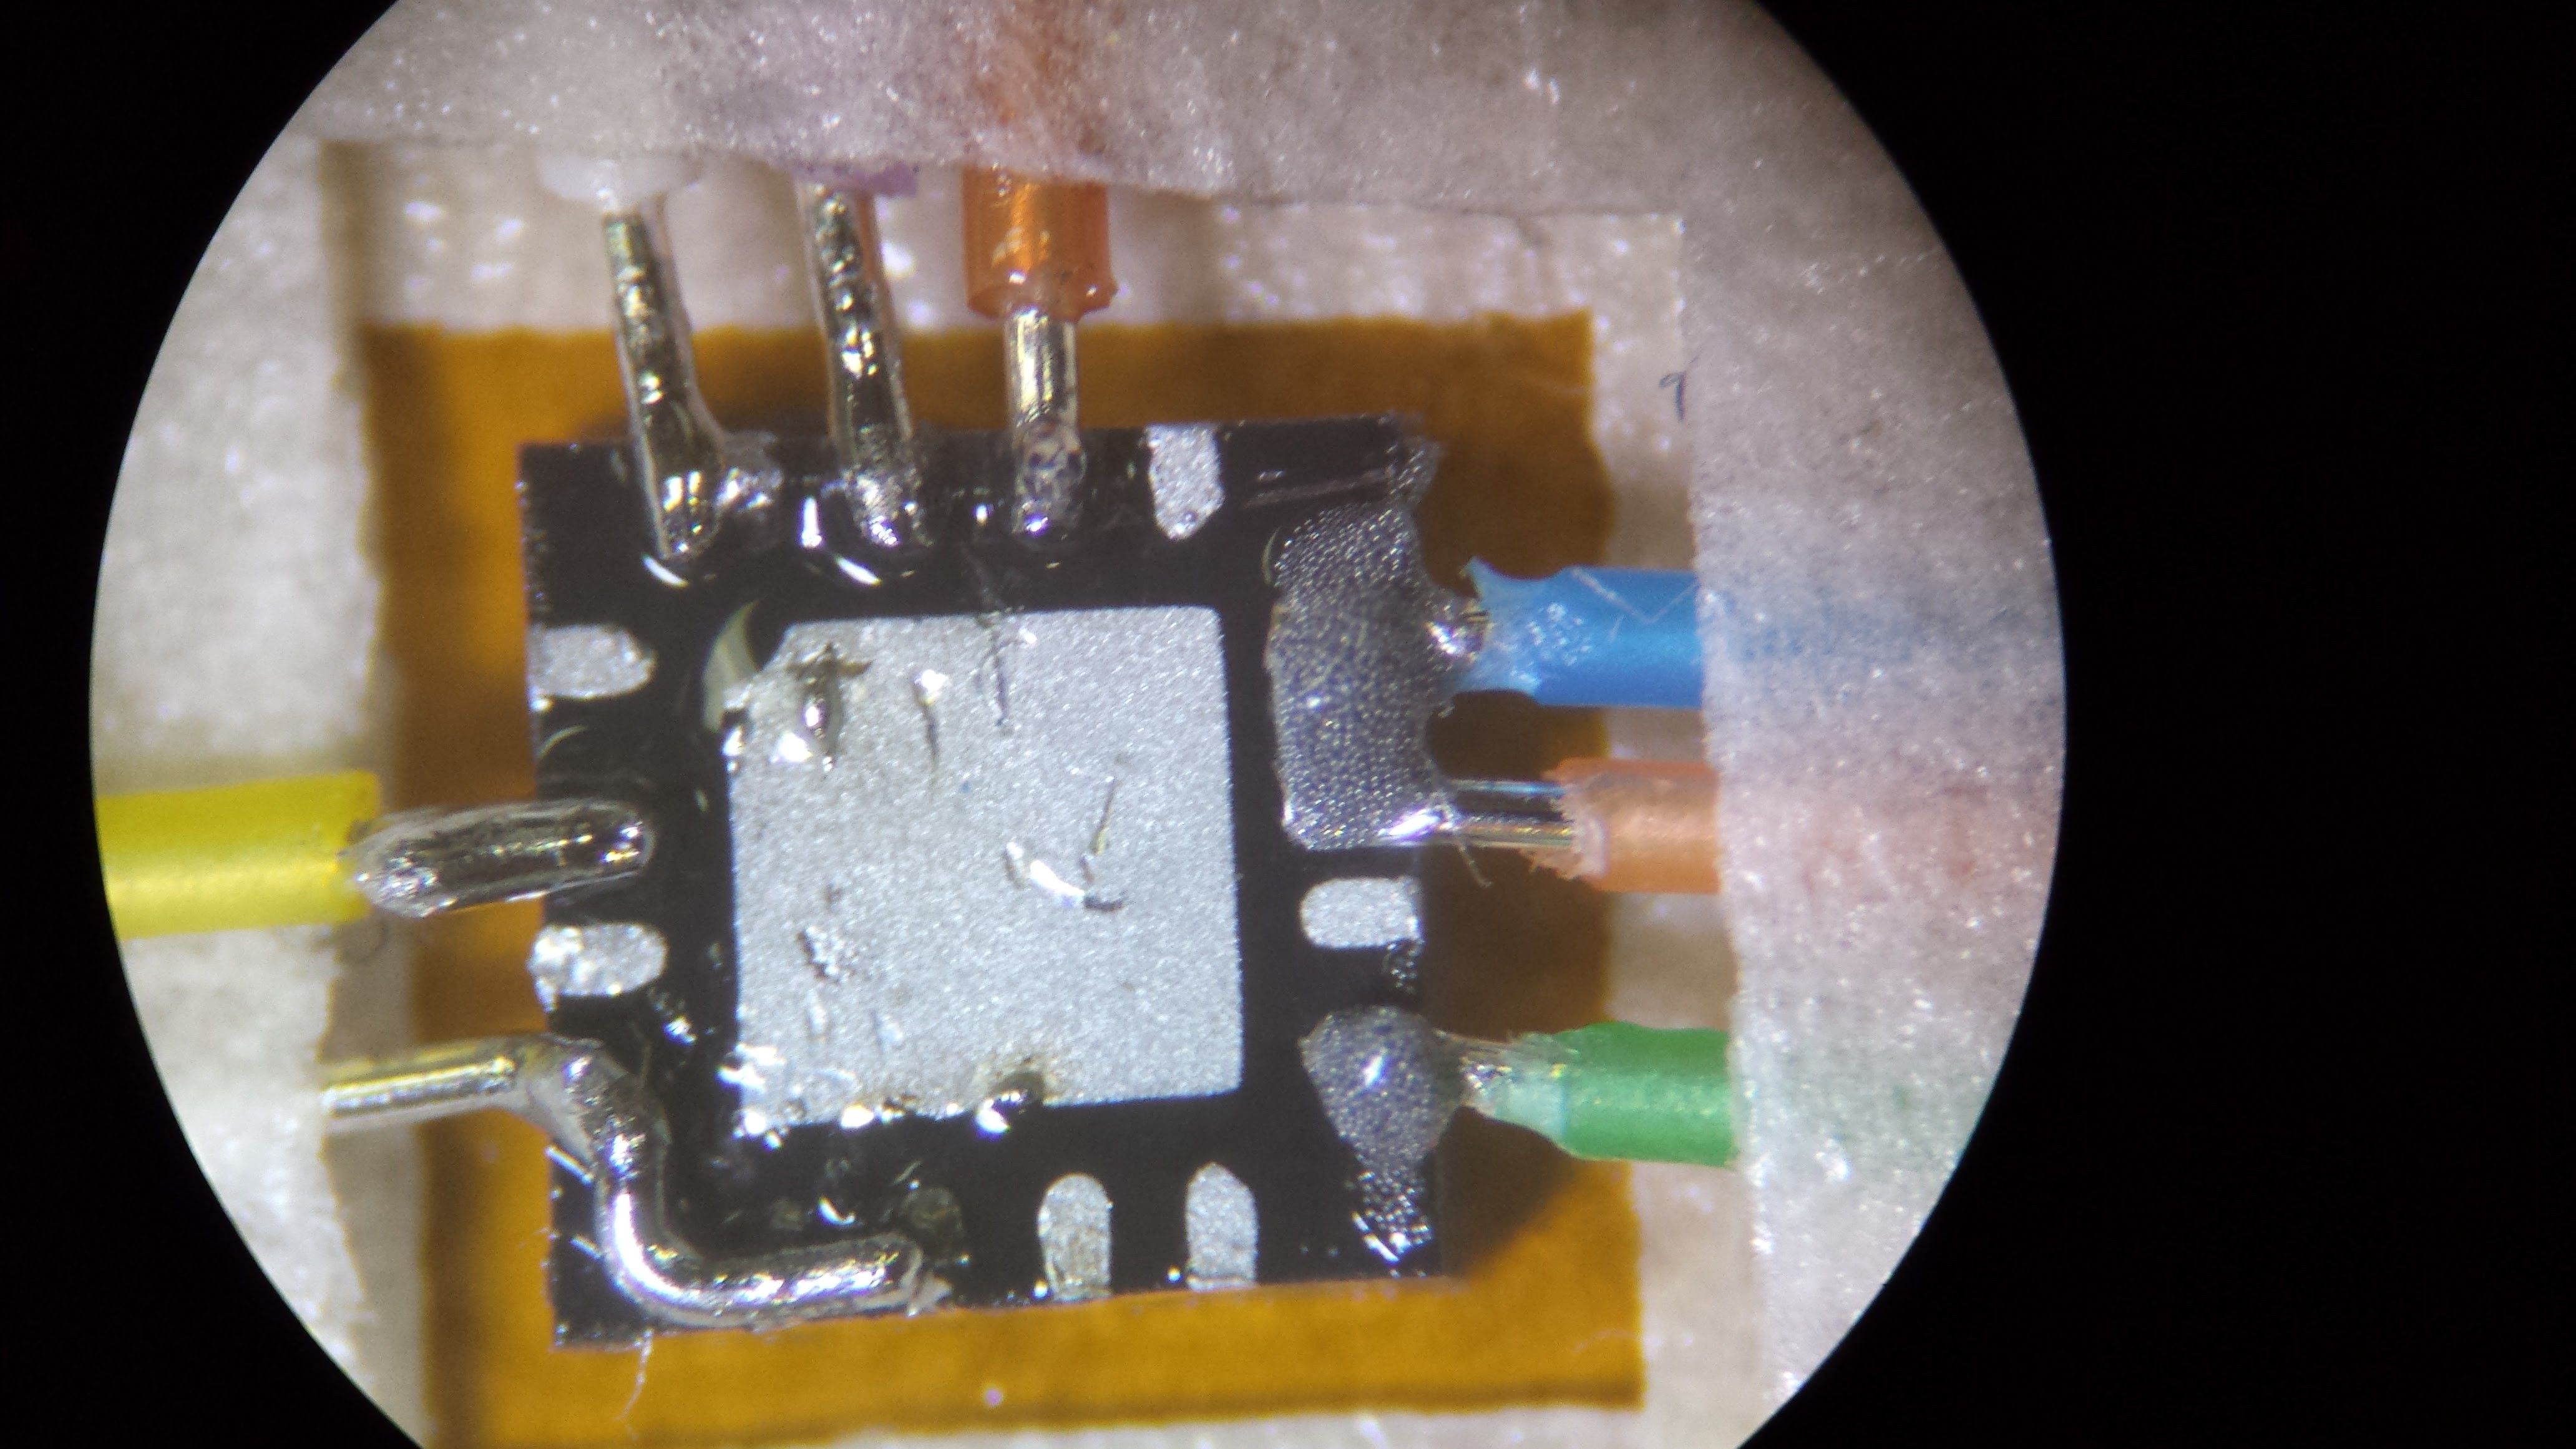
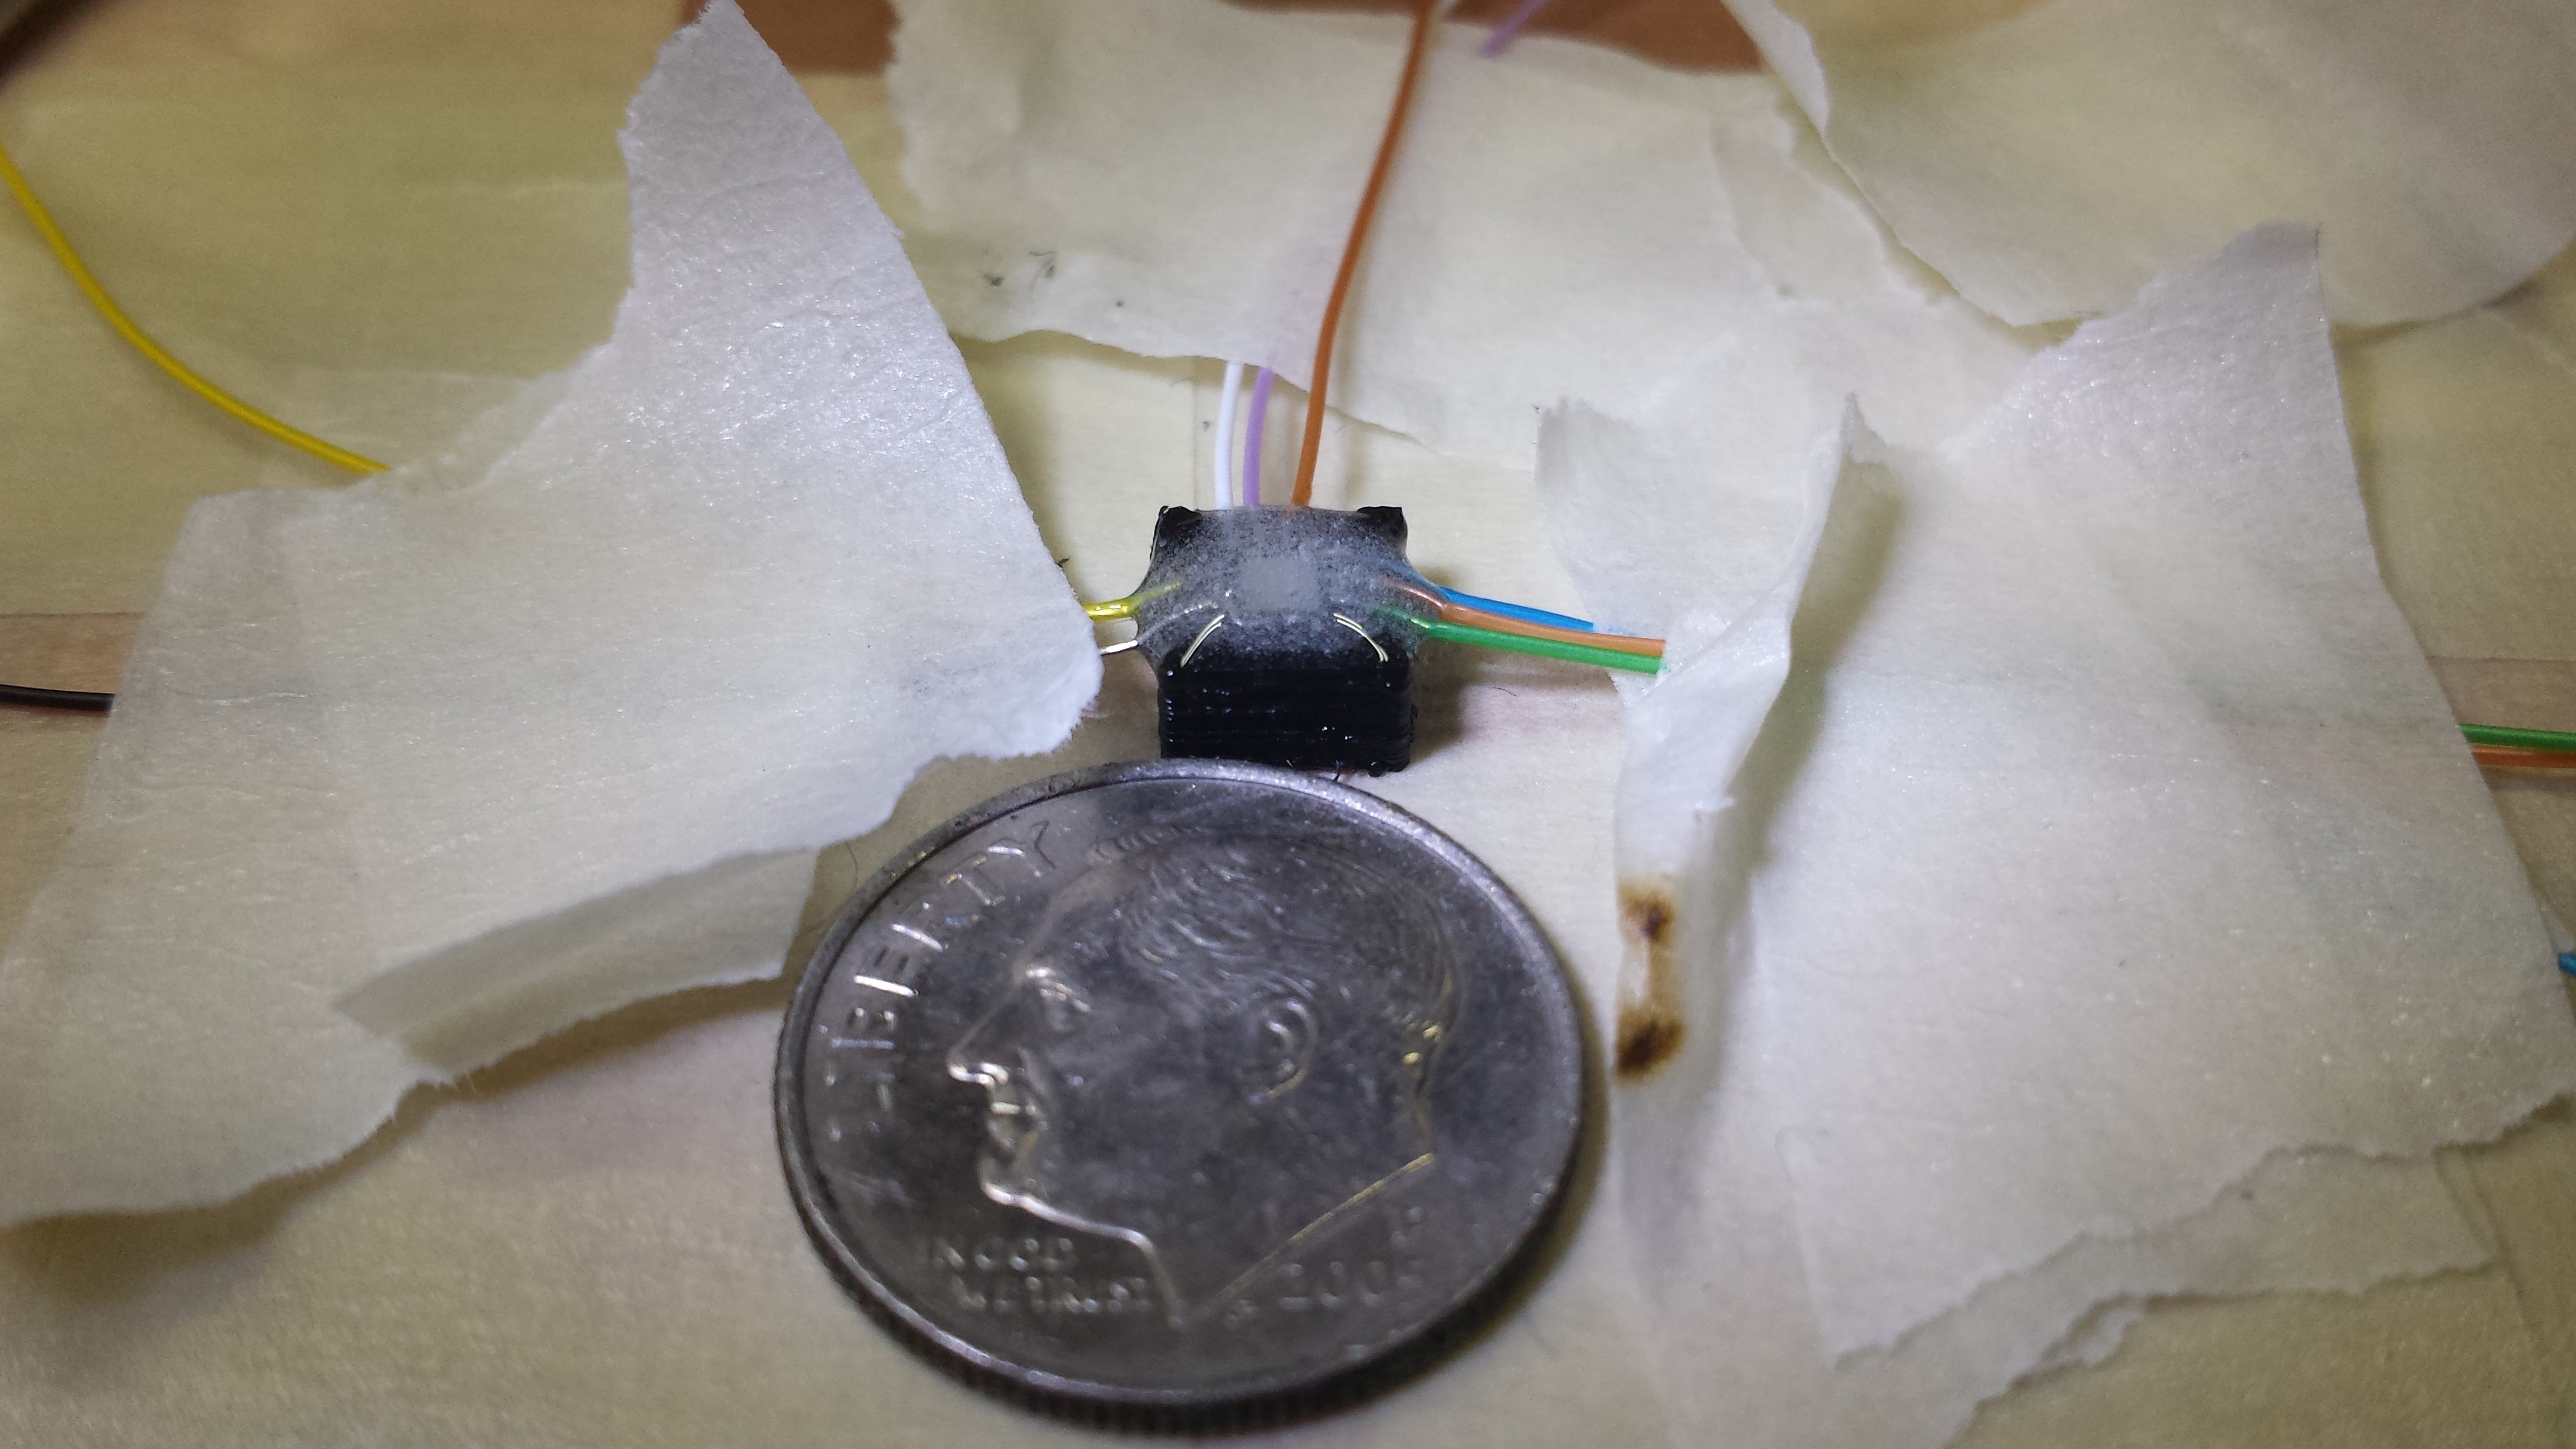
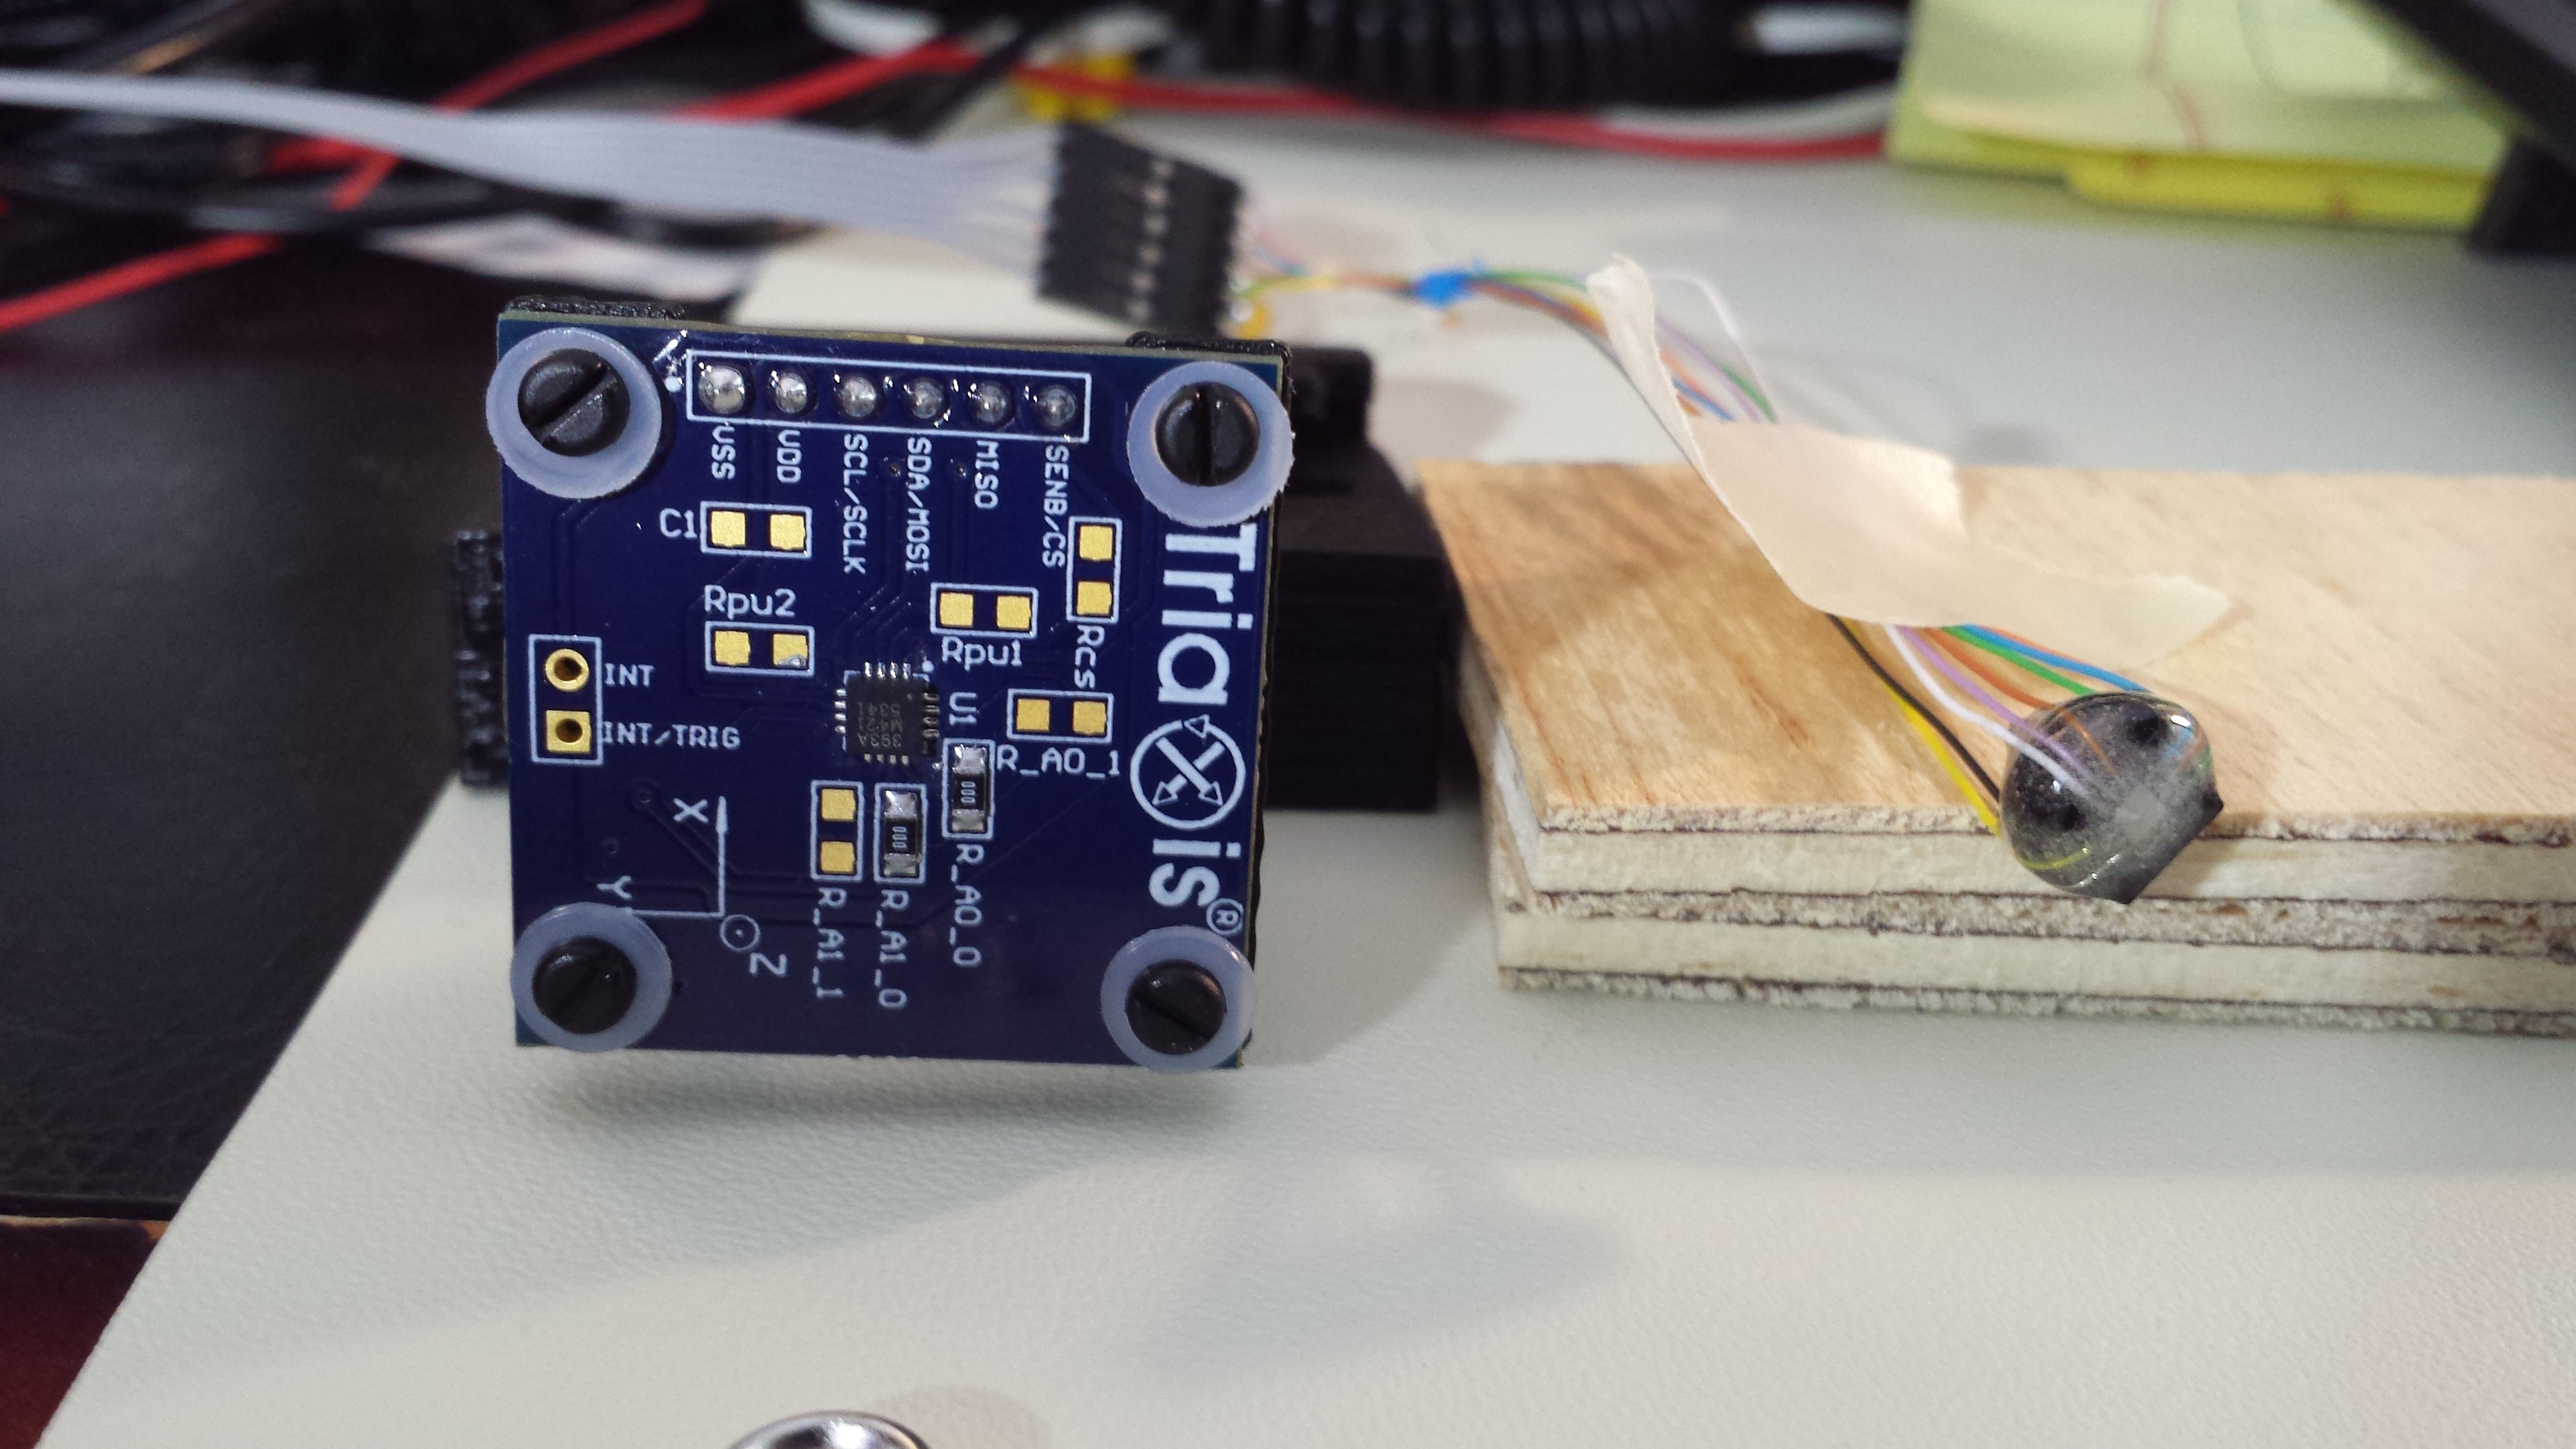
The first rough prototype used off-the-shelf modules, including an Arduino and an HMC5883L breakout board from Adafruit to get a proof-of-concept result. I've now switched to using a Melexis MLX90393 magnetometer, which allows a much wider (60x more) range of field strength, and am designing a custom scanning head using this part.
Show Me Something
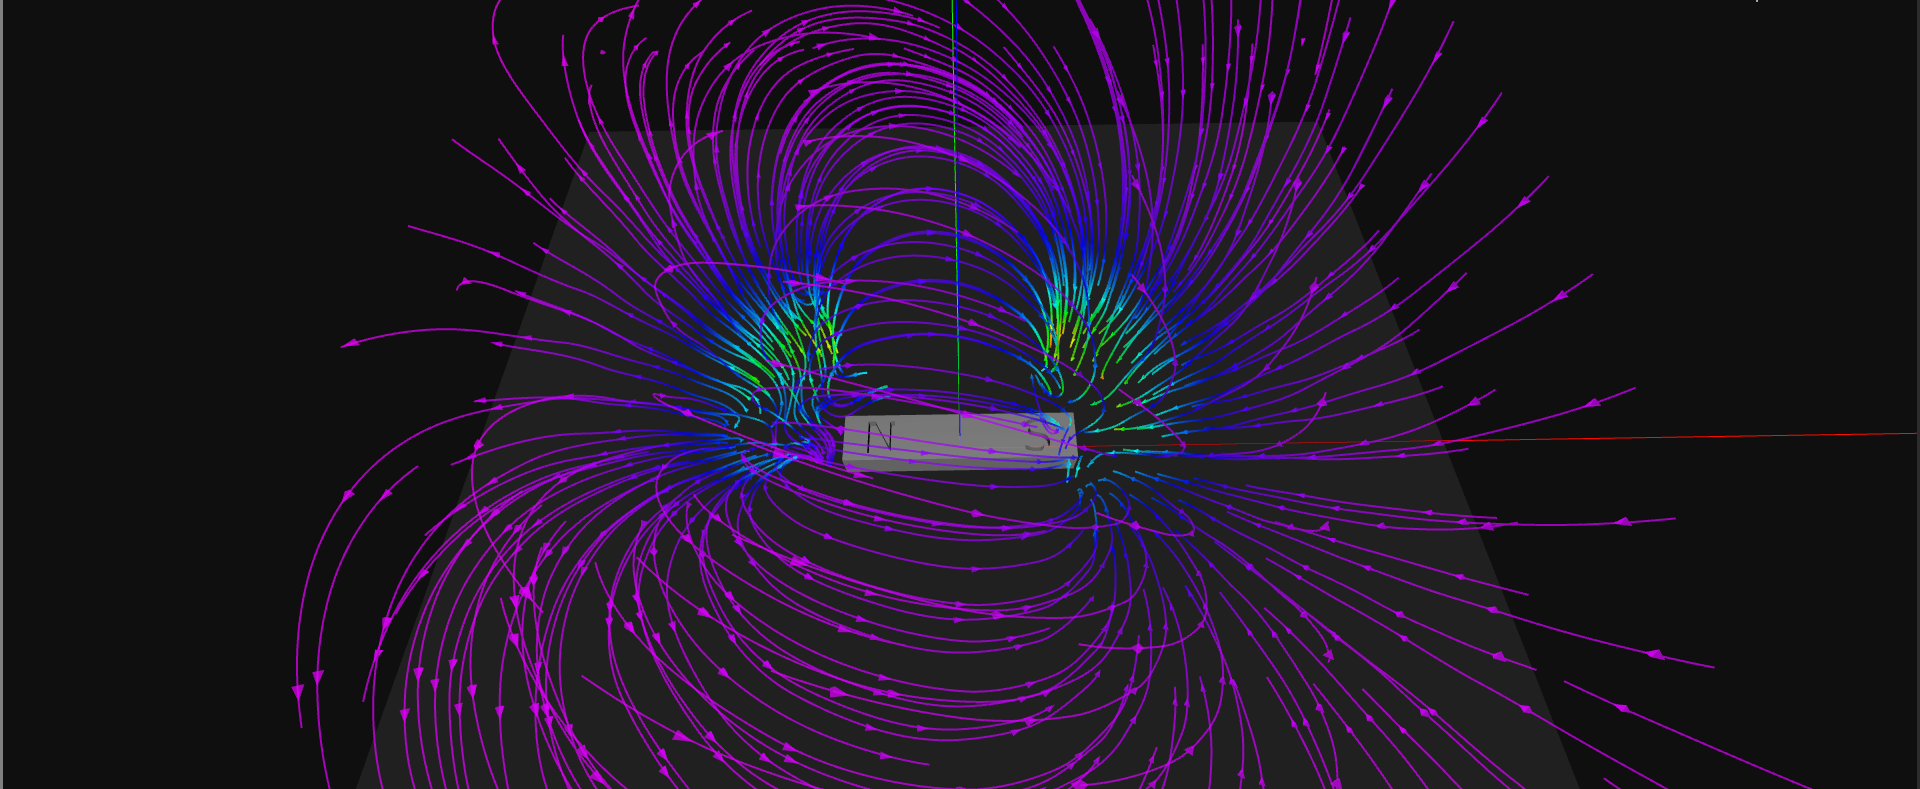
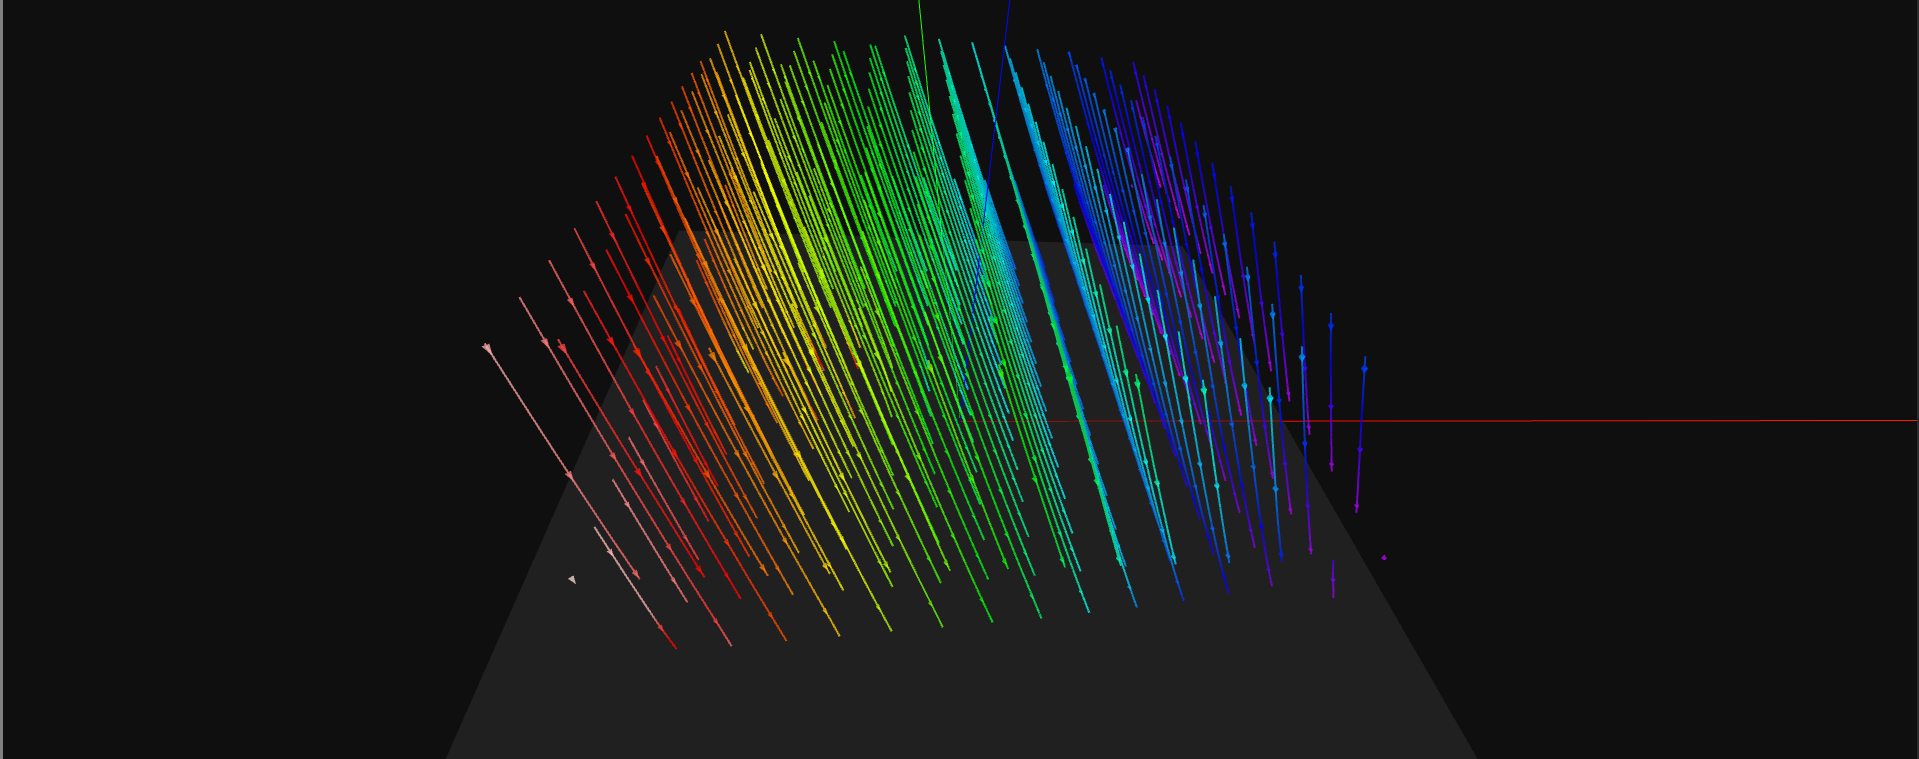
Here's a sneak-peek from the proof-of-concept (with a hard-coded/pre-computed visualization of actual data). More details on this first test can be found in the first project log. The viewer is a WebGL app hosted on my server, since I can't embed it here:
This may or may not work on your platform: at least WebGL is required. I've tested it on linux (Firefox, Chromium), my Android phone, and a friend's iPad and Windows 7 machine, and it worked on all of those. It bugs me that this has to be off-site: I'm offering a one-skull bounty to anyone who can get embedded WebGL to work directly in hackaday.io :-)
Project Phases
I've divided planned development into four basic phases, intended as rough guidelines on which to base releases:
Phase 0
The proof-of-concept that generated the results above. This code is truly hacked together, and a release would cause more problems than it solved, so it's not going out. More details of this effort can be found in the first project log.
Phase 1
First planned release. The goal is to have two programs, a python scanner and a WebGL browser-based visualizer. Features to possibly include:
Scanning
- Manual scan limits - scanning above an object only, and it's up to the user to specify the 3D coordinates of the bounds
Visualizations
- Field Lines (interactively generated based on user parameters)
- |B| axis-aligned intensity cross-sections
- Image mapping an overhead image of the object into the 3D visualization, with program-assisted registration
Sensor
- MLX90393 evaluation board on 3D printed probe
Phase 2
Scanning
- Scan limits based on user-supplied 3D model of target. This is very convenient for printed targets (coils, etc), and rough bounding volumes can easily be created for arbitrary targets. The scanning software calculates the scanning paths to avoid striking the target.
Visualizations
- Iso-lines (2D axis-aligned iso-B lines in 3-space)
- Iso-surfaces (from Marching Cubes)
- User-supplied target model in 3D visualization
Sensor
- First pass at miniaturized custom probe using MLX90393
Phase 3
This phase is the full-custom hardware step, incorporating everything learned in the first [three]. As such, it's subject to radical change as we go.
Scanning
- Automatic scan limits based on machine vision or "bump" sensors. These might include optical proximity detectors, microswitches, or wire-in-coil contacts (what are those "whisker" feelers called, anyhow?). The idea is to drop in a target and press the button to scan. The printer doesn't destroy the target or itself during scanning.
Visualizations
- Who knows, I'm sure there's some cool things to be done
Sensor
- Fully...
 Ted Yapo







 Josh Cole
 peter jansen
Ted, would you mind sharing your python codes?