 Jesse Farrell
-
System Demo - Dry Run
04/27/2026 at 04:25 • 0 commentsHere's a quick system demo showing it working. It's a little bit of a let down given we don't get to see it working with an ACTUAL well, but C'est la vie. I'll upload another demo to this same log next month when I'm able to deploy the system.
-
So how low-power is it?
04/26/2026 at 02:19 • 0 commentsTLDR -> 24uW @6uA during sleep
I only received my REV01 PCBA on Thursday, and I was busy Friday night debugging and cleaning up documentation for the Green Powered Challenge.
Now that the bugs are squashed, and documentation posted (in its admittedly unfinished state) let’s have a look at power consumption. After some flailing, I came to a setup for measuring uA’s reliably that played well with the WellWatch.
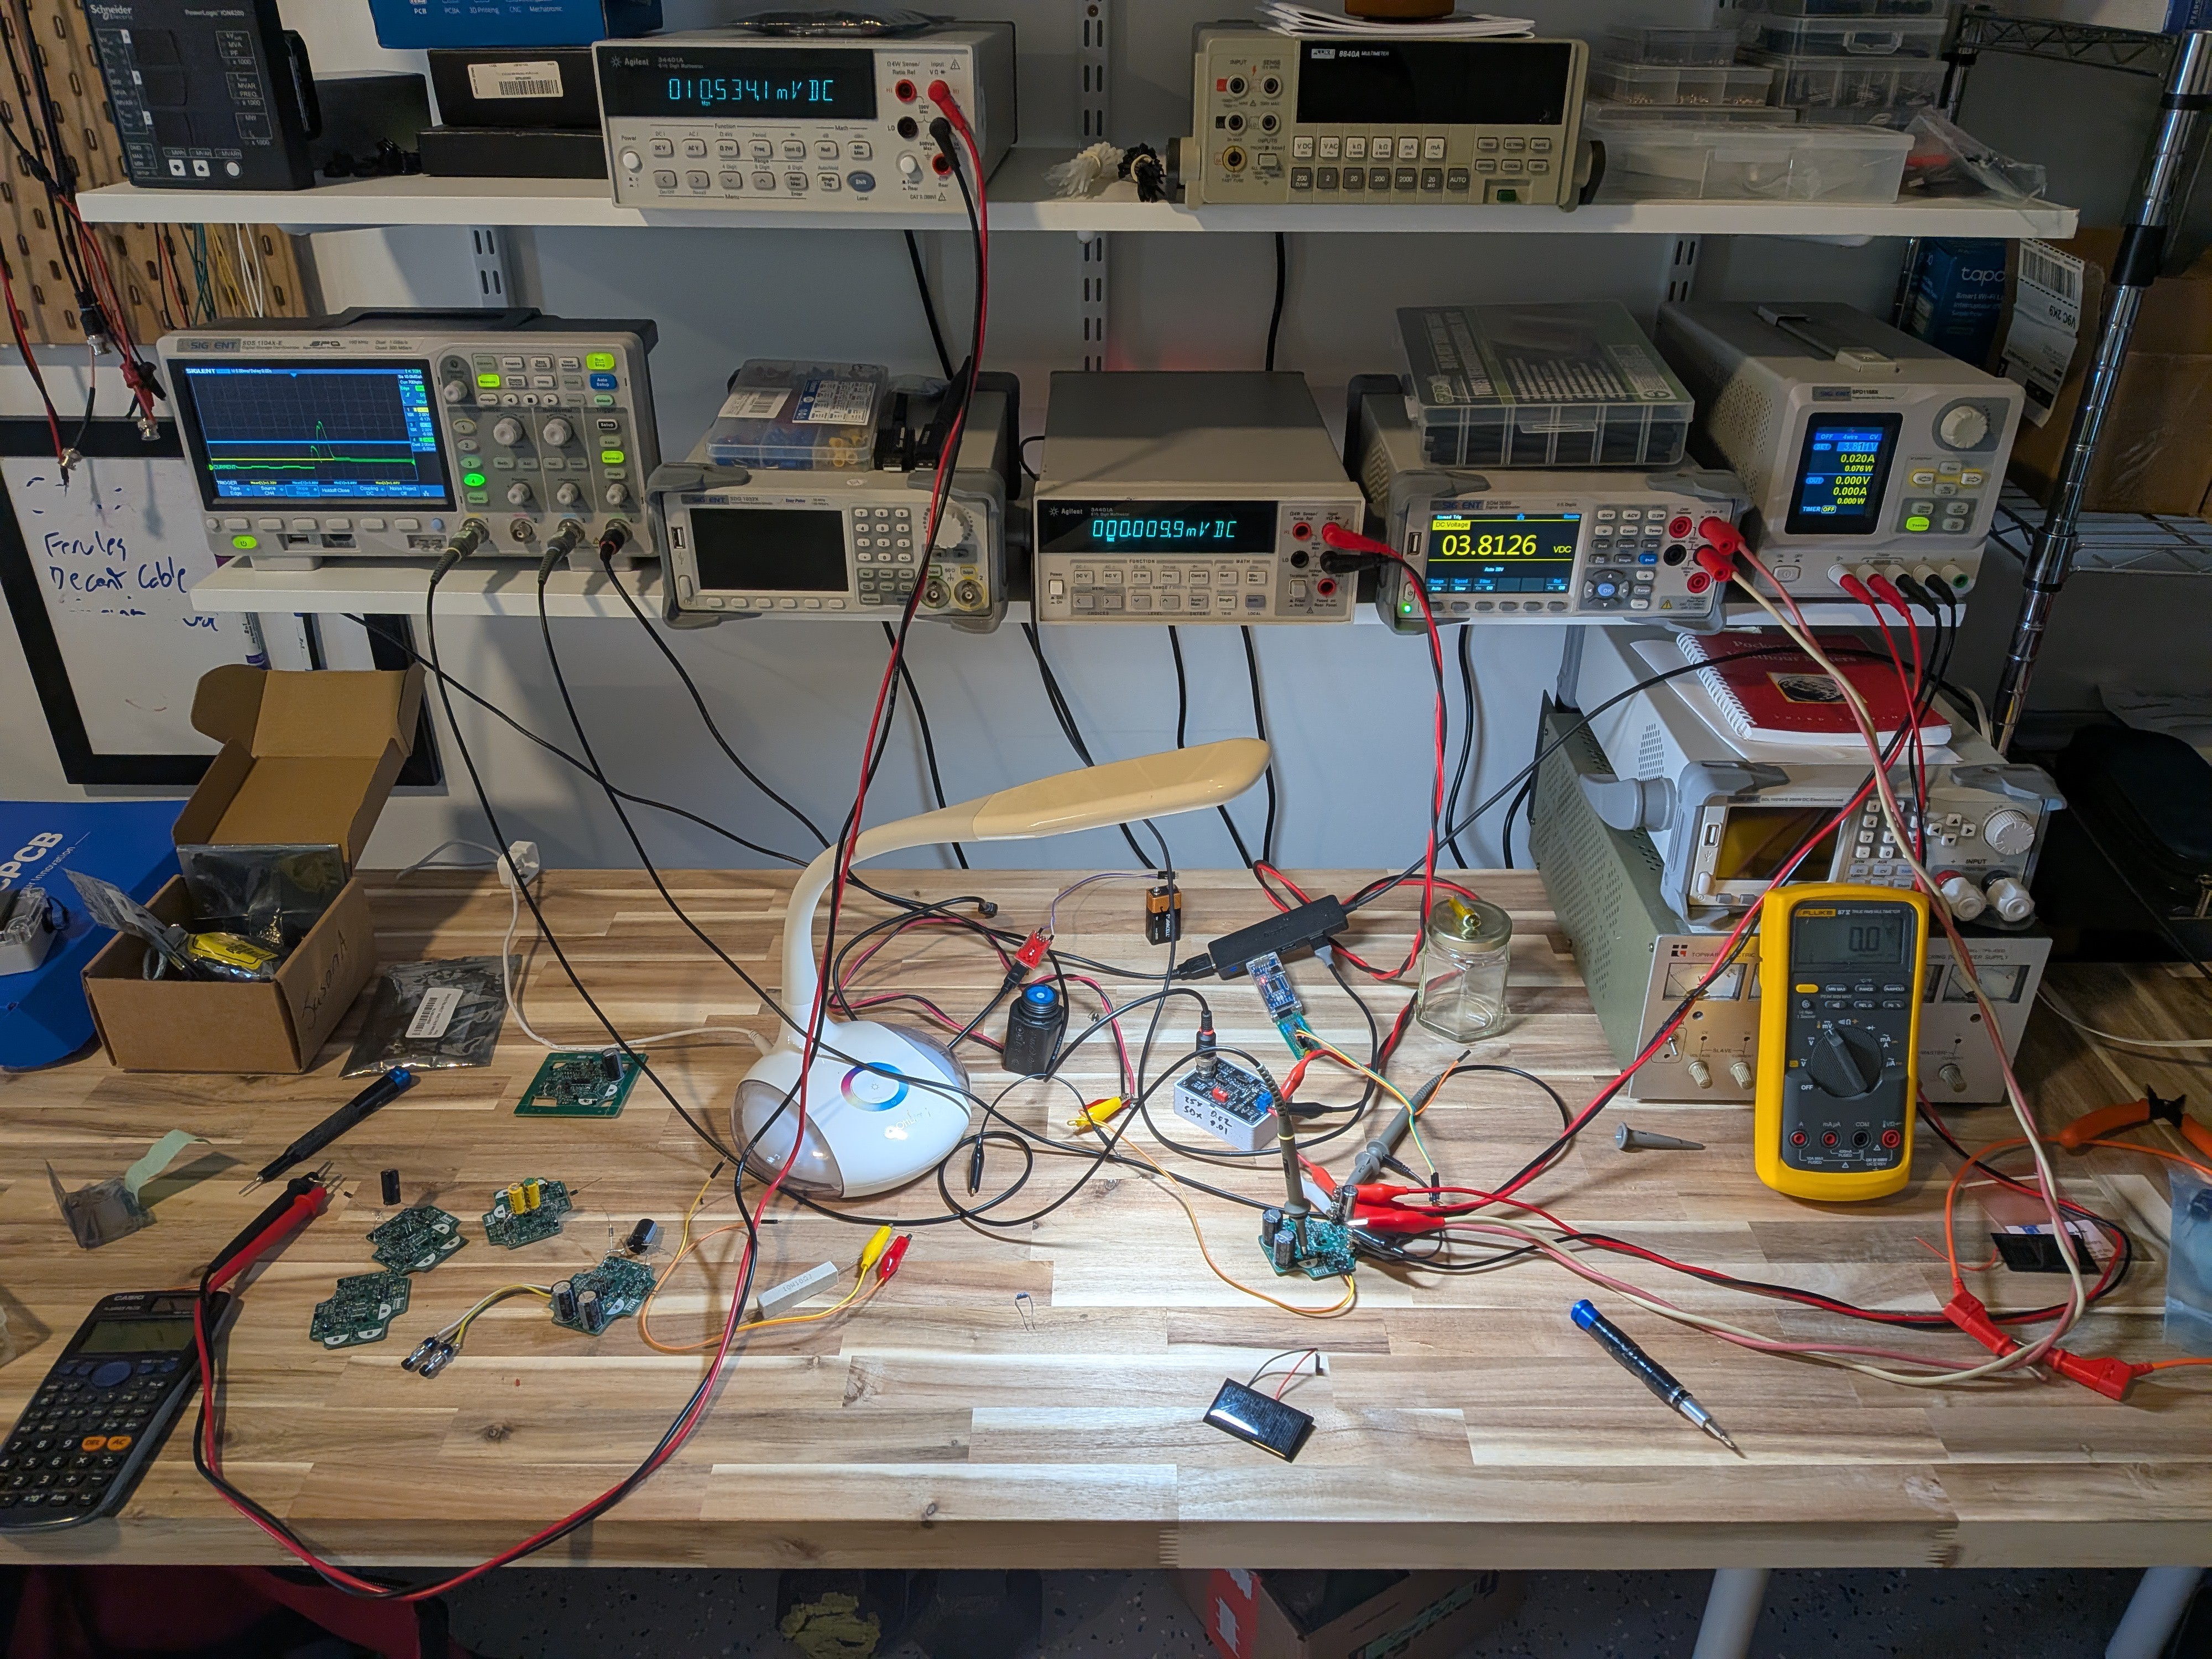
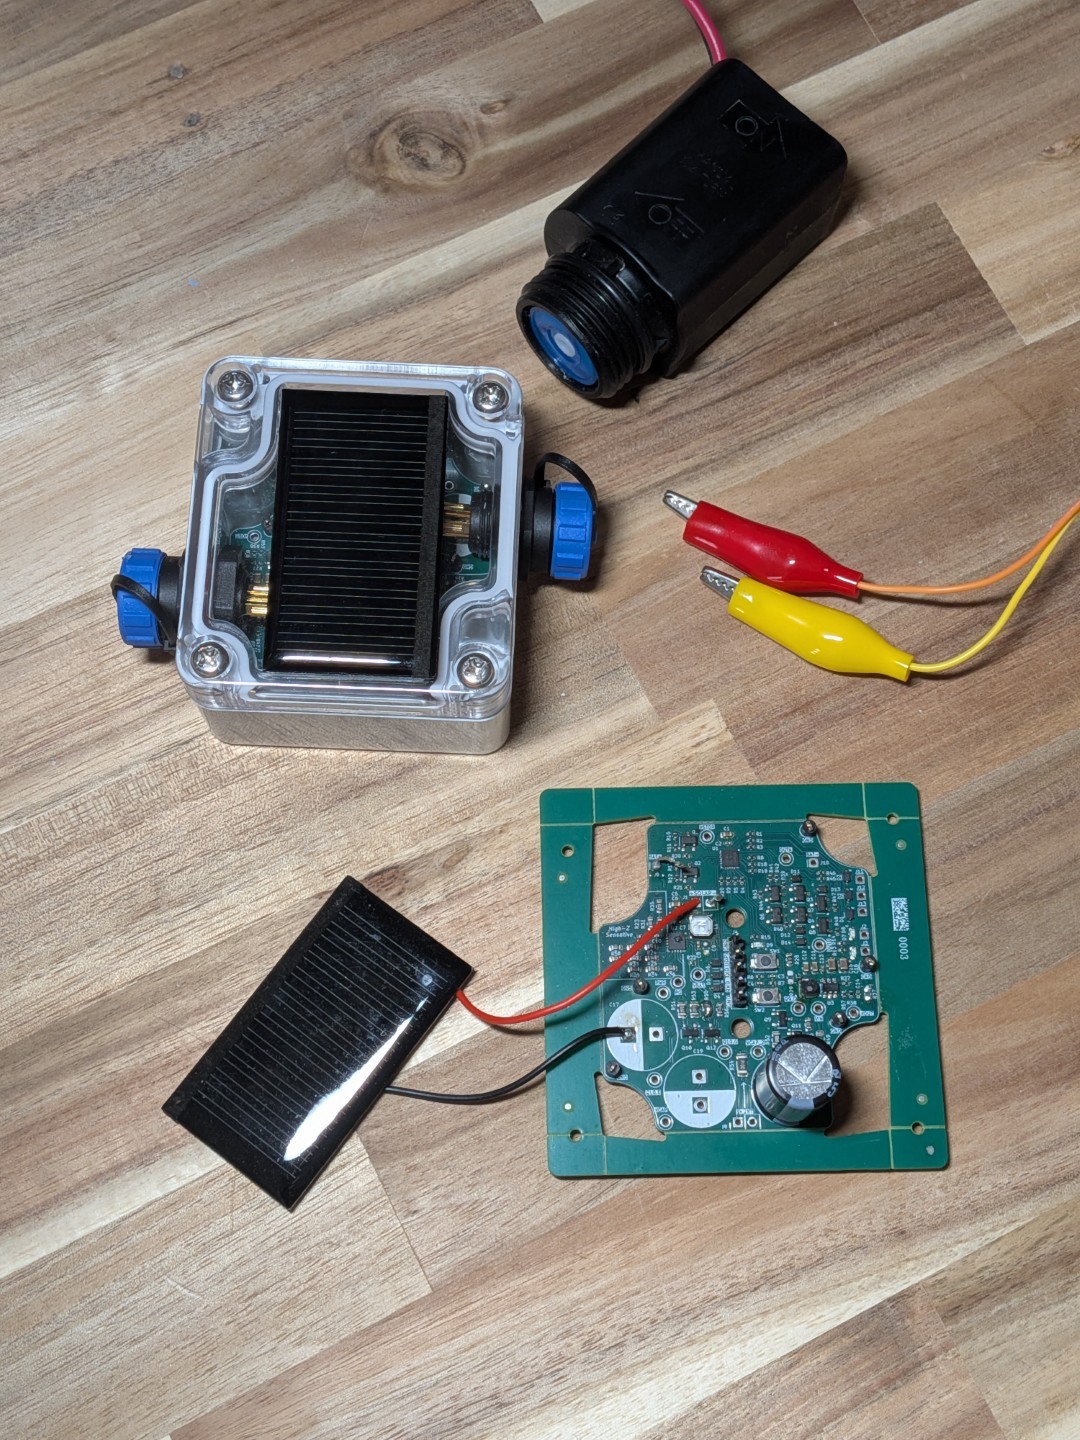
Power is provided by a supply w/ sense wires connected to a 2 ohm current measurement shunt. The sense wires are key to stop the device from resetting itself due to voltage dips during solenoid switching (this is just an issue for my hacky setup where I don’t have a nearby battery to sponge the bursts of current). One DMM measures the potential across that shunt, and another DMM measures the potential across the 1000uF capacitor (the battery stand-in).
![]()
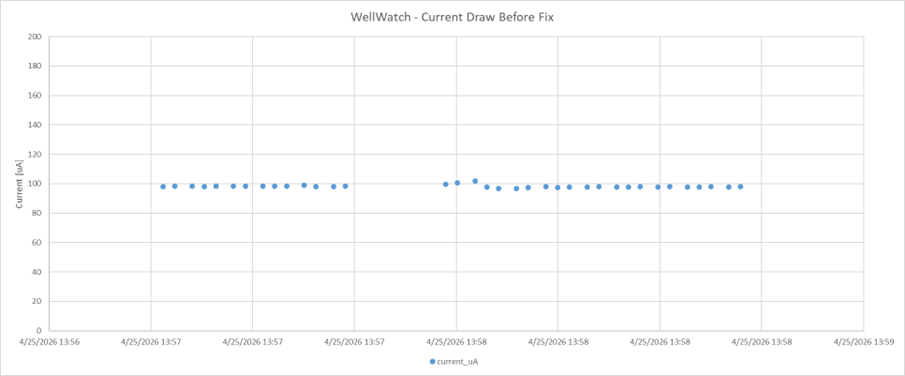
When I first tested the system, it’s sleep current was 98uA (375uW). Not terrible, but not nearly as good as I expected or wanted. Luckily the culprit was fairly easy. The floating UART pin PB3 was hogging power. Driving it low (when not in debug mode) resolved my issue. I tried tuning a couple other parameters, but only really saw substantial benefits from this change.
![]()
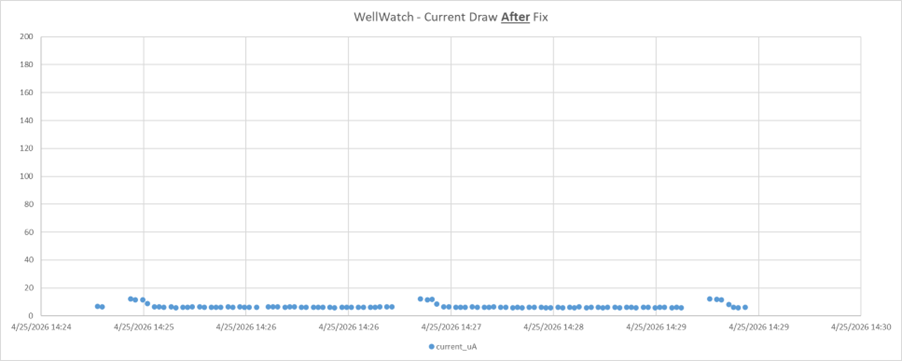
Fixing the UART issue reduced the current all the way down to 6uA (24uw). The gaps in the chart is where the device wakes up, and exceeds the bounds of this chart.
![]()
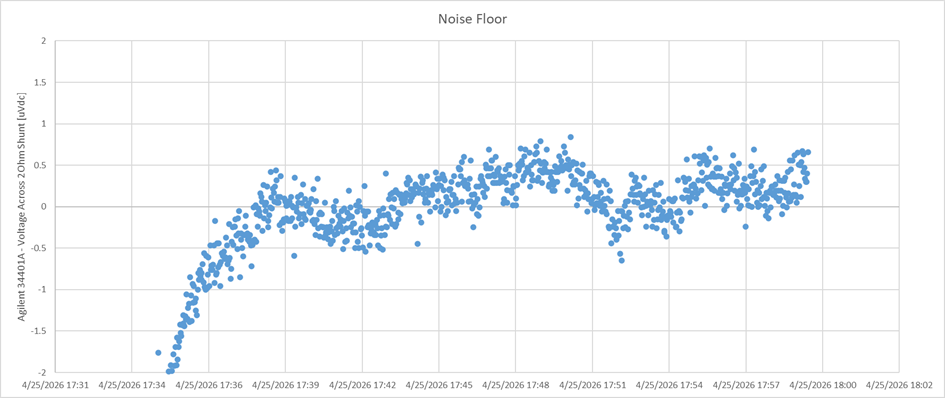
At this point I was concerned about the noise floor of my setup. In the below screenshot I tested the same setup with the PSU unpowered. This makes me more confident about the 34401A’s mV measurement. We should be able to reliably read above 1uA, though there might be +/- 1uA of slop on that value.
![]()
-
Waiting for REV01 Boards
04/22/2026 at 05:11 • 0 commentsI was hoping to submit this project for the Green Powered Challenge. DHL says boards will arrive on the 24th, I work best under a time crunch (completely intentional of course). I'm holding out hope that boards will arrive early.
In the mean time I've been plugging away on the main documentation for WellWatch.
I also got a pair of SP11 connectors (blue capped panel mount connectors on side of enclosure) that should work nicely for connecting the solenoid and float switch to enclousre while remaining water tight. The elephant in the room is the solar cell. Either I drill holes to pass the power through, or I put the solar cell inside the container (it has a clear cover).
![]()
Seems like this is future me's problem ;)
-
Hardware Bug Fixes & Lessons Learned - REV00 Sparkup
04/14/2026 at 05:21 • 0 commentsHardware Bug Fixes & Lessons Learned - REV00 Sparkup
Bringing up a new revision always reveals some new bugs. While the core logic of REV00 is solid, I’ve had to perform some bodge work to get the system fully operational. Here is the breakdown of the primary issues discovered during bench testing (in no particular order). Items below are all listed in my REV00 errata, and have been addressed by my REV01 update.
UPDI Programming Header
This was an easy one... I neglected the pull-up resistor on the UPDI line. Easy to solve with a 10k.
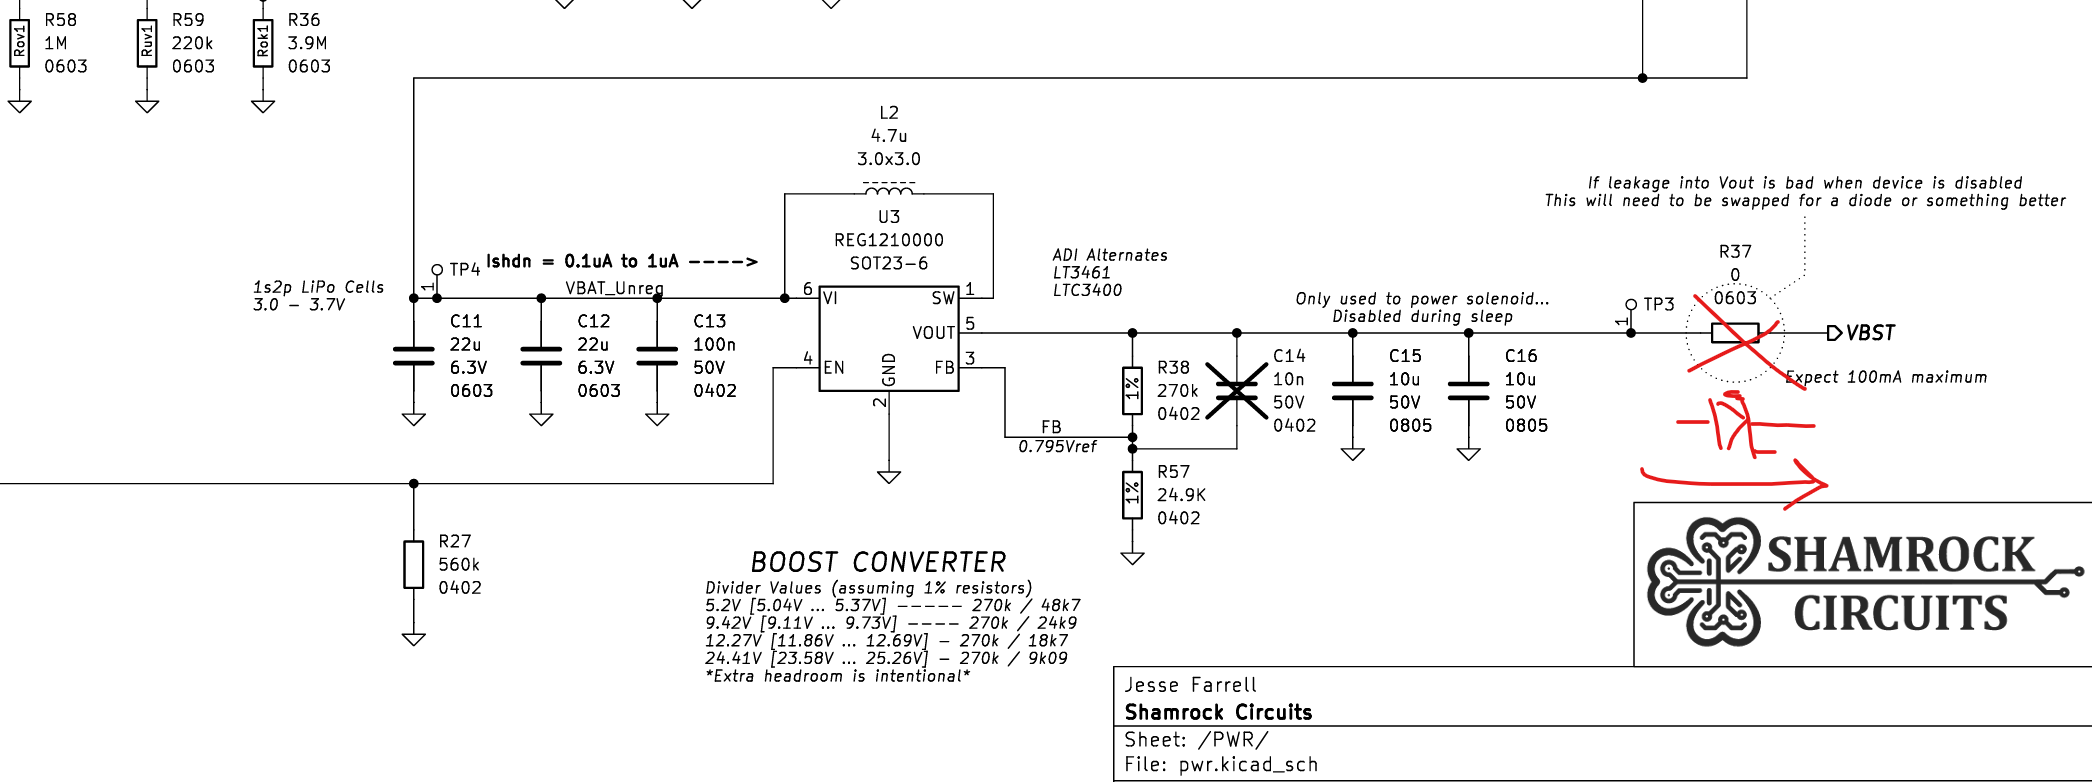
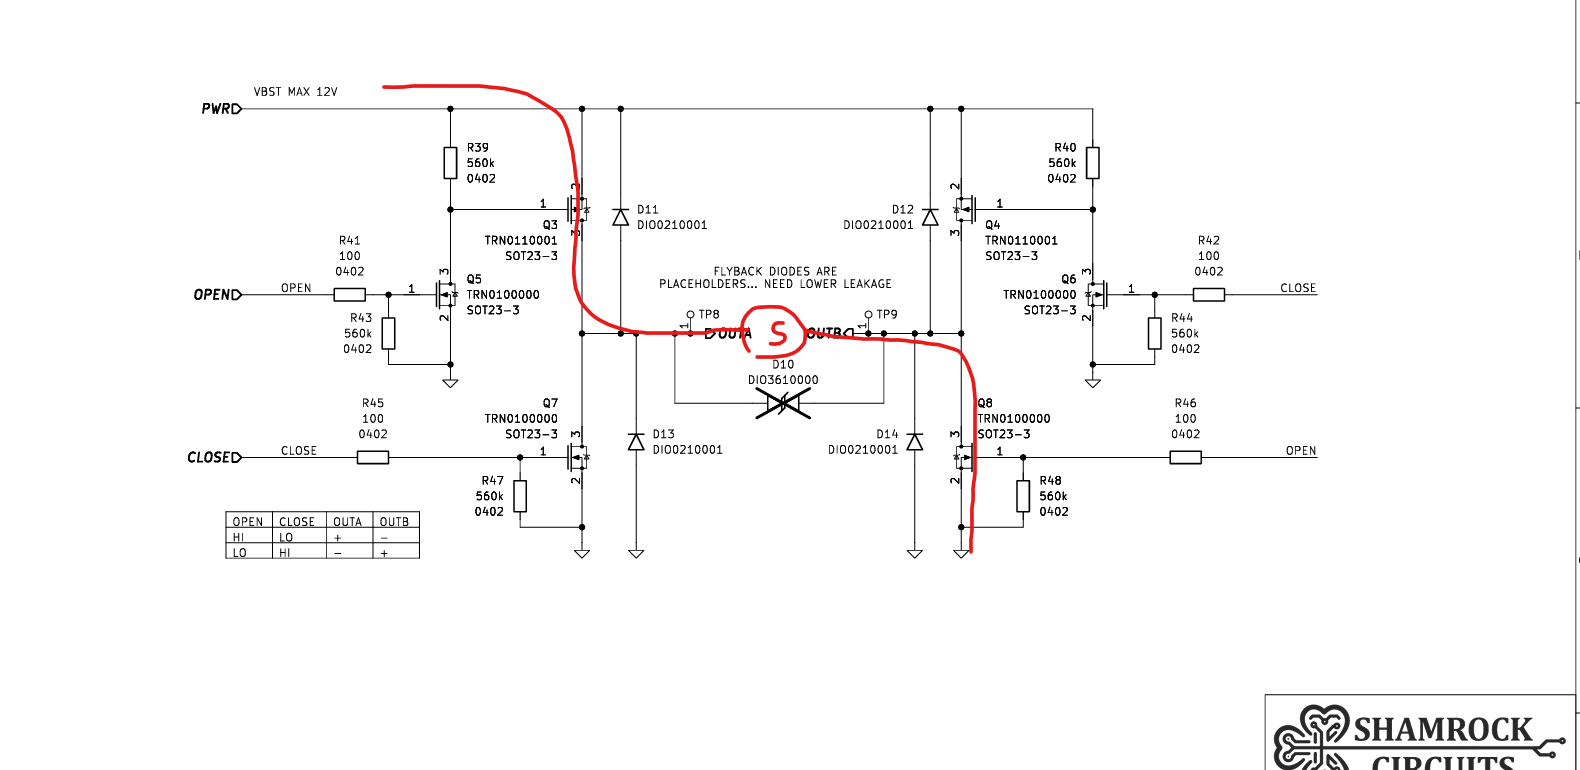
Boost Converter Leakage
While testing the drain on my pulse energy storage circuit I noticed self discharge was much greater than expected. Current was either leaking back into the boost converter output or across the H-bridge.
![]()
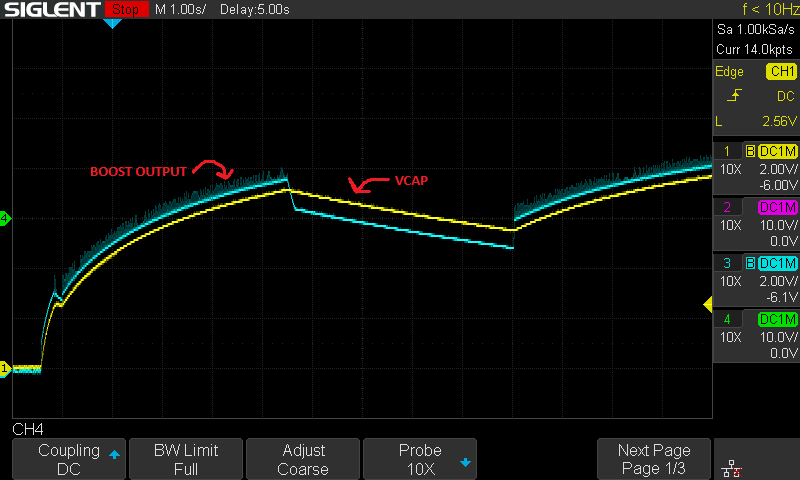
Luckily past me saved present me's bacon. Somewhat anticipating this issue, I added a 0ohm resistor at the boost converter output. Replacing the 0ohm 0603 with a Schottky resolved the issue.
![]()
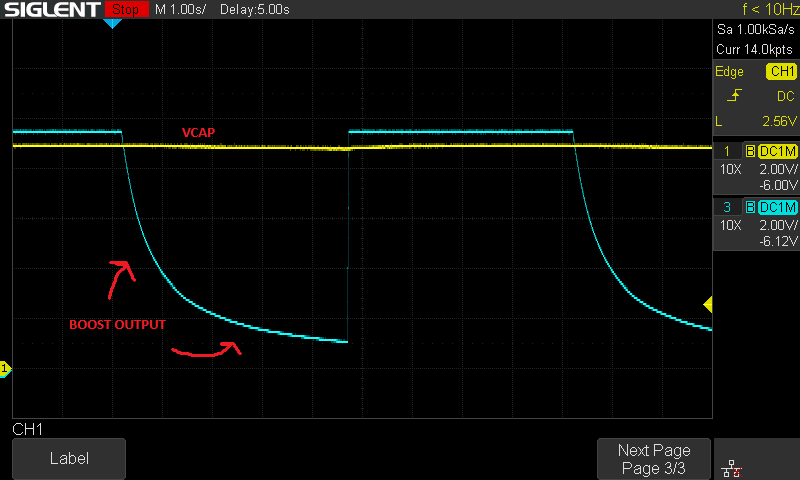
Now when the boost converter is disabled the voltage across the capacitor holds steady.
![]()
VSTOR Loading & Startup Issues
The system refused to boot from VBAT. Whether I simulated an "already charged" battery, or if I allowed the system to charge the battery itself, VSTOR refused to come up. Instead getting stuck around 1.6V.
I initially suspected my voltage divider values on the TI BQ25504, but they seemed to match the schematic. After some datasheet sniffing, I found a critical note.
If a system load tied to VSTOR discharges VSTOR below VSTOR_GEN or below VBAT_UV during the 32 ms initial MPPT reference voltage measurement or within 110 ms after hot plug, it is recommended to add an external PFET between the system load and VSTOR
It seems like the BQ25504 is extremely sensitive to VSTOR loading during startup. I found that if I hold the solar panel directly against a bright light source, it drives VSTOR hard enough to overcome the meek ATTINY load. Once the system is past that 110ms window and fully booted, it functions normally without the extra light.
The datasheet recommends adding an external PFET between the system load and VSTOR to keep the rail isolated until VSTOR is stable. I'll be implementing that to ensure the system can boot on REV01.
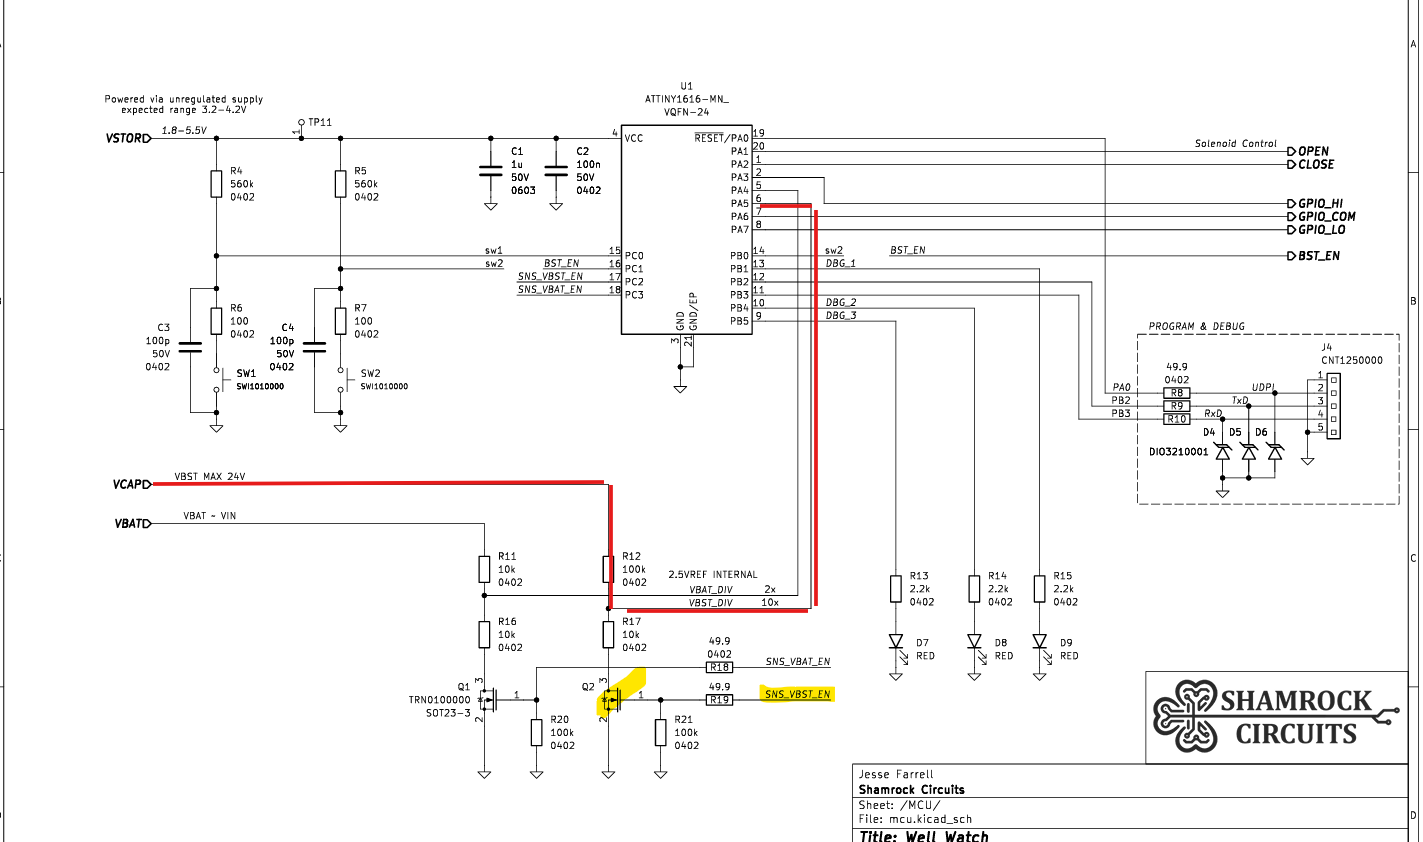
ADC Overvoltage
This was a "head-in-hands" moment during sparkup. I designed a voltage divider to measure the 24V VCAP signal, but I used a low-side switch (SNS_VBST_EN) to enable the measurement.
![]()
When the low-side switch is OFF, the bottom of the divider floats, and the ATtiny1616 sees the full 24V signal (heavily current-limited, but still). I essentially slapped a high-voltage rail directly into a 3V GPIO. Probing VBST_DIV showed it pulled to VCC (3V), meaning the internal ESD diodes on PA5 were working overtime sinking about 60uA. Not ideal for long-term reliability or power consumption.
For the next spin, I’ve added a high-side switch with an NMOS driver. Because of the double inversion in the hardware, the firmware logic remains identical. Easy peezy.
-
Testing REV00 - Battery Charger OVP & UVP
04/14/2026 at 04:05 • 0 commentsThe goal for this test was to verify that the overvoltage and undervoltage protection limits for the energy harvesting subsystem are hitting their intended set points.
Result: PASS
Test Expected [V] Observed [V] Error [%] Overvoltage 4.133 4.15 -0.4% Undervoltage 3.040 3.06 -0.6%
Procedure
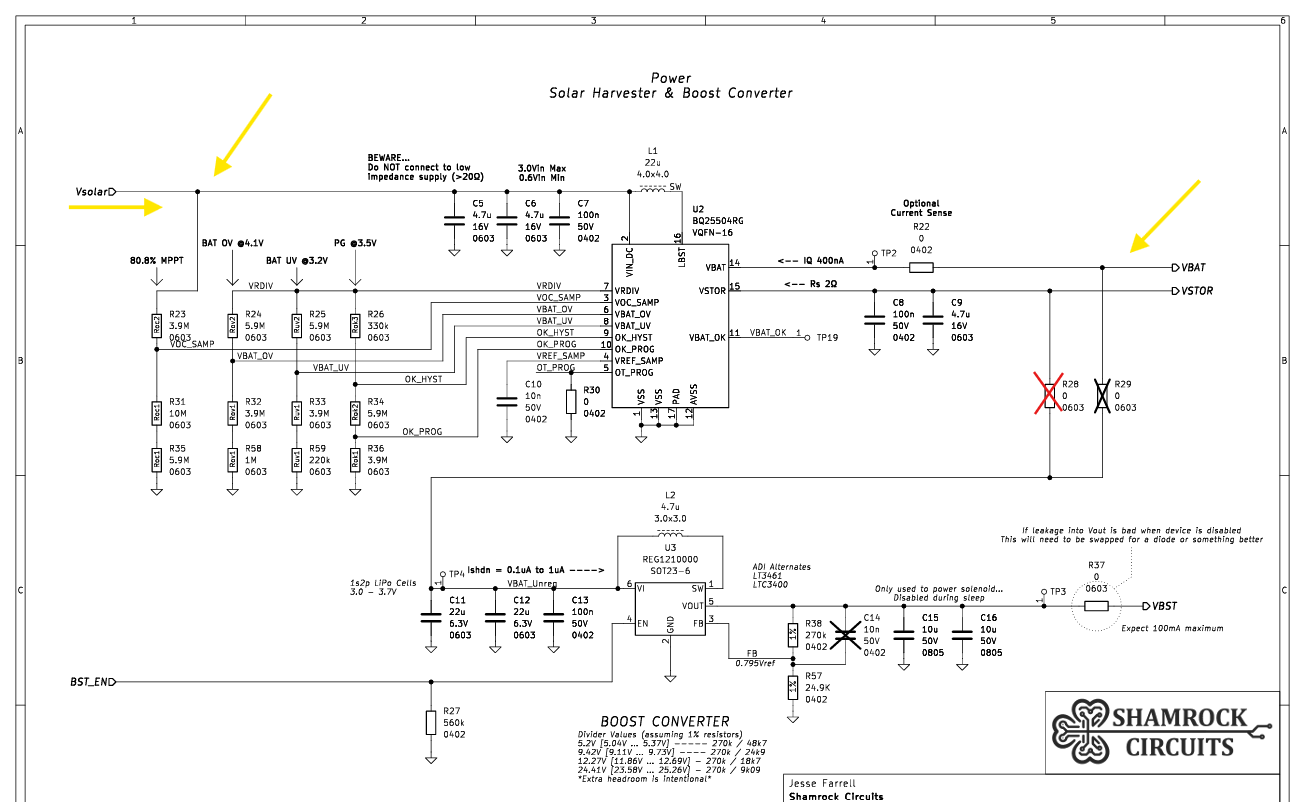
To simplify this test I isolated the solar harvester from the system, and provided a relatively small capacitor instead of a LIPO or LIC.
- Isolate Boost Converter: Removed R28 to disconnect the downstream boost circuitry.
- Temporary Storage: Populated a 1000uF capacitor onto the battery pins (J9/J10).
- Power Source: Connected a solar cell to J1.
![]()
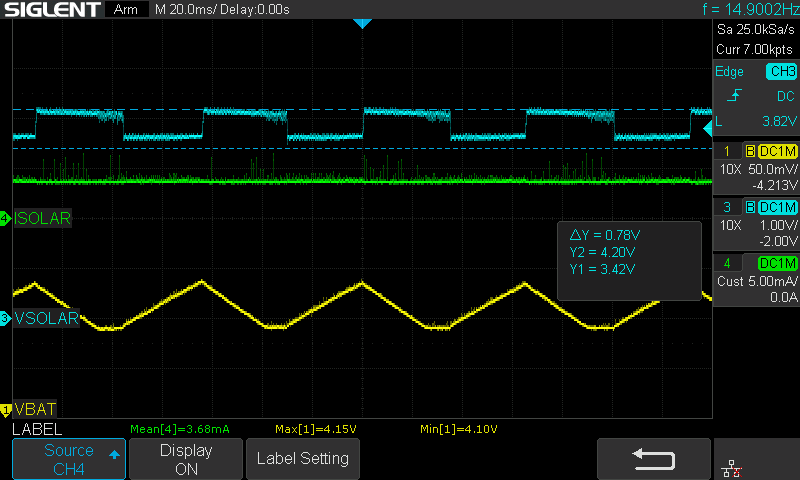
Overvoltage Limit & Hysteresis
For this capture, I probed Vsolar, Vbat, and the current into Vsolar. (Schematic above)
![]() We can see VBAT reaches its overvoltage limit at 4.15V. This is well within the expected range of 4.13V [4.18V ... 4.09V]. The 50mV hysteresis also falls squarely within the datasheet spec (35mV typical).
We can see VBAT reaches its overvoltage limit at 4.15V. This is well within the expected range of 4.13V [4.18V ... 4.09V]. The 50mV hysteresis also falls squarely within the datasheet spec (35mV typical).I was hoping to catch a glimpse of the MPPT (Maximum Power Point Tracking) at work here, but no dice. I suspect with a better light source I’d be able to witness the MPPT in action.
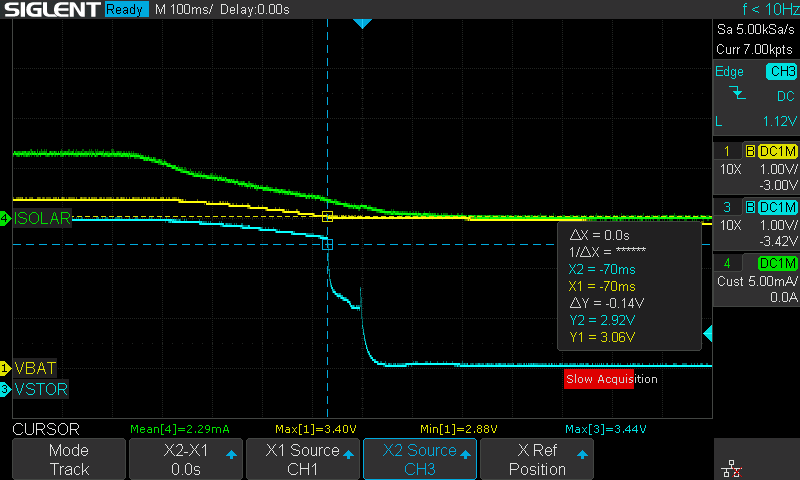
Undervoltage Limit
Using the same setup, I moved the VSOLAR probe to VSTOR to observe the disconnect behavior.
![]() VSTOR is successfully disconnected from VBAT when the voltage falls below roughly 3.06V. Impressively close to the expected 3.04V.
VSTOR is successfully disconnected from VBAT when the voltage falls below roughly 3.06V. Impressively close to the expected 3.04V.Next Steps
Now that the limits are verified, I can move back to full-system integration and see how these limits hold up under the varied load of the H-bridge pulses. For now I'll be testing with bulk caps in place of a LIPO. In the future these limits will likely be tightened further.
-
Testing REV00 – Solenoid Switching & H-bridge
04/13/2026 at 00:55 • 0 commentsI was bad and didn’t push my test results. Yikes…. Doing this retroactively now.
With the REV00 boards in hand, it was time to move on to hardware validation. I had a slew of tests I wanted to run, but at the top of that list was testing the new pulse generation circuit. This includes the bulk cap energy storage, H-bridge, and output current limiter.
![]()
The primary goal for this testing was to verify the circuit design and add any findings to the errata. So long as the solenoid toggles properly, I’d consider it a PASS.
Pulse Generation & Initial Logic
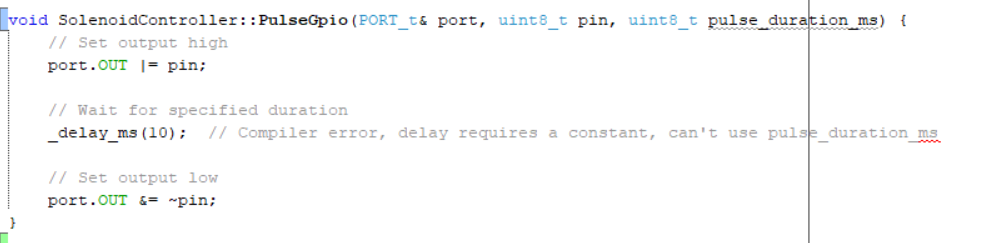
First, I needed to write some firmware for toggling the H-bridge. At this point, I had already developed some code for an ATtiny dev board, so this was a pretty quick task. For early testing, I’m just using a dumb delay; in the future, this will be replaced with a proper sleep method.
![]()
Initial No-Load Observations
During this test, I had the bulk caps powered continuously from the boost converter. Findings below.
- Slow Turn-off: There was a noticeable lag in the turn-off time. This was expected given the high-value pull-up resistors on the Q4/Q3 gates. I suspect adding a real load will "clean" this up by providing a discharge path.
- Sloppy Timing: I set a 10ms pulse in code, but the scope showed a much shorter duration. It seems
_delay_ms()is significantly off on this implementation. Since I'm moving away from this for later revisions, I'm not going to lose sleep (😉) over it yet.
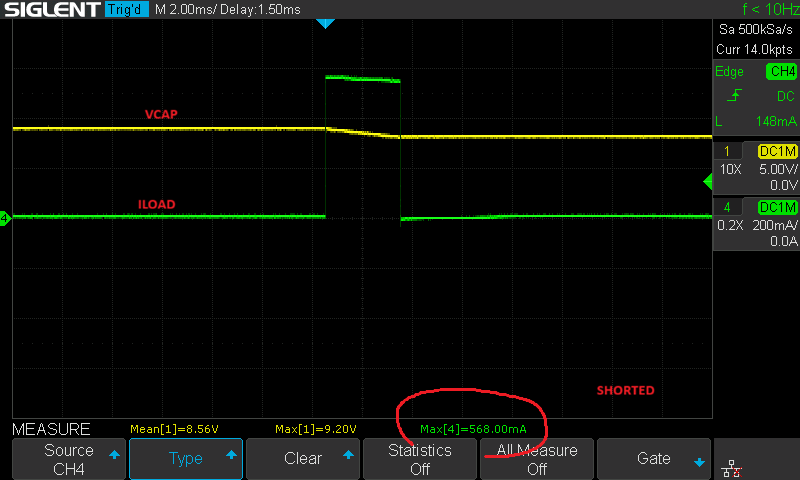
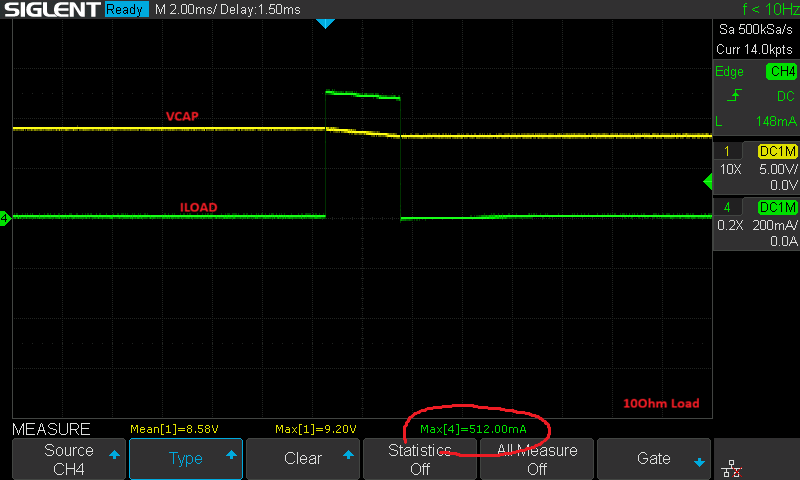
Current Limiter Stress Test
Before connecting the solenoid, I wanted to see if my current limiting circuit could actually limit properly. I used a current sense amplifier and a variable load across OUTA/OUTB. During this test, the boost converter was continuously enabled.
Load Resistor [Ω] Peak Current [mA] 10Ω 512mA 5Ω 552mA SHORT 568mA ![]()
![]()
Temperature Influence
Since this current limiter relies on the Vbe of Q12, I was curious how bad its thermal influence would be. For a quick sanity check, I held a soldering iron set to 750°F (400°C) about 1cm away from Q12, then nearly touching the transistor's SOT-23 package.
- At 1cm: No measurable difference.
- Nearly Touching: The limit dropped by about 50mA.
The expected temperature coefficient for Vbe is around -2mV/°C. In this system, that translates to:
-2mV / 1.35Ω ≈ -1.48mA/°C
Based on the 50mA drop, I only actually increased the die temperature by ~33°C. I suspect the PCB was pulling heat away from the chip better than I originally anticipated (still 33'C seems low). I’ll likely need to revisit this and saturate the whole system at Tamb in the future.
![]()
Driving the Rain Bird Solenoid
Now for the real test: the Rain Bird TBOSPSOL 9V latching solenoid.
Initially, neither the positive nor negative pulses would engage the solenoid. The current limiter (set to 500mA) was working exactly as designed (which was the problem). After checking the coil resistance, I realized it's only 4.7 ohms. At 9V, that’s a theoretical draw of 1.91A! My 500mA ceiling was starving the actuator before it could flip.
To get around this, I shorted R50 with tweezers to bypass the limiter. Afterwards, both positive and negative pulses worked perfectly. I’ll be removing this output current limiter in REV01.
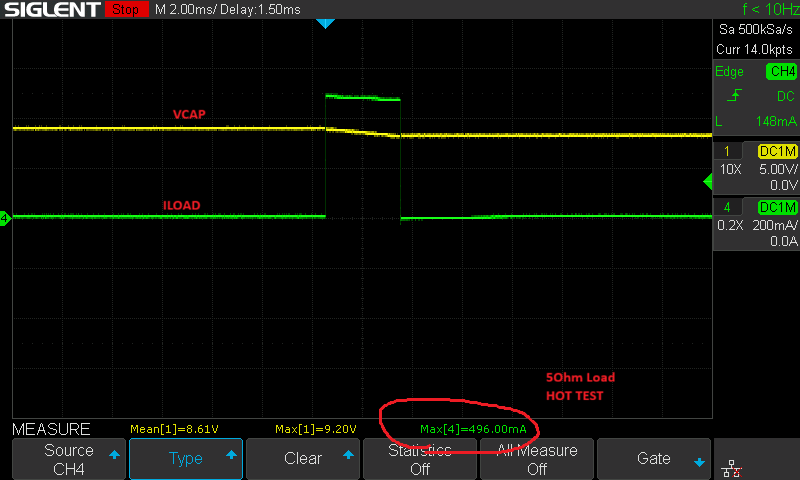
Waveform Breakdown (The "Positive Pulse") Current Limiter Removed
![]()
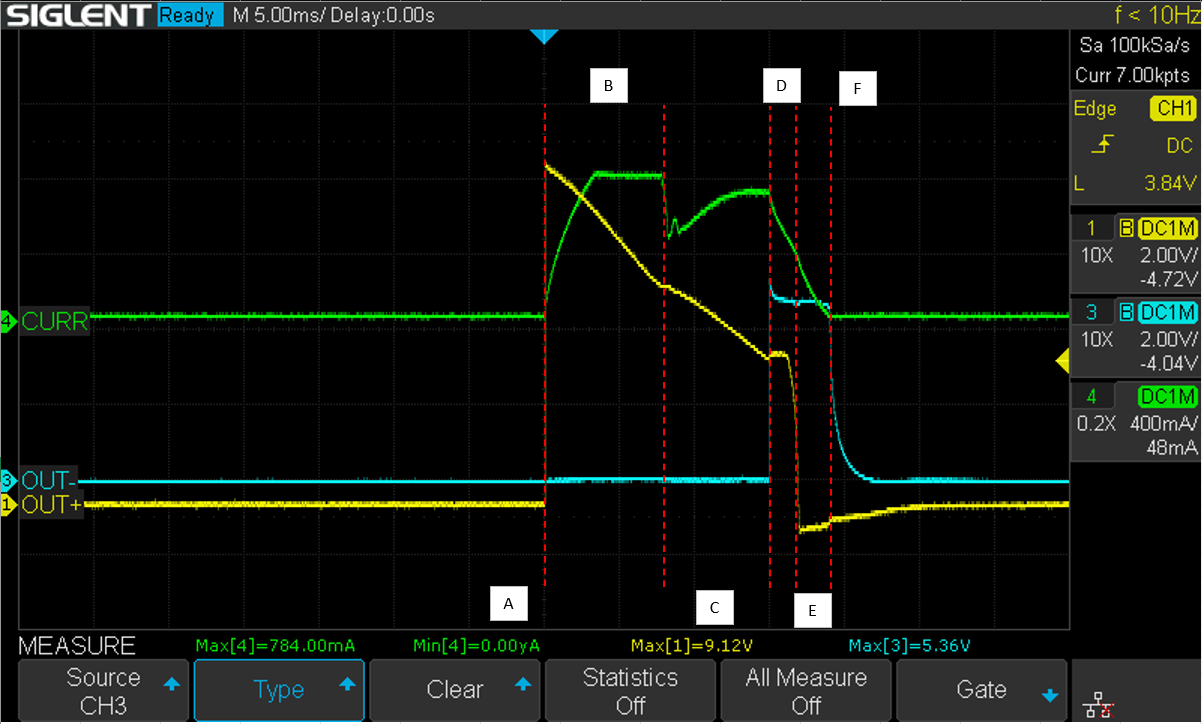
Analyzing the switching cycle reveals some interesting physics in the H-bridge:
- Step A: Idle/Normal operation.
- Step B: Voltage applied. Current ramps up following the inductor current formula. Note: my current sense amplifier is clipping the waveform here.
![]()
- Step C: The "Trip": The current hits the threshold where the solenoid physically moves, momentarily changing the effective impedance of the coil.
- Step D: Both OUTA/B go high, suggesting the H-bridge has been disabled. Note that when OPEN goes low, it switches Q8 faster than Q3 because Q3 relies on the pull-up R39. The bridge disables in two steps.
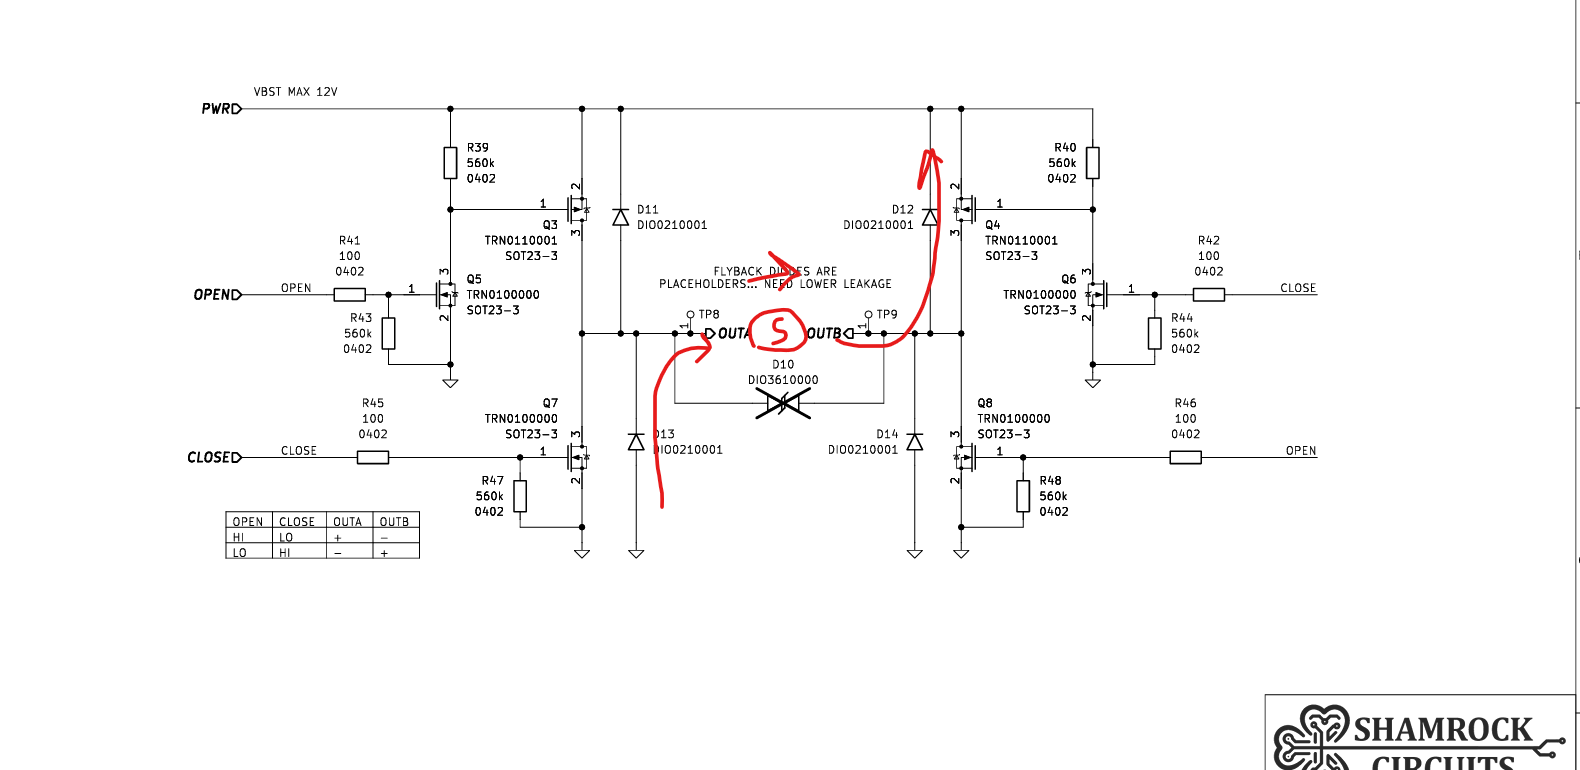
- Step E: Q3 finally turns off. In both Step D and E, the current takes the recirculating path shown below.
![]()
- Step F: Magnetic field energy is depleted. Current hits zero; system returns to steady state.
Final Result
Things look good. The only significant change for REV01 is scrapping the output current limiter. On the current REV00. I included an optional bypass resistor, so testing can continue by adding a jumper resistor. I also should revisit the temperature influence of the current limiter circuit. My results here seem better than I anticipated.
-
Ordering Rev00
12/13/2025 at 17:15 • 0 commentsI wanted to order this earlier in the week so I could debug the hardware over Christmas.... From my experience a JLC PCBA takes 2 weeks to arrive on my doorstep in the best case. I'm not sure what sort of down time they have over the holidays.
![]()
![]()
-
Design Update - PCB & SCH Work
12/08/2025 at 00:57 • 0 commentsWith Christmas PTO fast approaching I thought I’d focus on finishing up some projects. My goal is to order PCBA to tinker with over the holidays.
A quick overview of the “WellWatch” project. This widget essentially just monitors a float switch/gauge and toggles a solenoid accordingly (see the project homepage for why I’m doing this). Some challenges that make this project a bit more interesting is (1) the system will be operating from a Solar cell, and (2) it will support a variety of switching voltages.
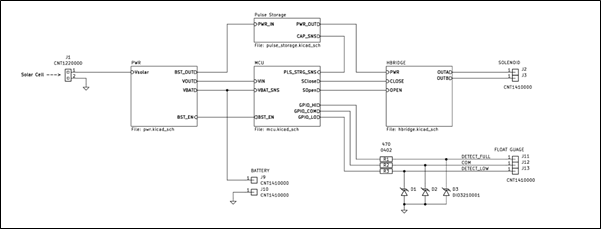
The core blocks of the system are shown below and include Power (PWR), Microcontroller (MCU), Pulse storage, and H-bridge.
![]()
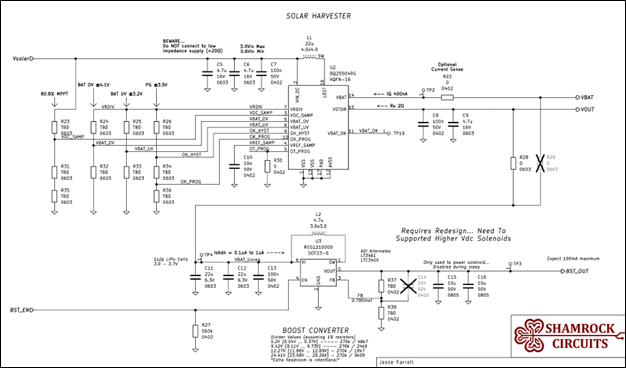
PWR – Harvests energy from solar cell and stores that energy in a single 400mAh LIPO cell. Battery voltage is exposed on VBAT, and a regulated version of VBAT is exposed on VOUT. When BST_EN is asserted, BST_OUT generates between 5 – 24V depending on the hardware configuration.![]()
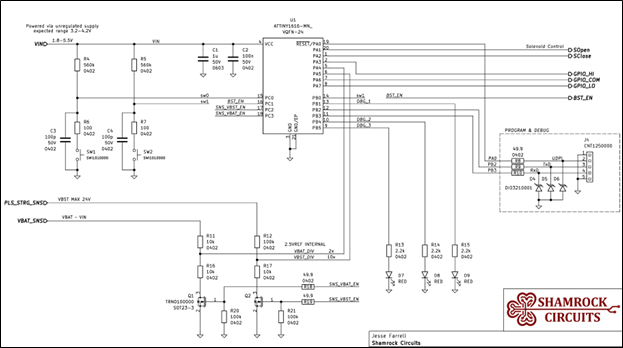
MCU - The microcontroller block contains an ATTINY1616 which; controls the H-bridge circuit via SOpen and SClose (solenoid open/close), senses the state of the float switch via GPIO_HI, GPIO _COM, and GPIO _LO, and measures VBAT as well as the pulse energy storage capacitors.
![]()
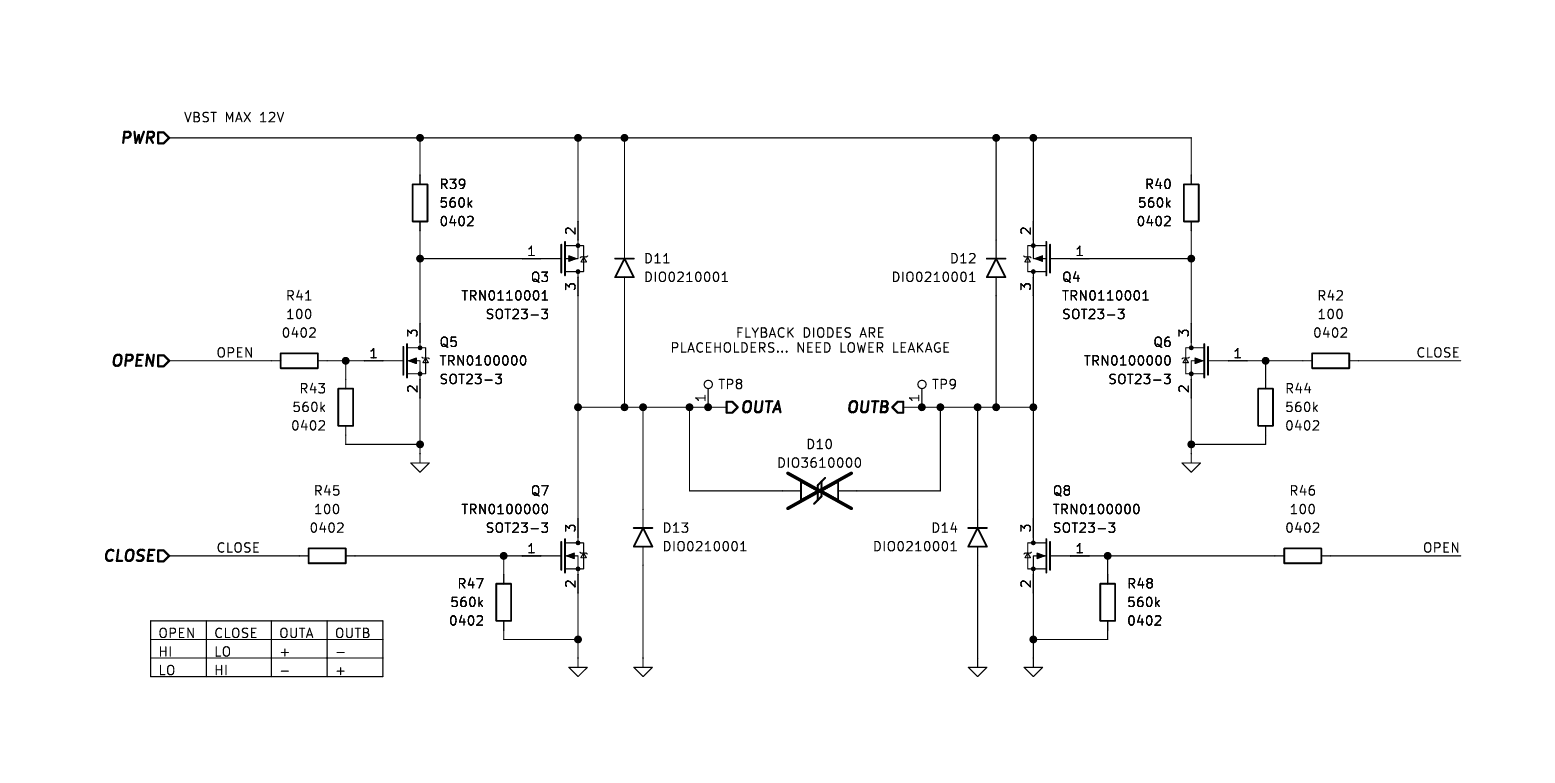
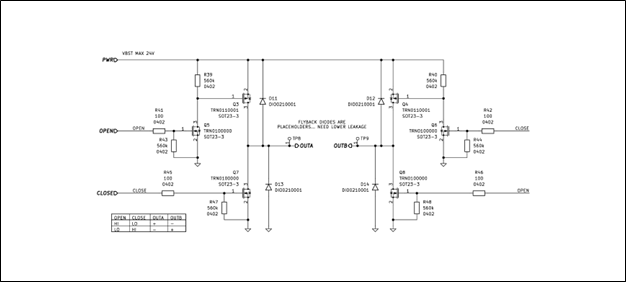
H-Bridge – This circuit is fairly generic. The only slight deviation from a jellybean H-bridge is the addition of Q6 and Q5 which allows me to control all 4 driver FETs with two signals, OPEN and CLOSE. I still need to fine tune my component selection to reduce the leakage presented to the PWR input.
![]()
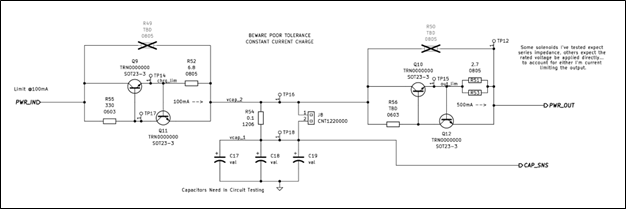
Pulse Storage – This is another energy storage circuit (not the LIPO battery!!) which provides the 50ms (typ) pulse of current required to toggle a latching solenoid. The schematic shows two active current limiting circuits. Capacitor charge current is limited by Q11/Q9, and capacitor discharge current is defined by Q10/Q12. Charge current will be configured to align with the capabilities of the boost converter, and the discharge current will need to be configured for the selected solenoid.
![]()
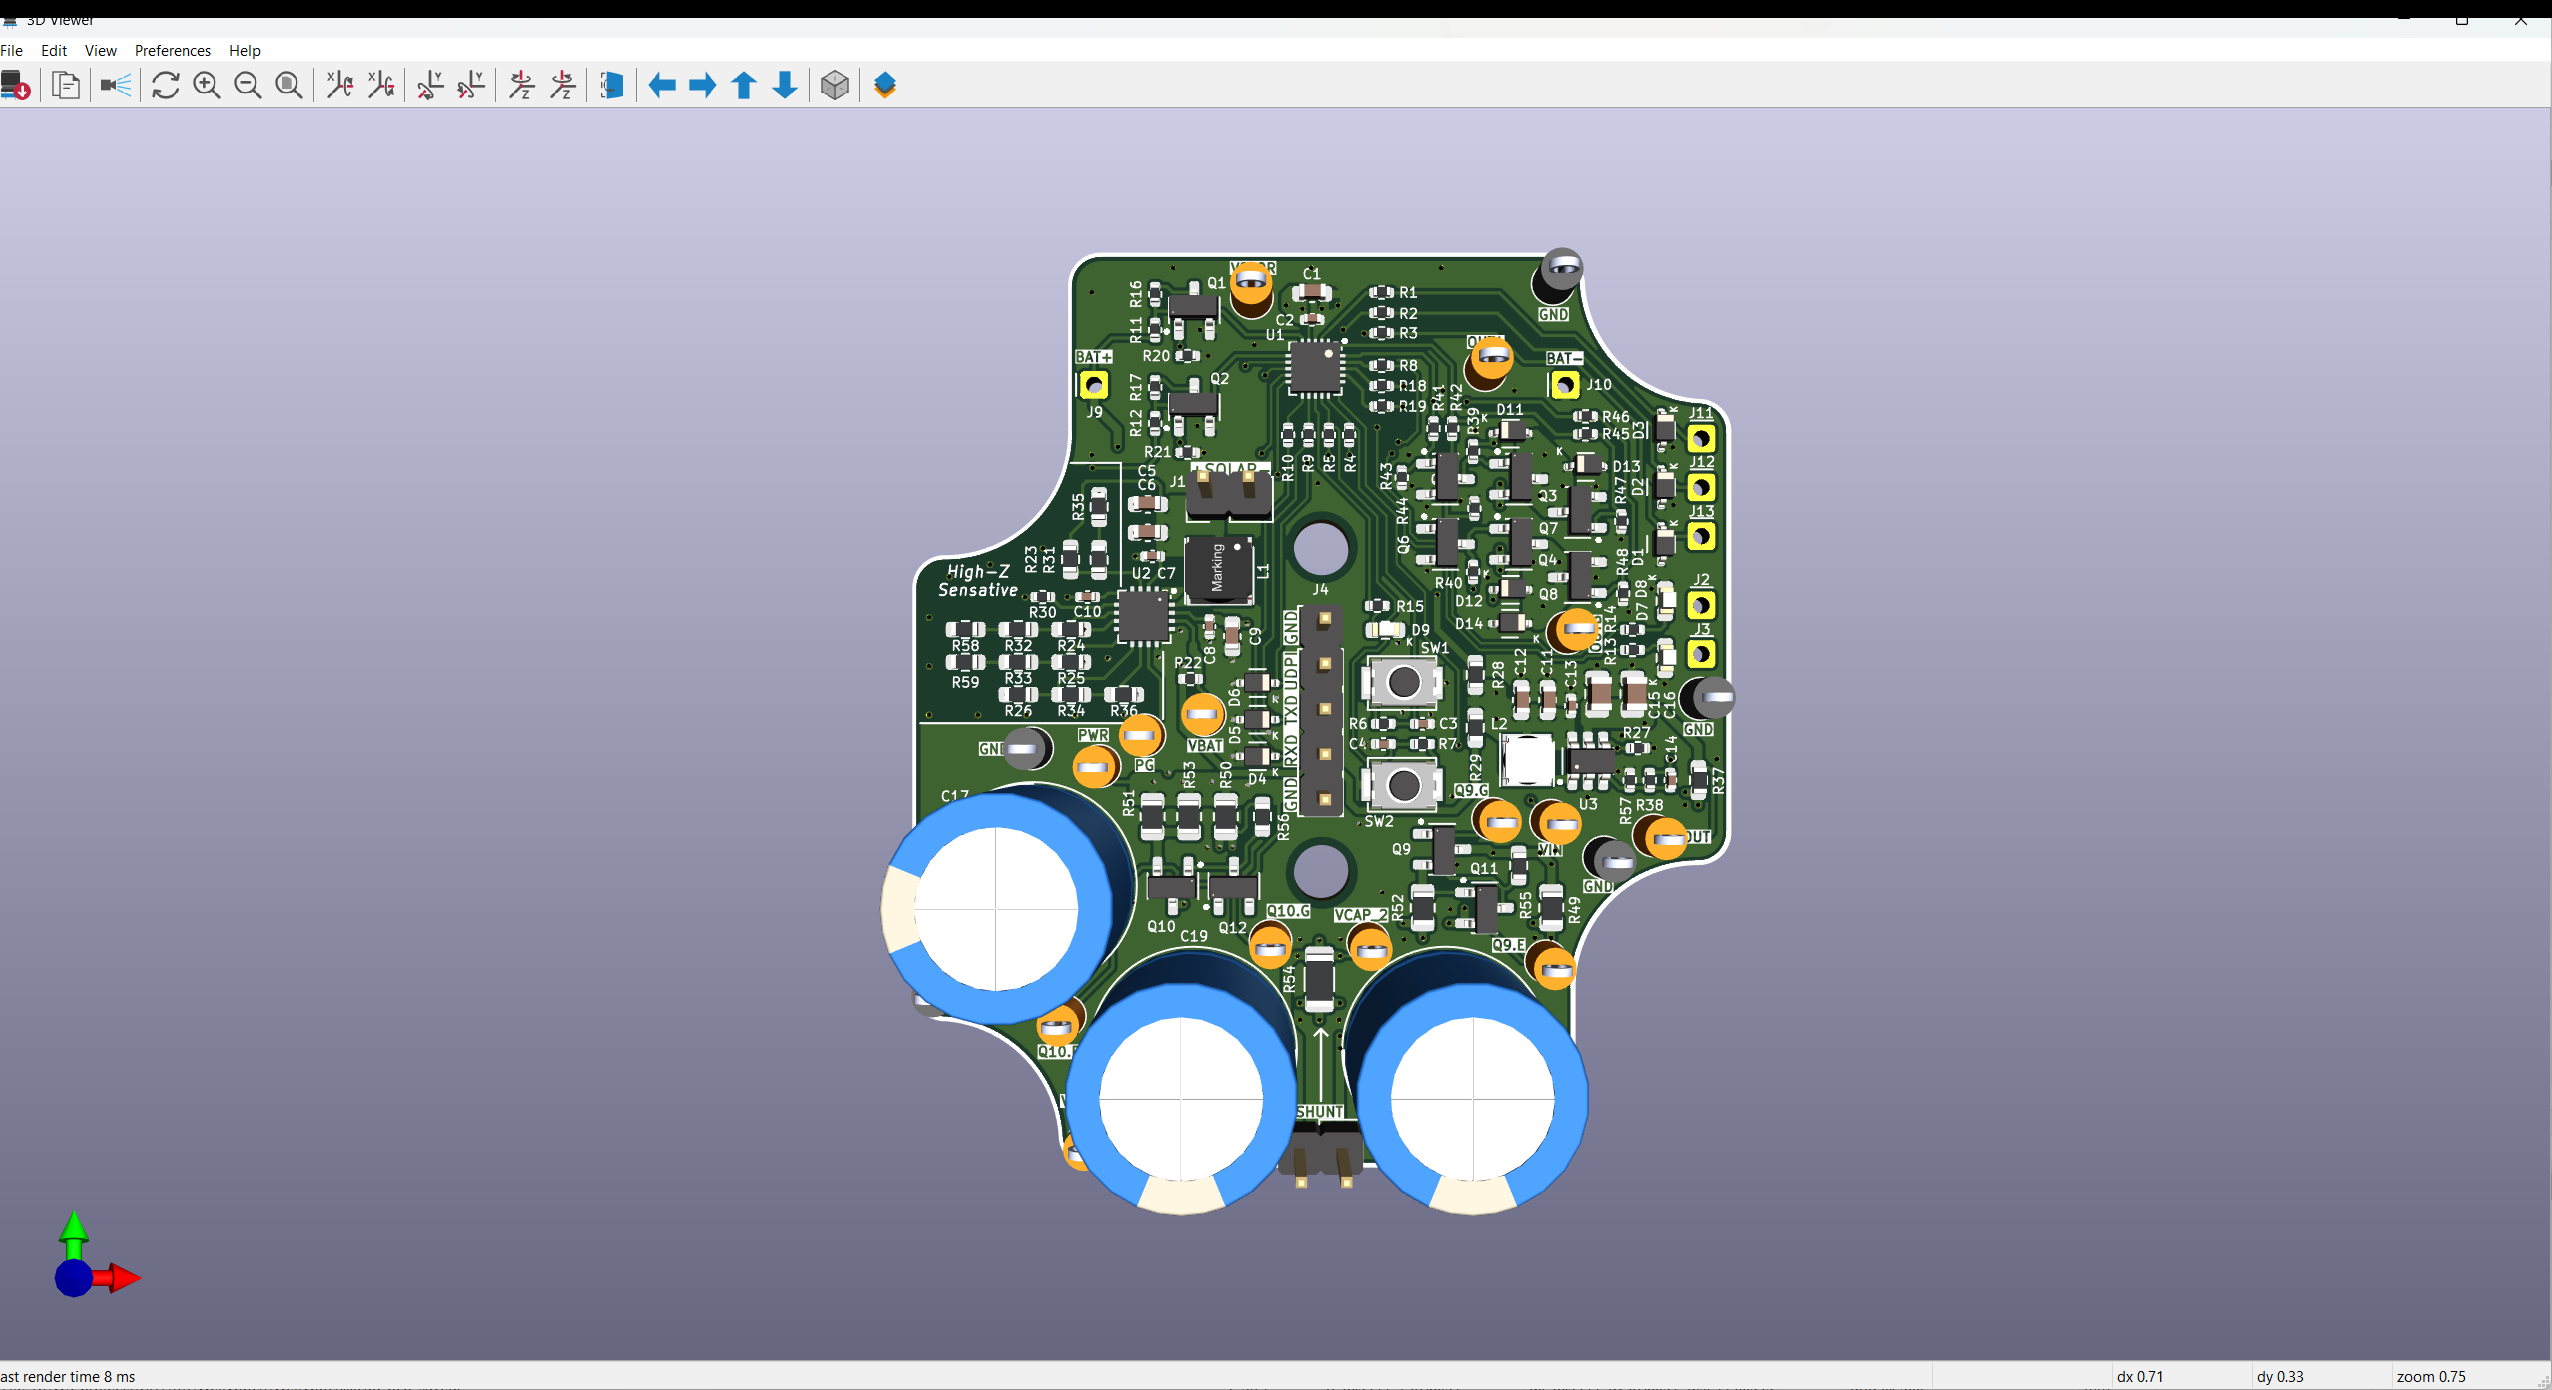
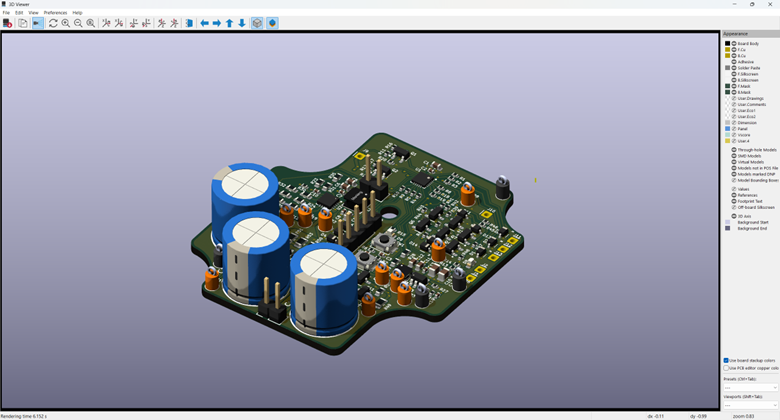
Anyways… that’s the circuit and here’s the PCB I developed this weekend. I’m just working on some final cleanup. I also need to add a few extra 0ohm resistors to isolate each circuit block. Jumpers are great for debugging and general V&V work for an early design.
![]()
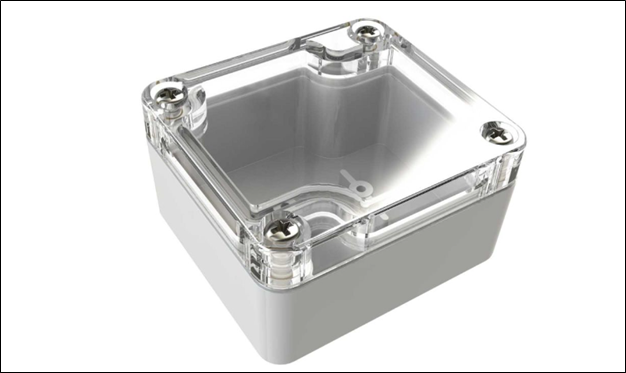
One last thing… If you’re wondering why I set the board outline above, plan to assemble the project in this enclosure from polycase (https://www.polycase.com/wc-20). The LIPO battery is harvested from an old “disposable” vape. My current plan is to rest it ontop of the northern end of the PCB (TPs will need to be removed later). I still am somewhat debating using a LIC instead of a LIPO, but for now I’m prototyping with a LIPO.
![]()
-
Lithium-Ion Capacitor, Feasibility
07/14/2025 at 02:51 • 0 commentsIts summer again, so the priority of this project has once again been bumped to the top of my list. Funnily enough the prototype project started just last week one year ago… in my defense though I was busy last weekend, if not for that maybe I would have done my first revisit post EXACTLY one year later.
I fell deep into a power budget rabbit hole this weekend...
I’ve been interested in hybrid capacitor technologies for some time now, and this project presented a perfect opportunity to evaluate one on paper: the Lithium-Ion Capacitor (LiC). Compared to conventional lithium polymer batteries, LiCs offer some intriguing benefits. However, their primary drawback is energy density, which is lower than that of a lead-acid battery.
My goal in this post is to investigate the feasibility of using a LiC for energy storage in this project.
Modeling the System
To evaluate whether the lower energy density, and therefore reduced capacity, of a Li-Ion capacitor is feasible for my application, I needed to model the stored energy in the system over a full 24-hour cycle.
The model had to be detailed enough to capture subtle droops in stored energy. This allows me to then assess voltage margins ensuring that the system remains operational throughout the day. In particular, I’m focused on tracking the minimum voltage across the energy storage element.
Solar Subsystem
Irradiance Waveform
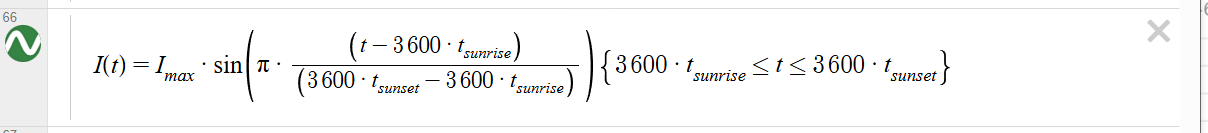
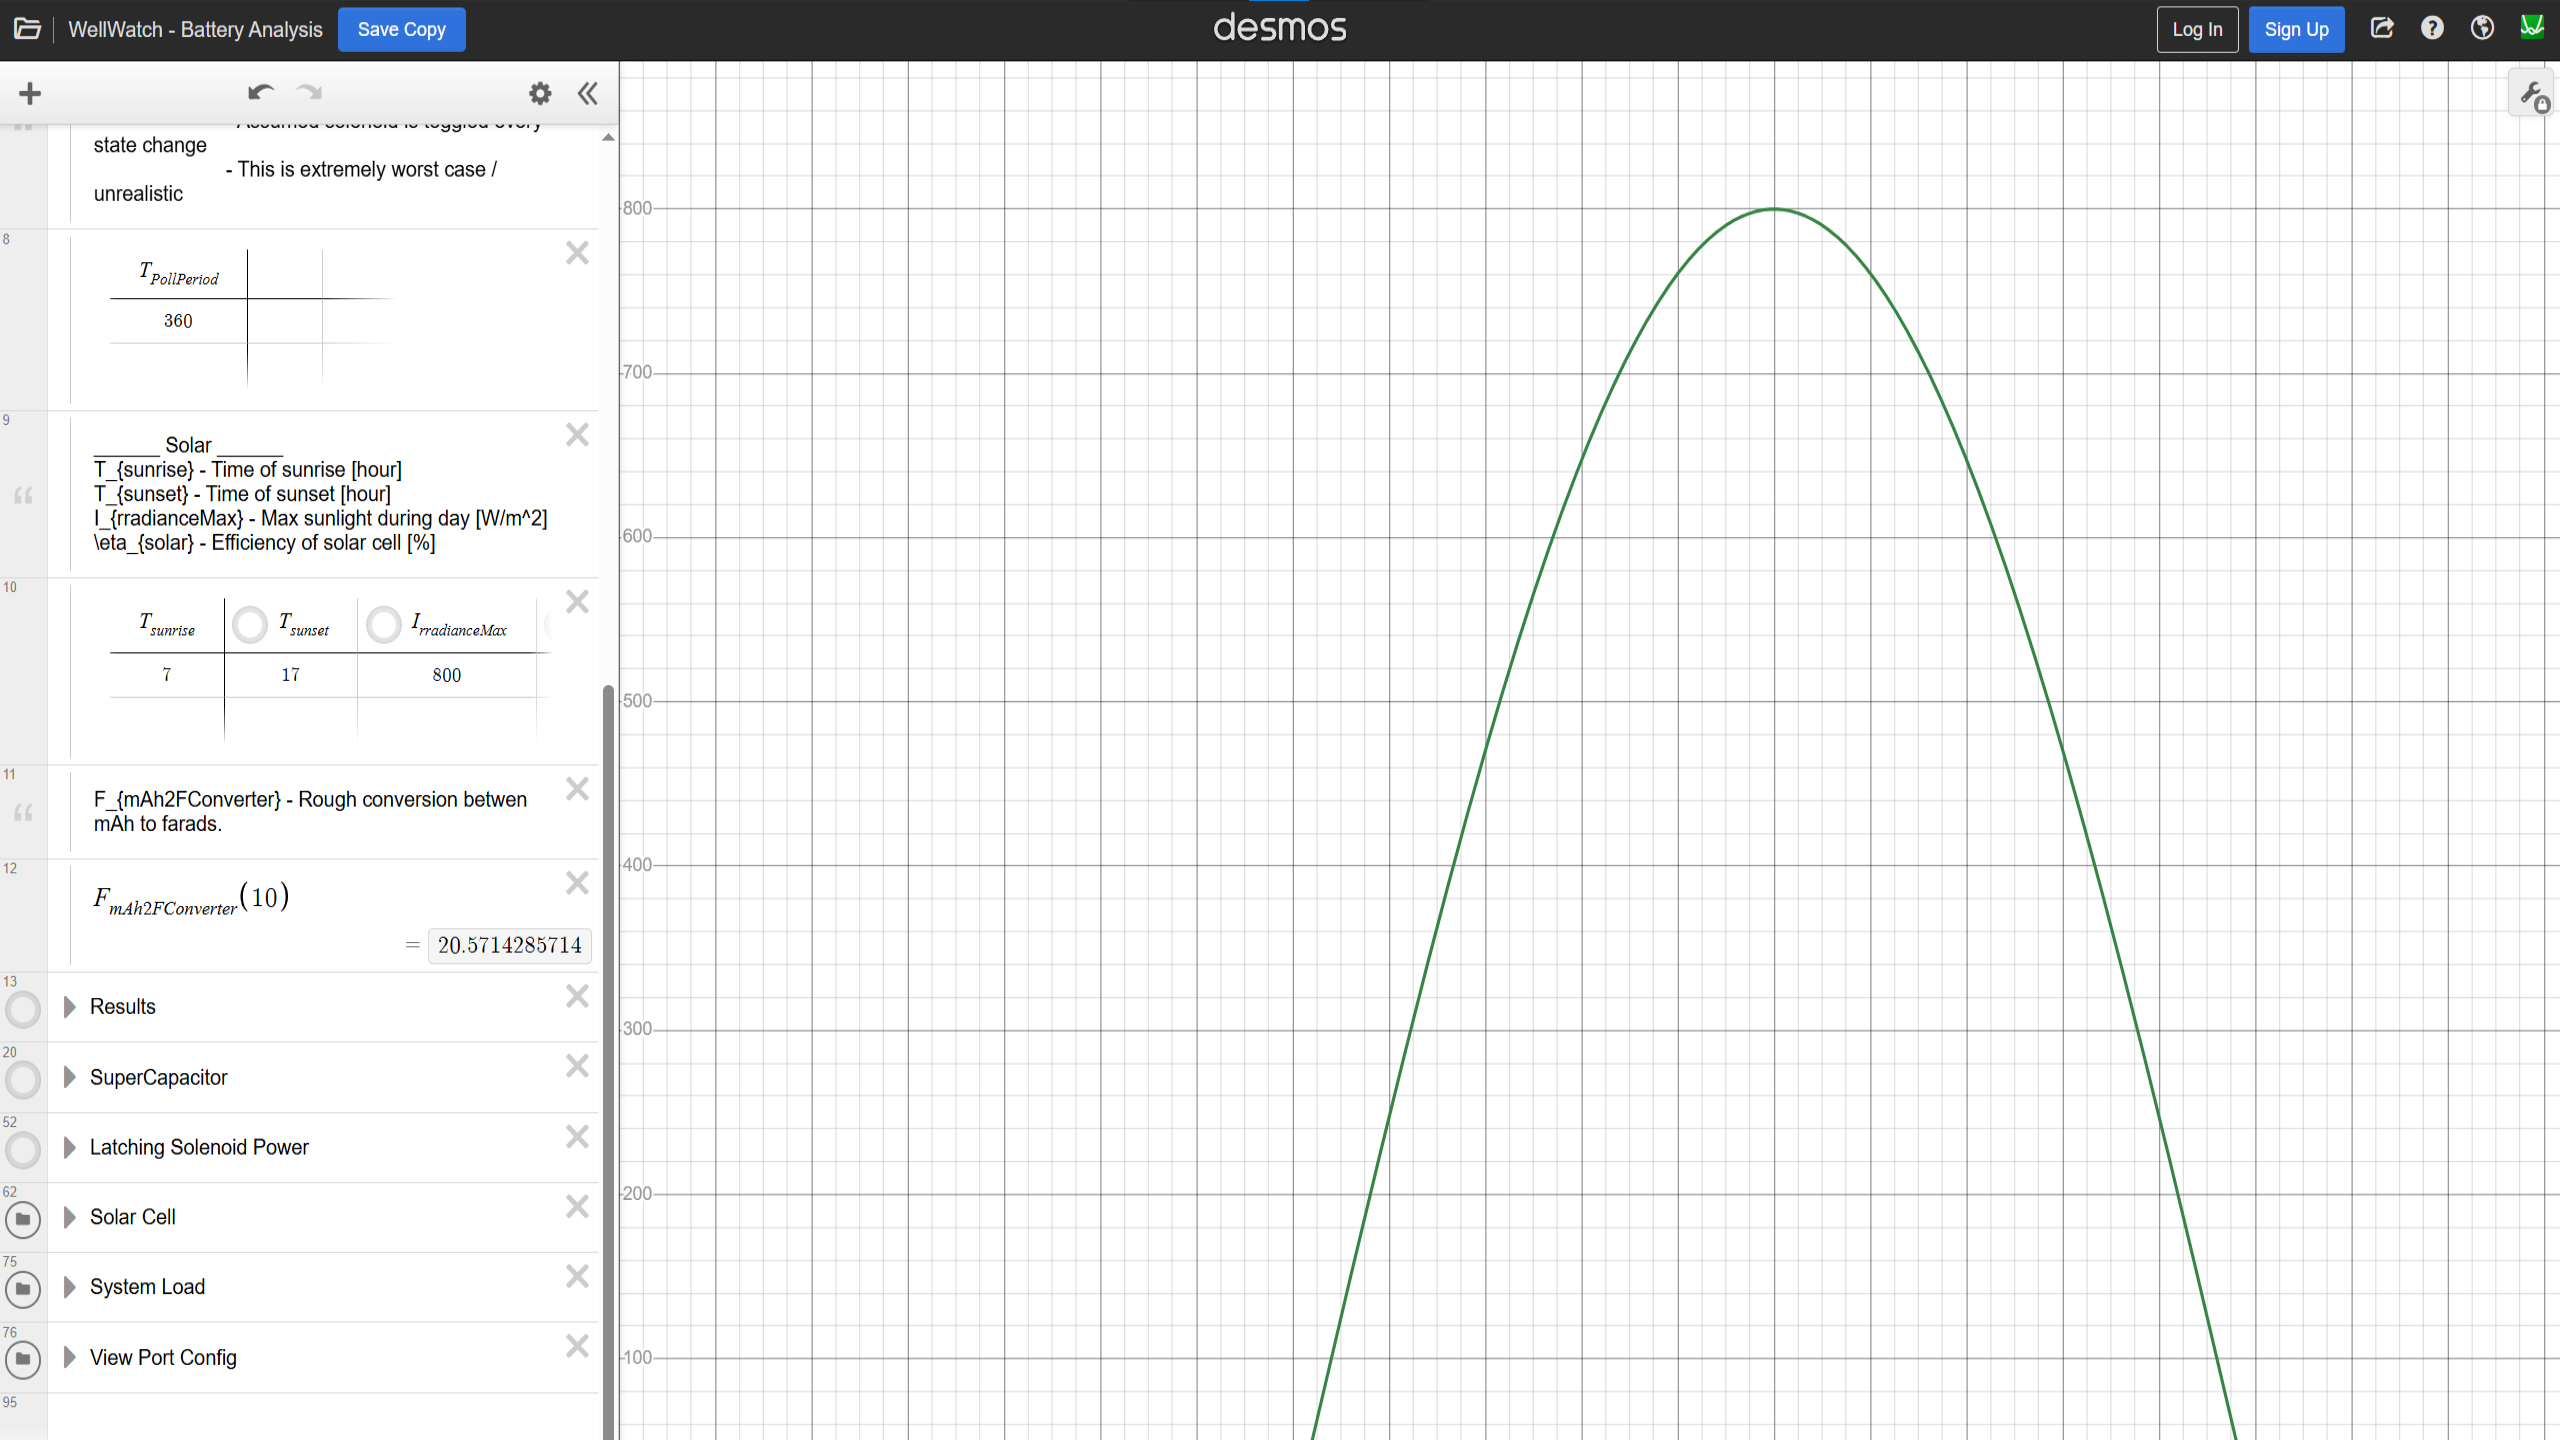
To begin modeling the solar input, I approximated the irradiance over a 24-hour period using I(t). Using a sunrise at 7 AM, sunset at 5 PM, and a peak irradiance of 800 W/m², resulting in the below plot…
![]()
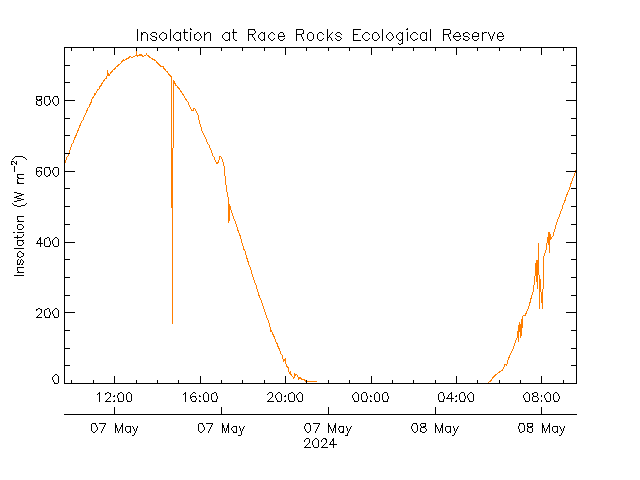
![]()
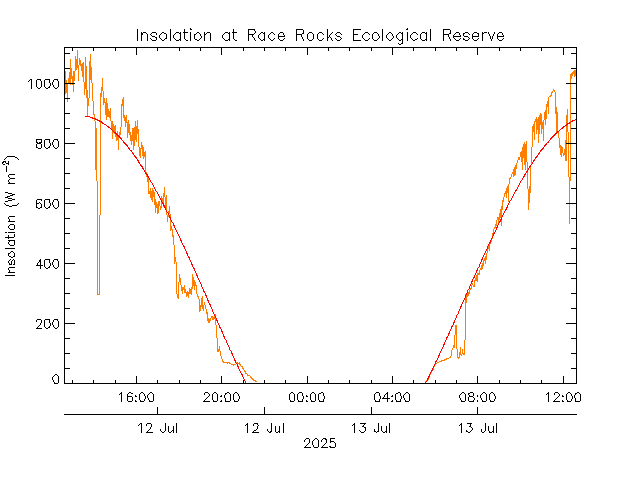
To validate the model, I compared it to real-world data from a nearby Ecological Reserve. The overall trend aligns well (Albeit less noisy).
![]()
From Irradiance to Power
Next, I converted the irradiance to instantaneous power using the specs of the SP-53X30-4-DK solar panel. While the datasheet reports its dimensions as 53×30 mm, the effective area seems to be closer to 48×25 mm. The devices maximum output power is 0.21W, and its efficiency is 18.6%.
The instantaneous power equation becomes….
![]()
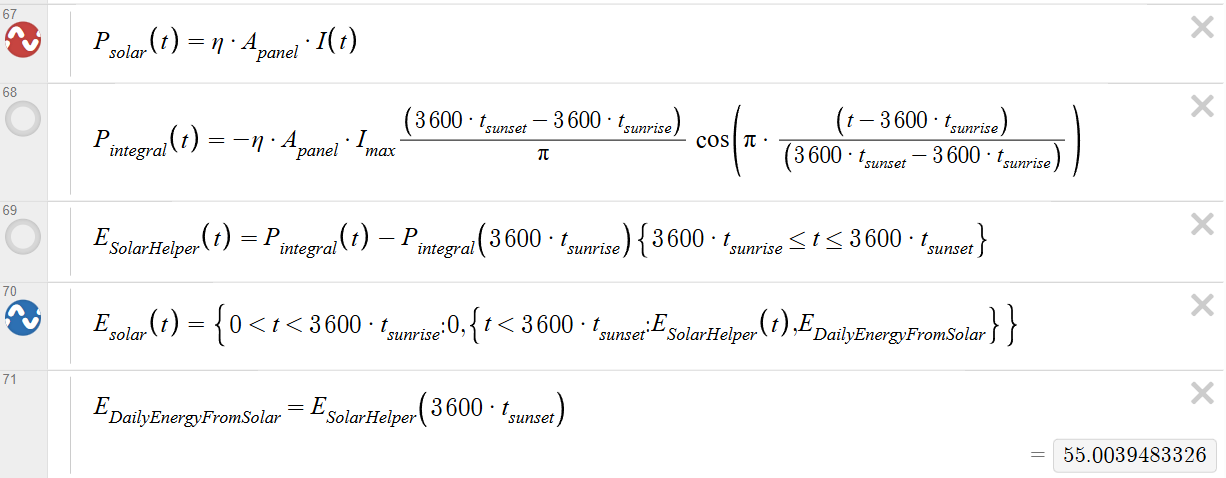
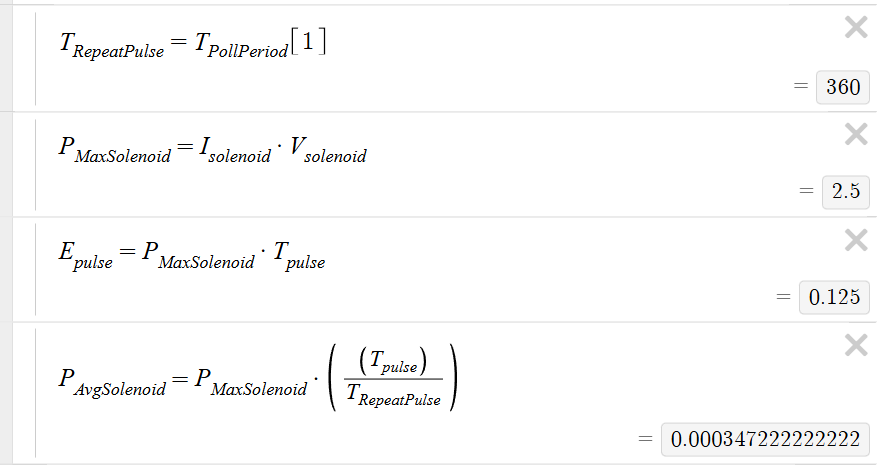
Solar Power Over Time (Energy)
The energy provided by the solar panel will be the area under the curve of P_{solar}. Desmos has an integration function, but I find it causes the system to lag badly. Doing this by “hand” I get the equations below. We have to be careful with the start and stop points of our integration, since the solar panel will (obviously!) only provide power from sunrise to sunset.
![]()
![]()
Model Assumptions
It’s important to note the approximations made by this model. Critically, I’ve ignored the efficiency of the energy harvester IC, and I’ve ignored several nuances of the solar panel such as thermal influence and MPPT (maximum power point tracking).
These assumptions are tolerable for early-stage feasibility, but would need to be revisited for the final design (or just tested in the field).
Solenoid SubsystemNow that we’ve characterized the incoming solar power, let’s turn our attention to the main energy consumer, the solenoid subsystem.
Every <to be determined> seconds, the system updates its state. During this update it sends a 50 ms pulse to either open or close the solenoid. Each time drawing 2.5 W, which equates to 0.125 J of energy.
Assumptions
Luckily modeling this system is very simple, so long as we allow ourselves a few assumptions. Assuming the energy required for a single pulse (0.125J) is insignificant compared to the total energy in the system, then we can say that the drop in energy, and more importantly voltage, from a single pulse will not appreciably affect the system.
Let’s test that assumption with some numbers…
Assuming 1F at 1.5V, a single solenoid pulse will drain the stored energy to 1J (0.5*C*V^2 - 0.125J), which will result in a drop from 1.5V to 1.41V. Increasing the capacitor to 10F, would reduce the change in voltage to 1.49V. This assumption seems reasonable so long as the effective capacitance is greater than ~10F.
The solenoid subsystem also includes a boost converter, the efficiency of this boost converter has not been incorporated into this model yet, nor has its quiescent current. For now, we will assume the impact is minor.
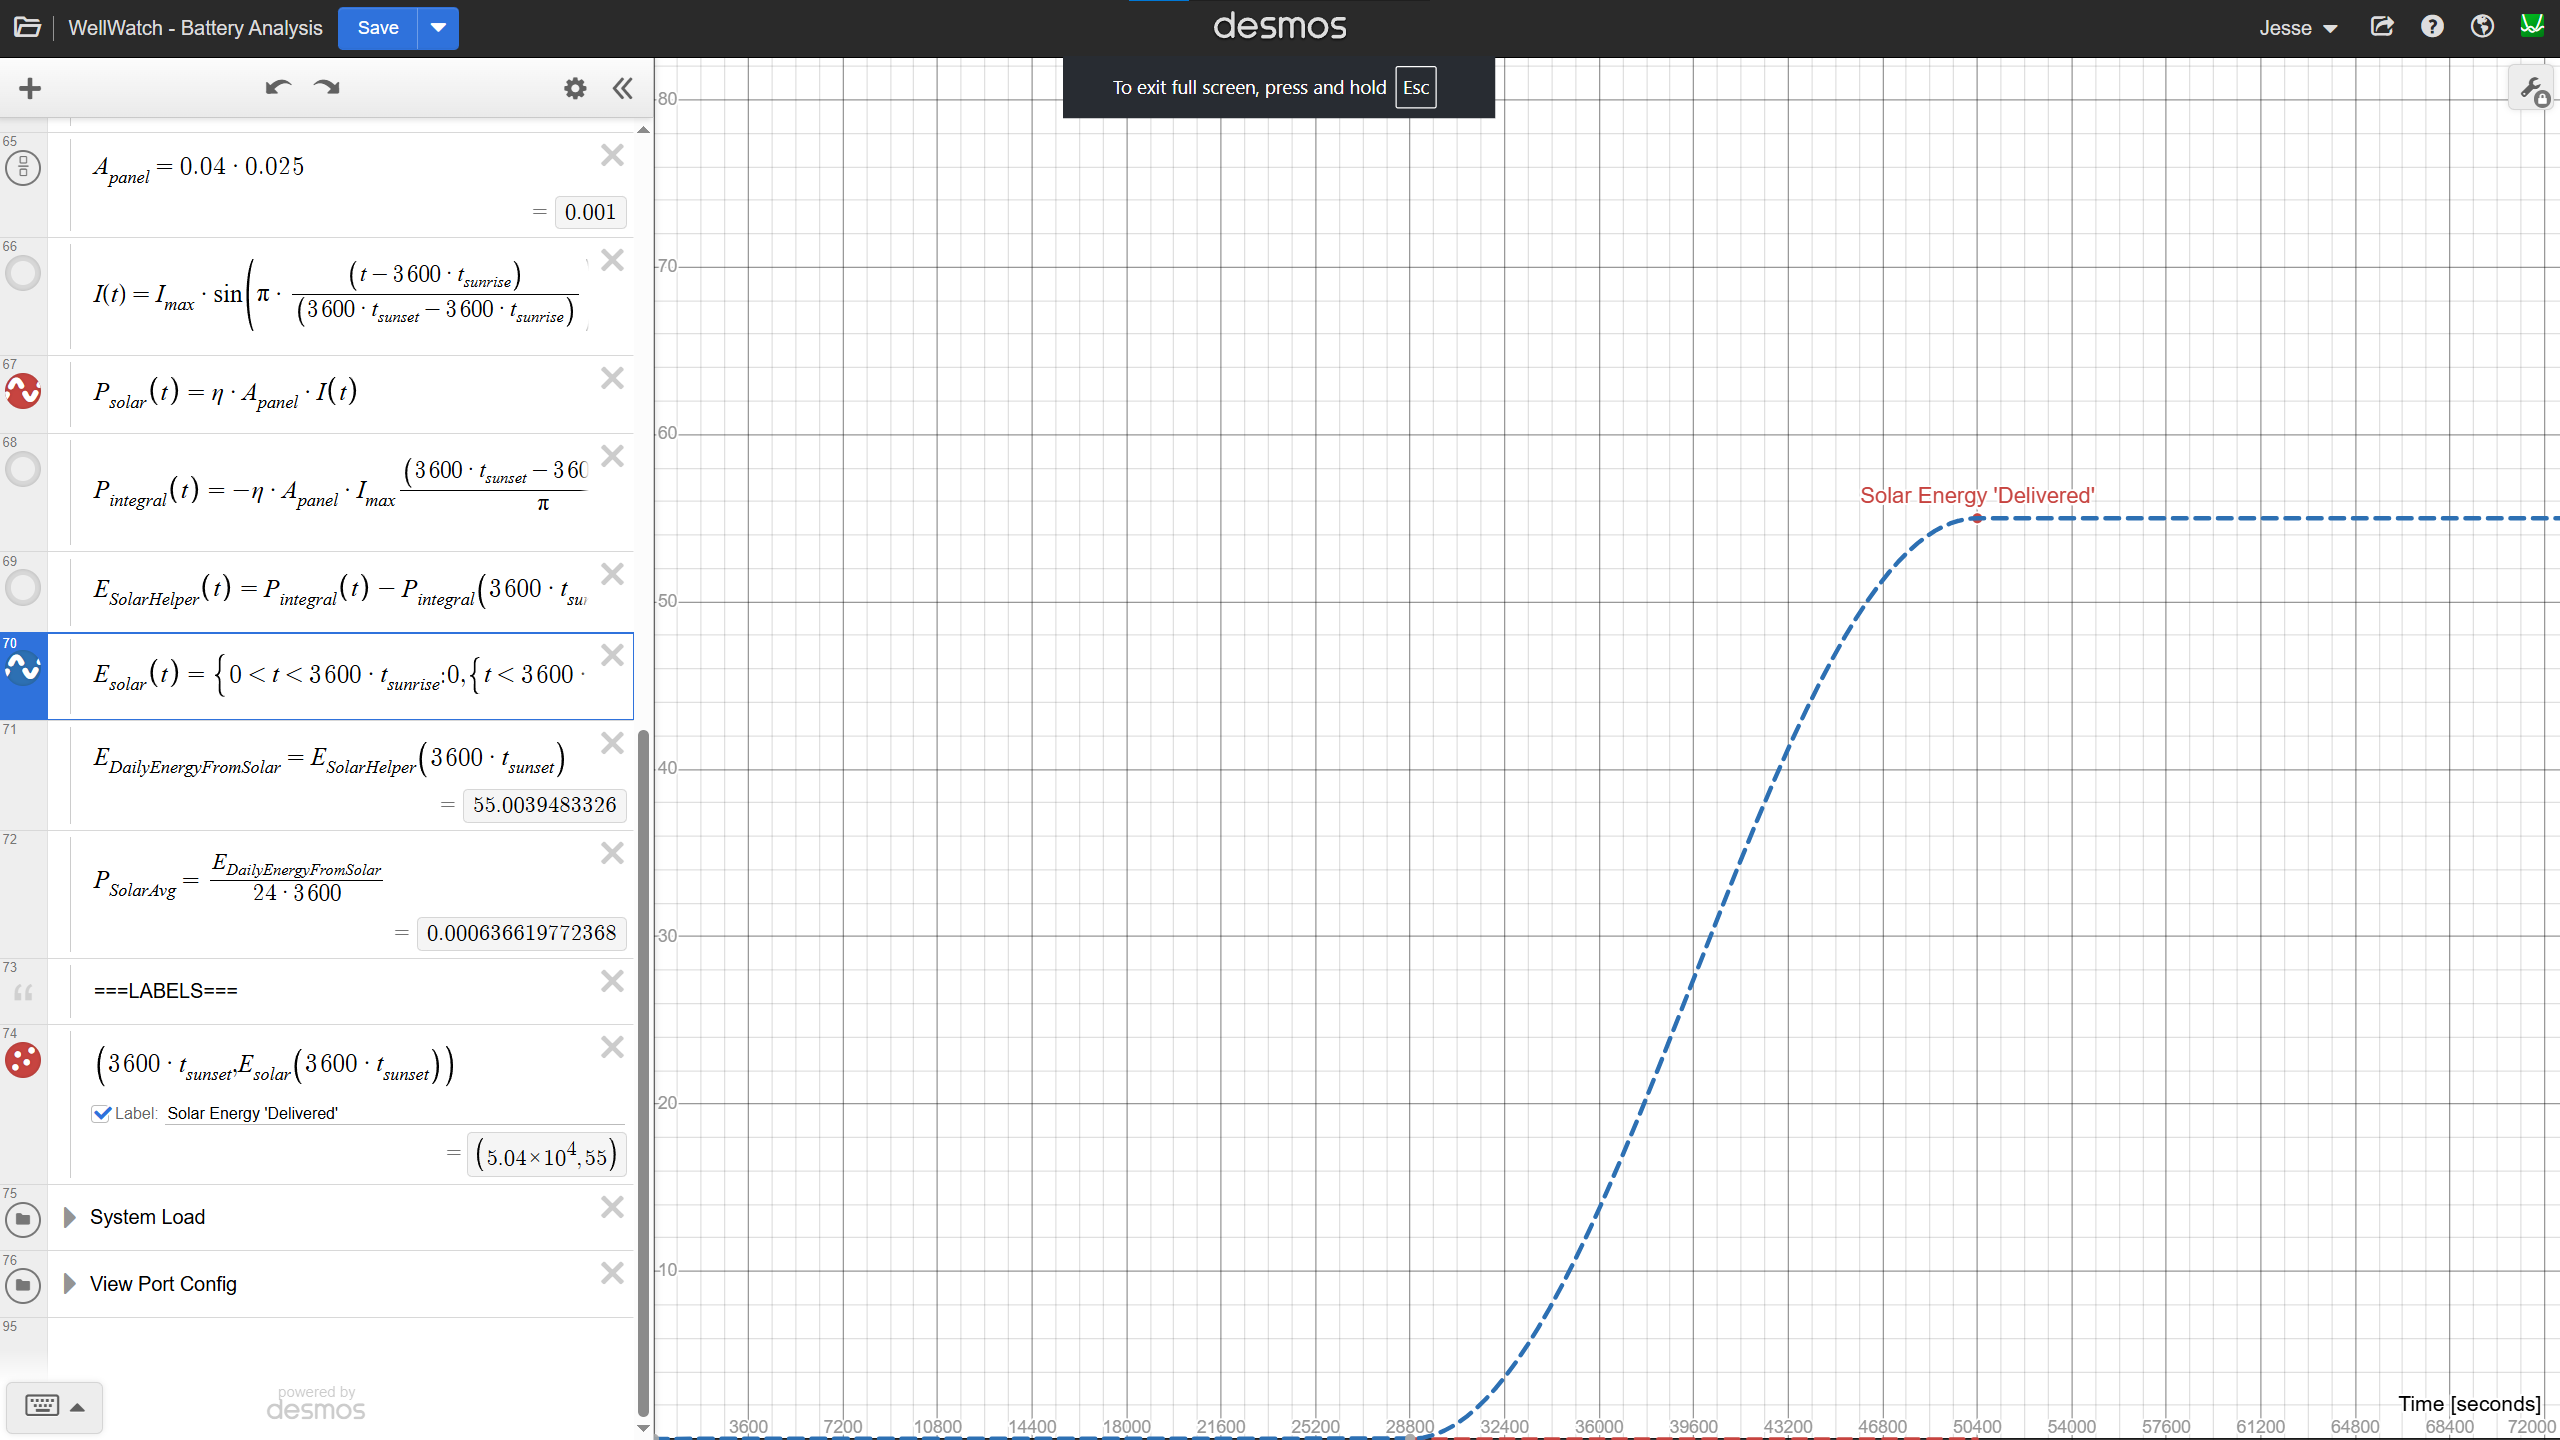
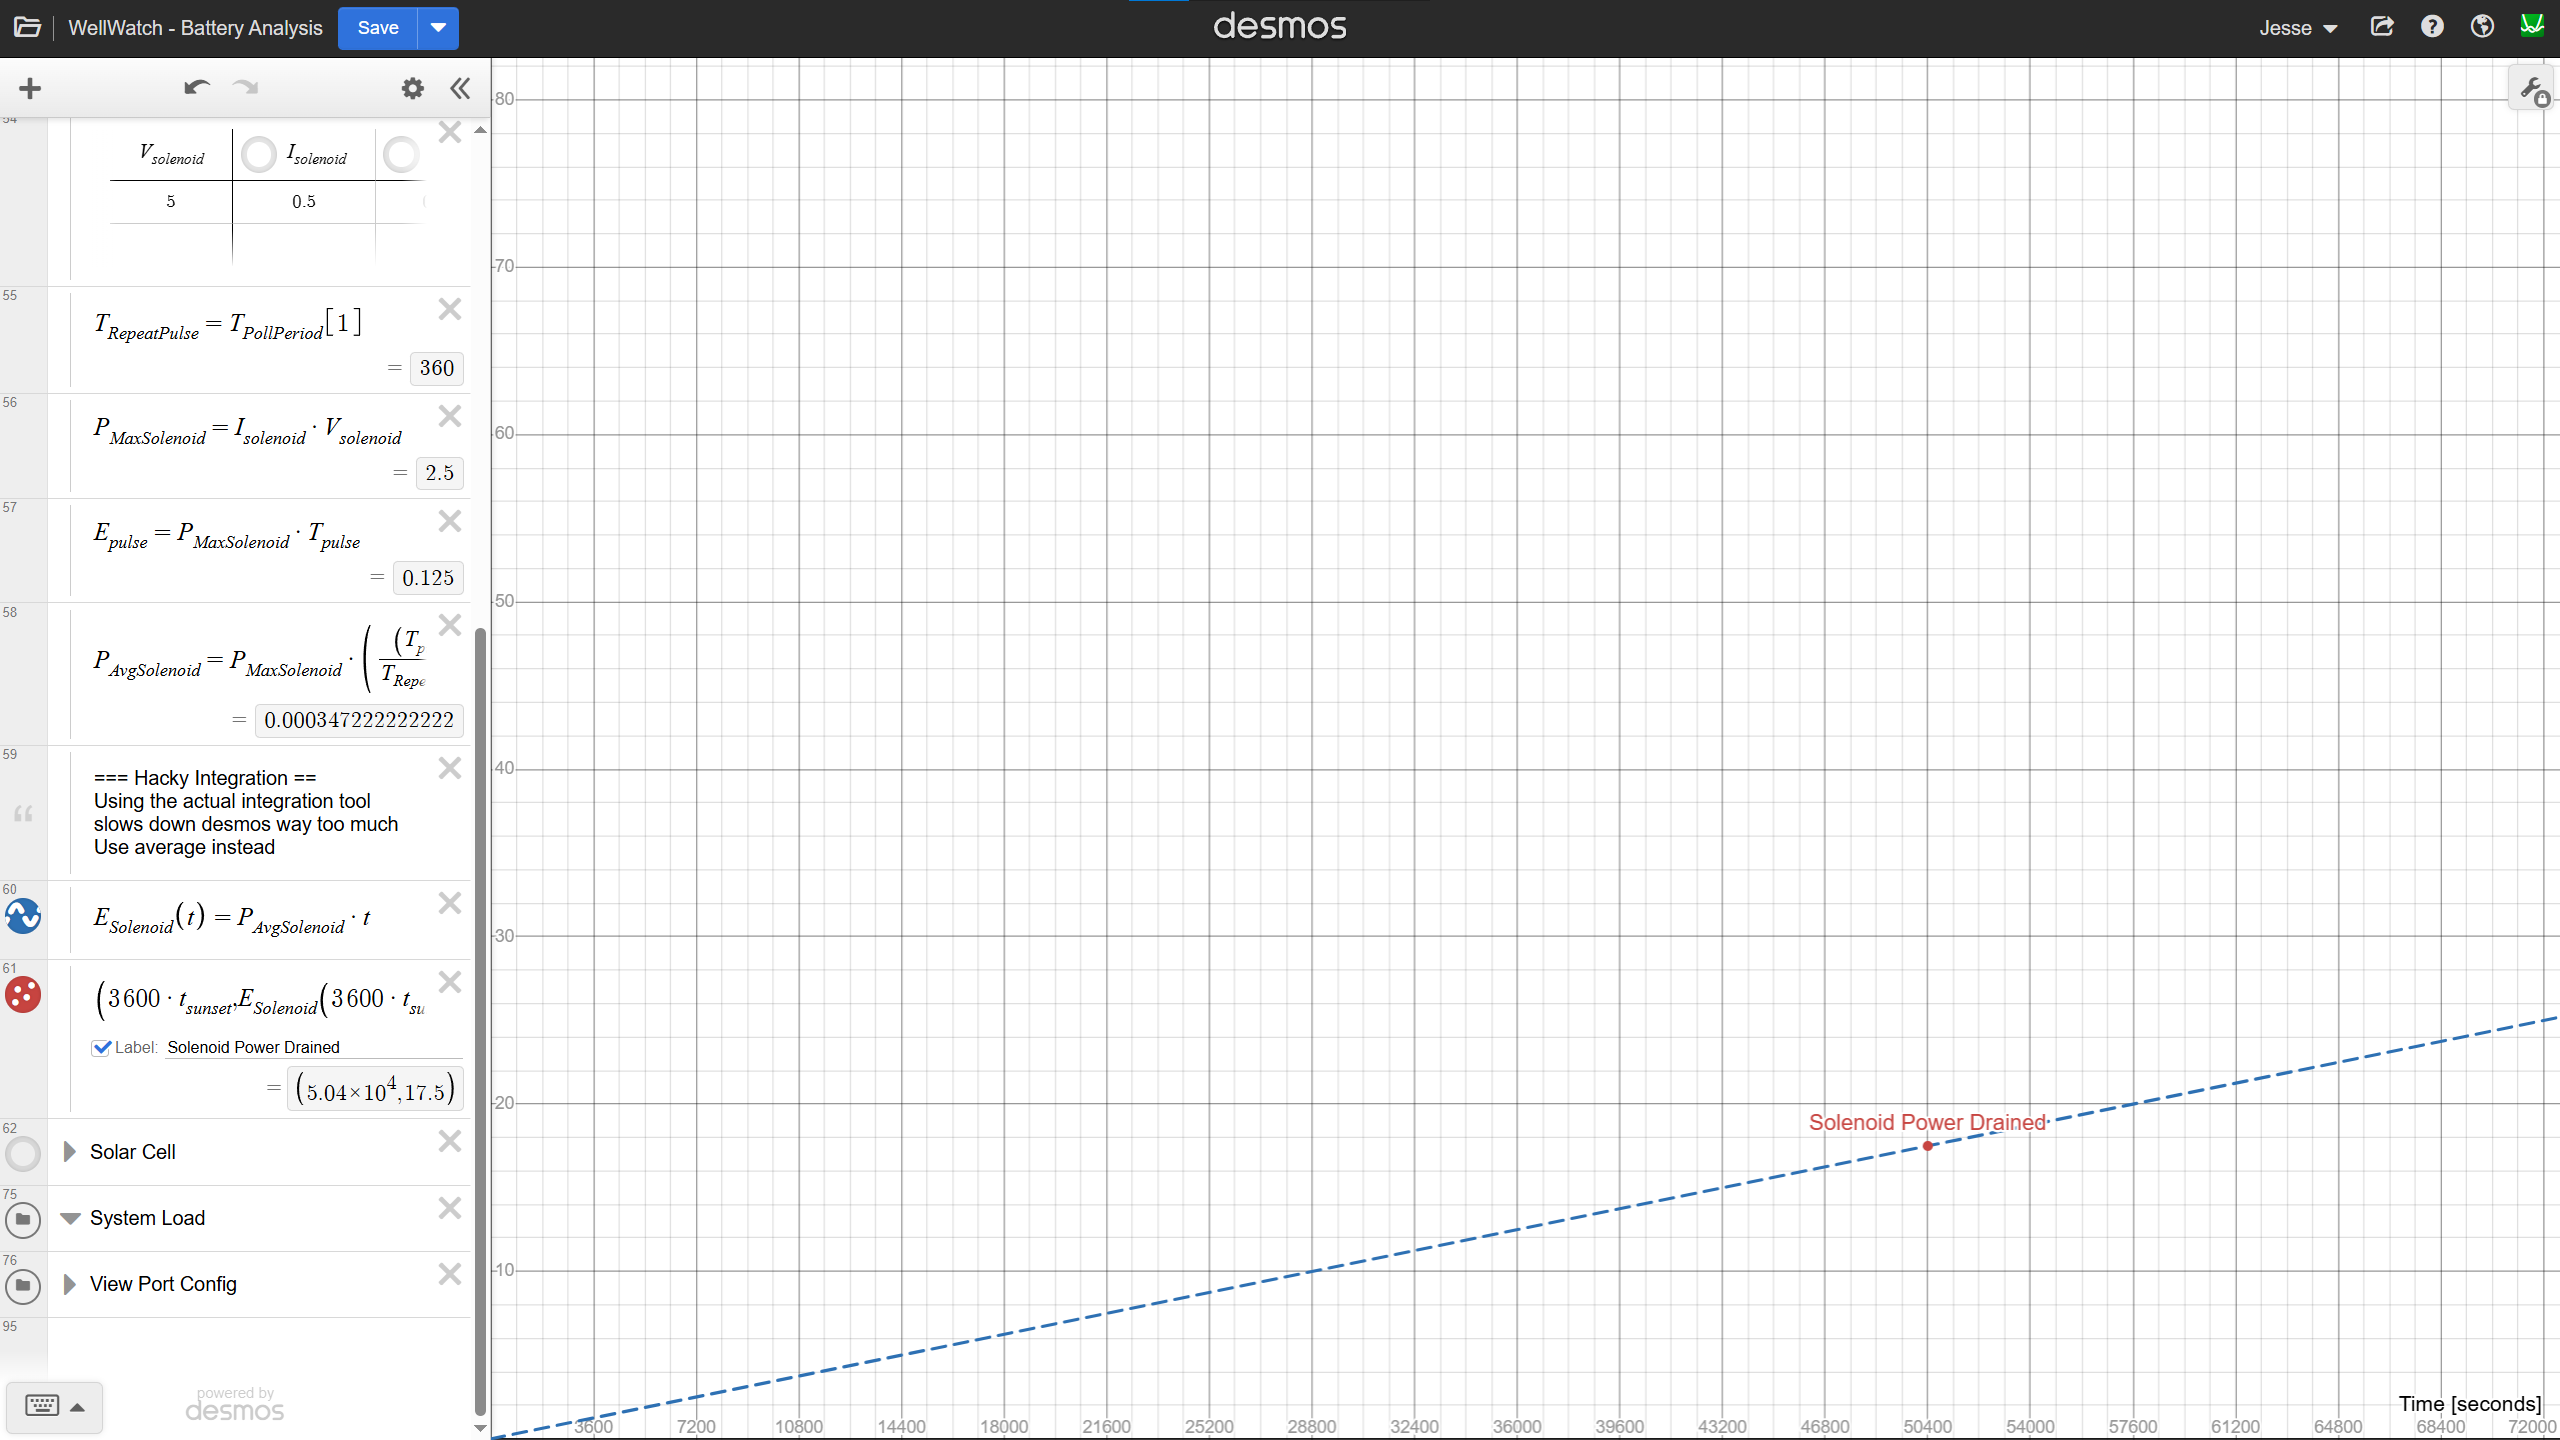
Average Power and Energy
With our assumptions, we can model the average power draw of the solenoid subsystem as…
![]()
The average energy consumed from time=0, to time t is then…
E_{Solenoid}(t)=P_{AVG}*(t)
This produces a predictably uninteresting waveform shown below.
![]()
Energy Storage SubsystemWe now have the two key subsystems modeled in the graphs below. Since everything has been defined as a function of time, it’s easy to add or subtract them in the tool. We can also now calculate the energy in our battery as E(t).
![]()
![]()
Voltage Limits and Capacity Boundaries
Of course, this model assumes an ideal world where energy can increase or decrease without bound. In reality, the energy storage system is constrained by voltage limits, both of the storage device and the circuits powered by it.
Knowing these voltage limits allows us to calculate the maximum and minimum storage potential. Plotting these limits we see the following, when using a 5 Farad capacitor for illustration.
![]()
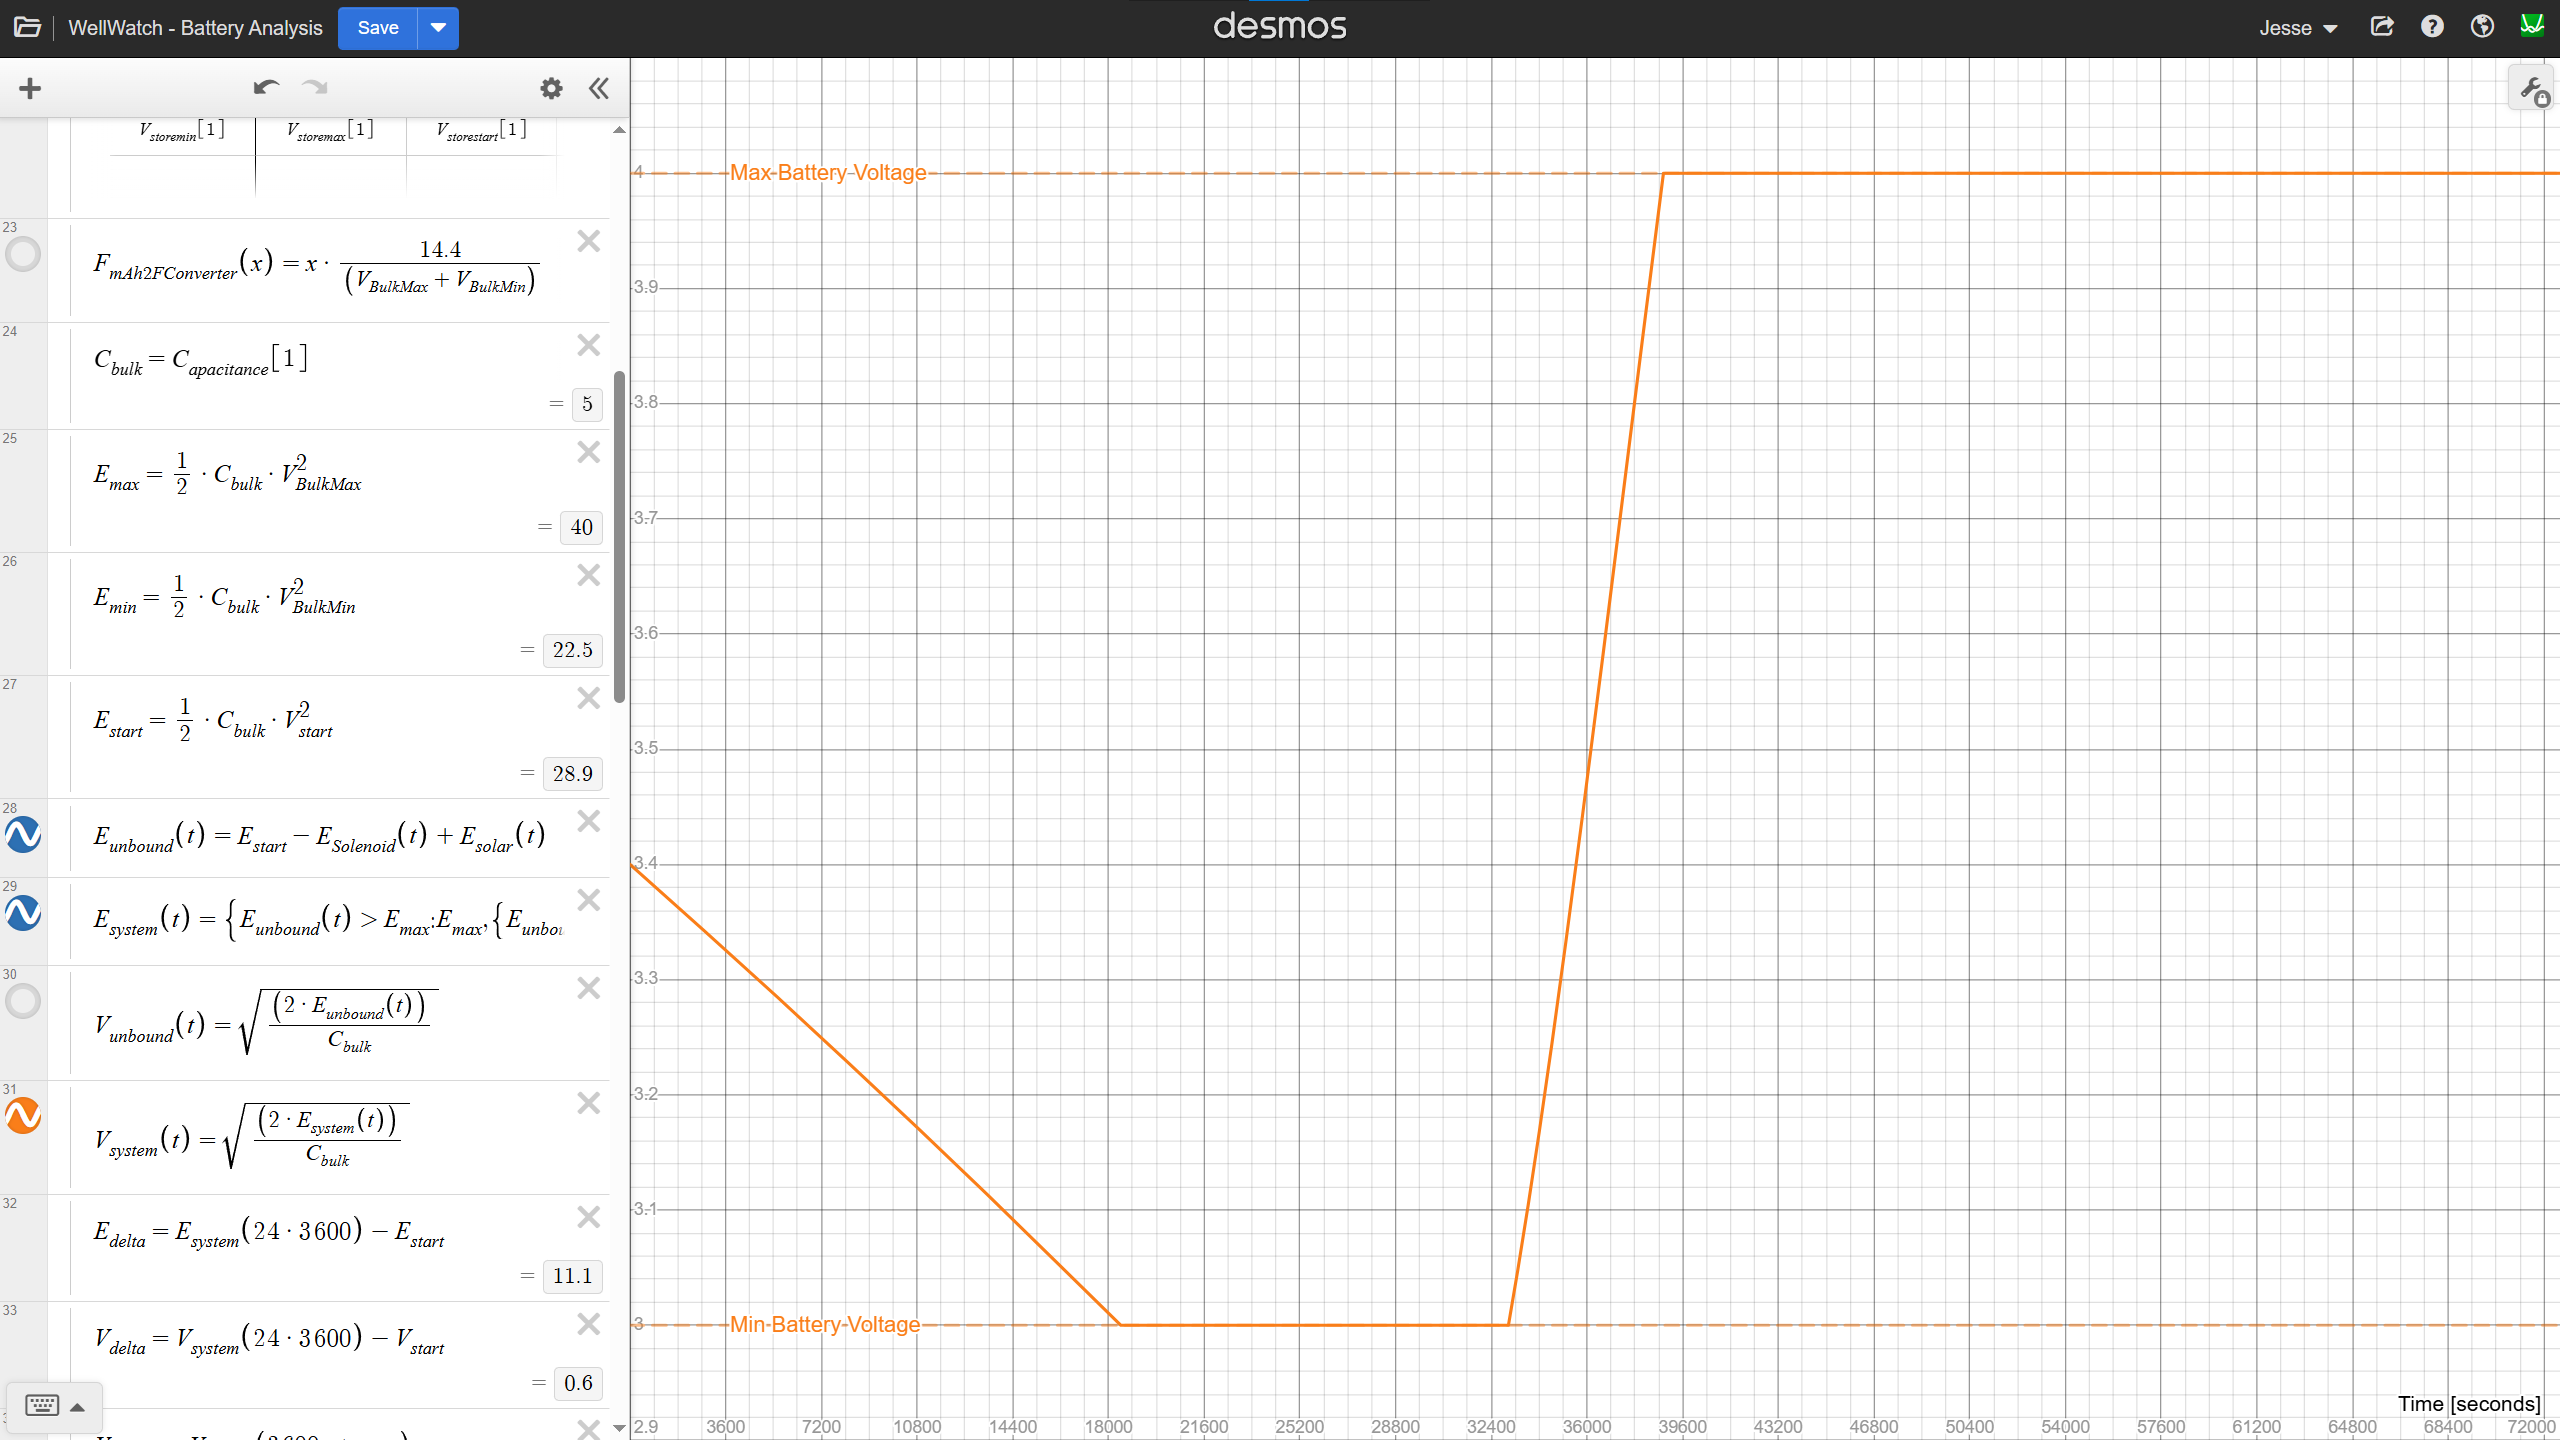
We can then easily calculate the voltage on the battery using stored energy waveform.
![]()
A Modeling Caveat
It’s important to recognize a limitation of the Desmos model: once the energy waveform exceeds the physical bounds, all subsequent values are invalid. This is because the Desmos plots are based on unbounded energy calculations and don’t include voltage clamping. The clamping is only as a visual reminder for the user.
![]()
Excel Port and Model Validation
Later the same day, I ported the tool to excel. This made calculating energy much easier (numeric integration is simple in Excel), and allowed me to resolve the limitation mentioned above. Based on the Desmos model, I expected the following:
- Shutdown point at 11,934 s – solenoid drain with no solar input
- Start of charging at 29,798 s – solar power begins to exceed load
- Peak energy at ??? s – hard to estimate without Excel
- Start of discharge at 49,401 s – solar output falls below demand
The Excel model successfully reproduced these key transitions and also revealed two previously unclear boundaries.
![]()
Using the ModelWith the model built, I ran a simulation using a 10 F Li-Ion capacitor. The key parameters were:
- Vmax: 4.2 V
- Vmin: 2.5 V
- C: 10 F
The capacitor is assumed to start halfway between its voltage limits. Solar parameters remain unchanged, as listed below.
- Sunrise: 7 AM
- Sunset: 5 PM
- Max irradiance: 800 W/m²
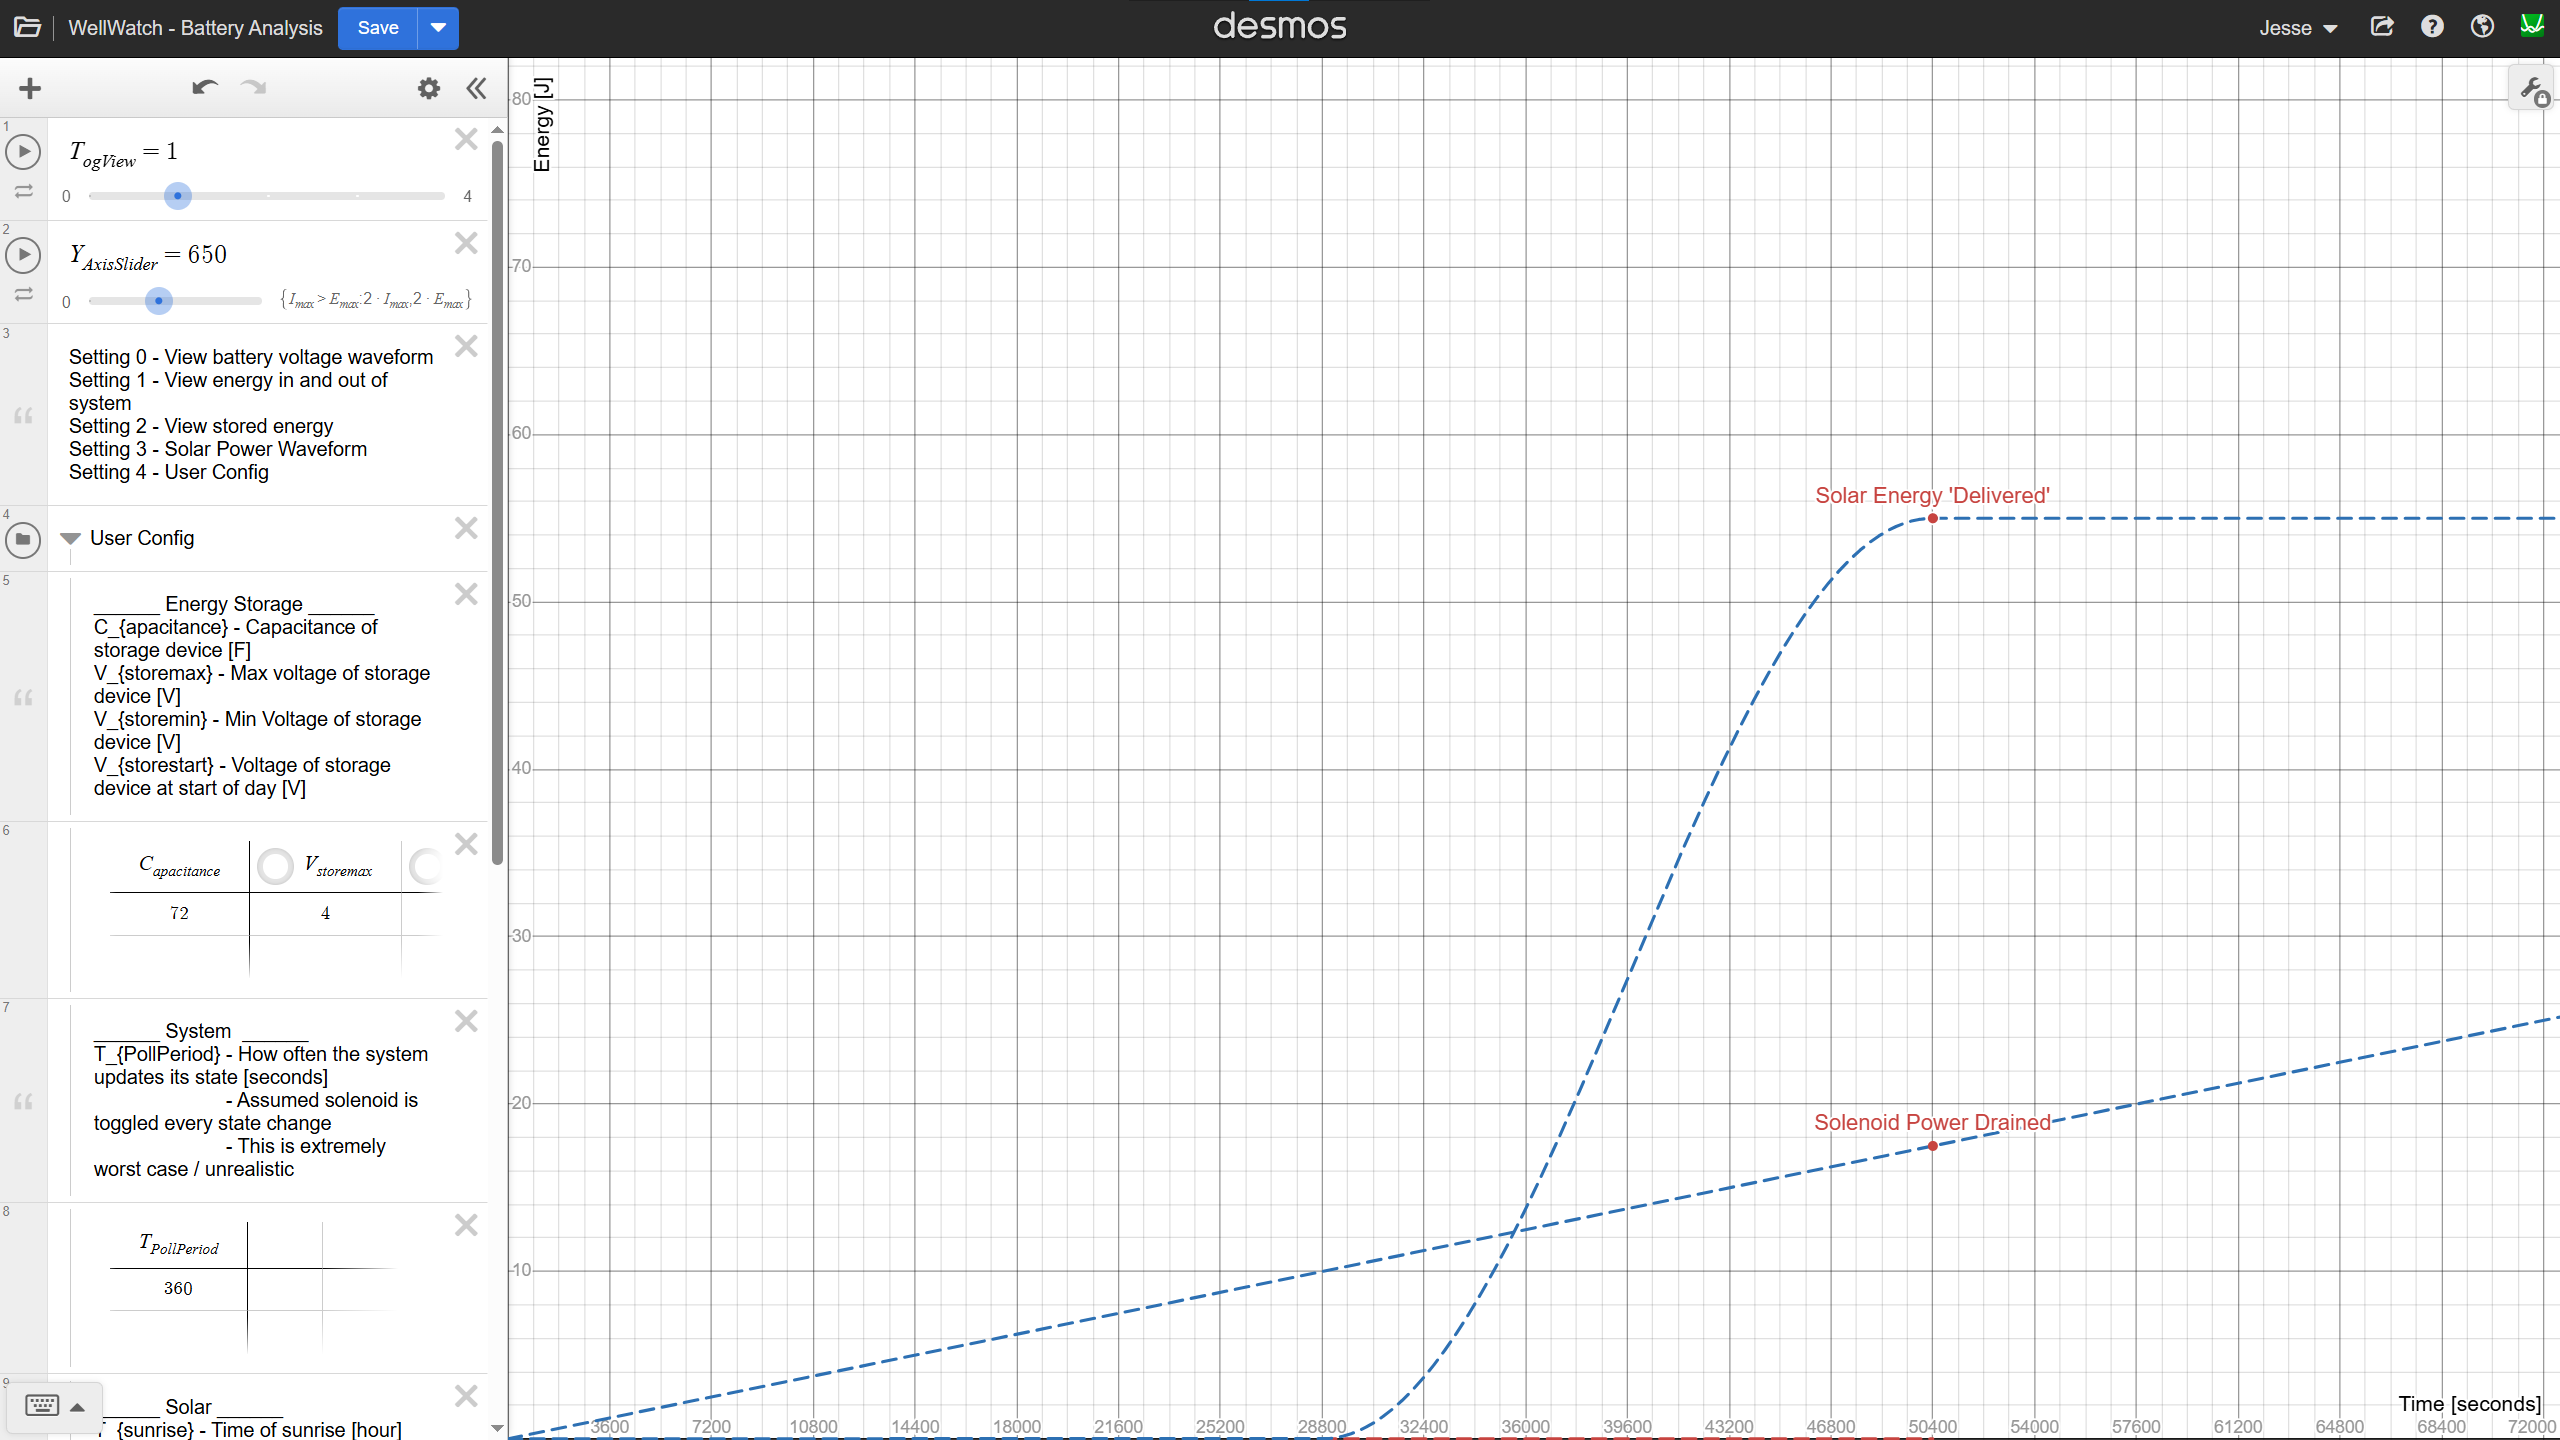
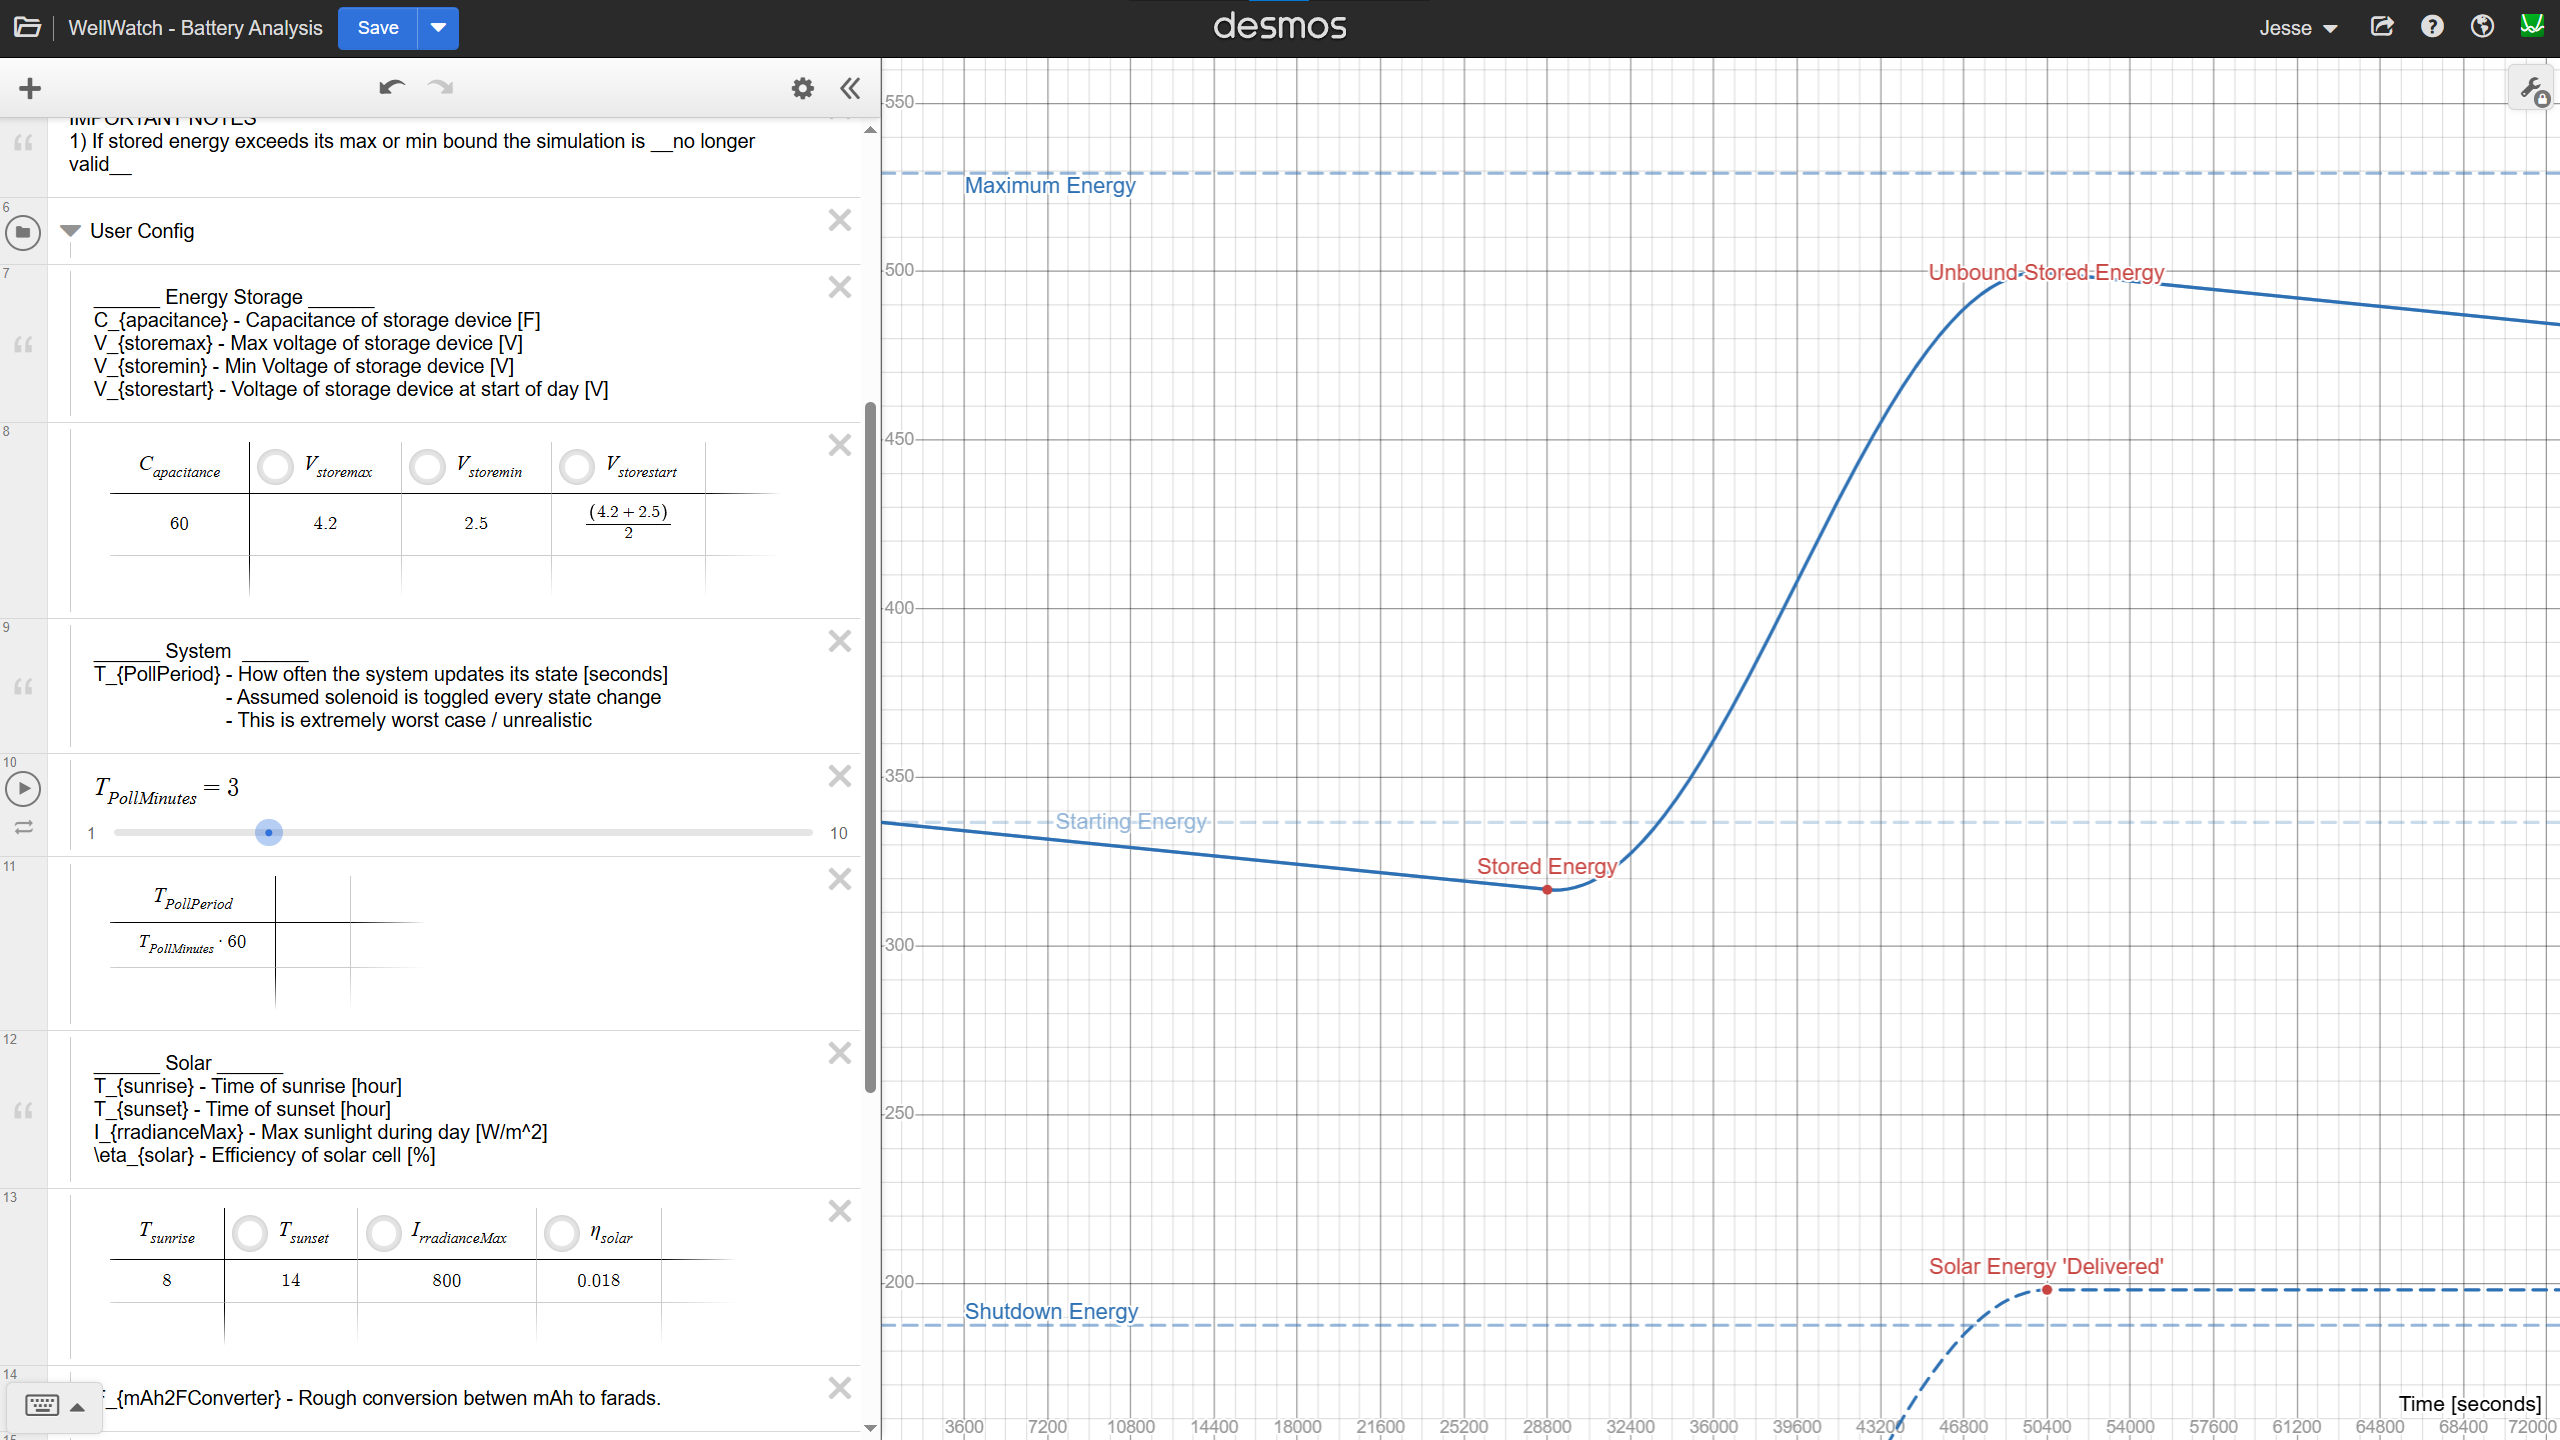
![]()
Clipping and Load Adjustment
The stored energy waveform is clearly clipped. This happens when the solenoid subsystem draws more energy than the solar panel & energy storage can provide, causing the voltage to hit its lower limit.
To fix this, I increased the system update period from once per minute to once every 3 minutes. This reduces the average power consumption of the solenoid subsystem and prevents clipping on the low end.
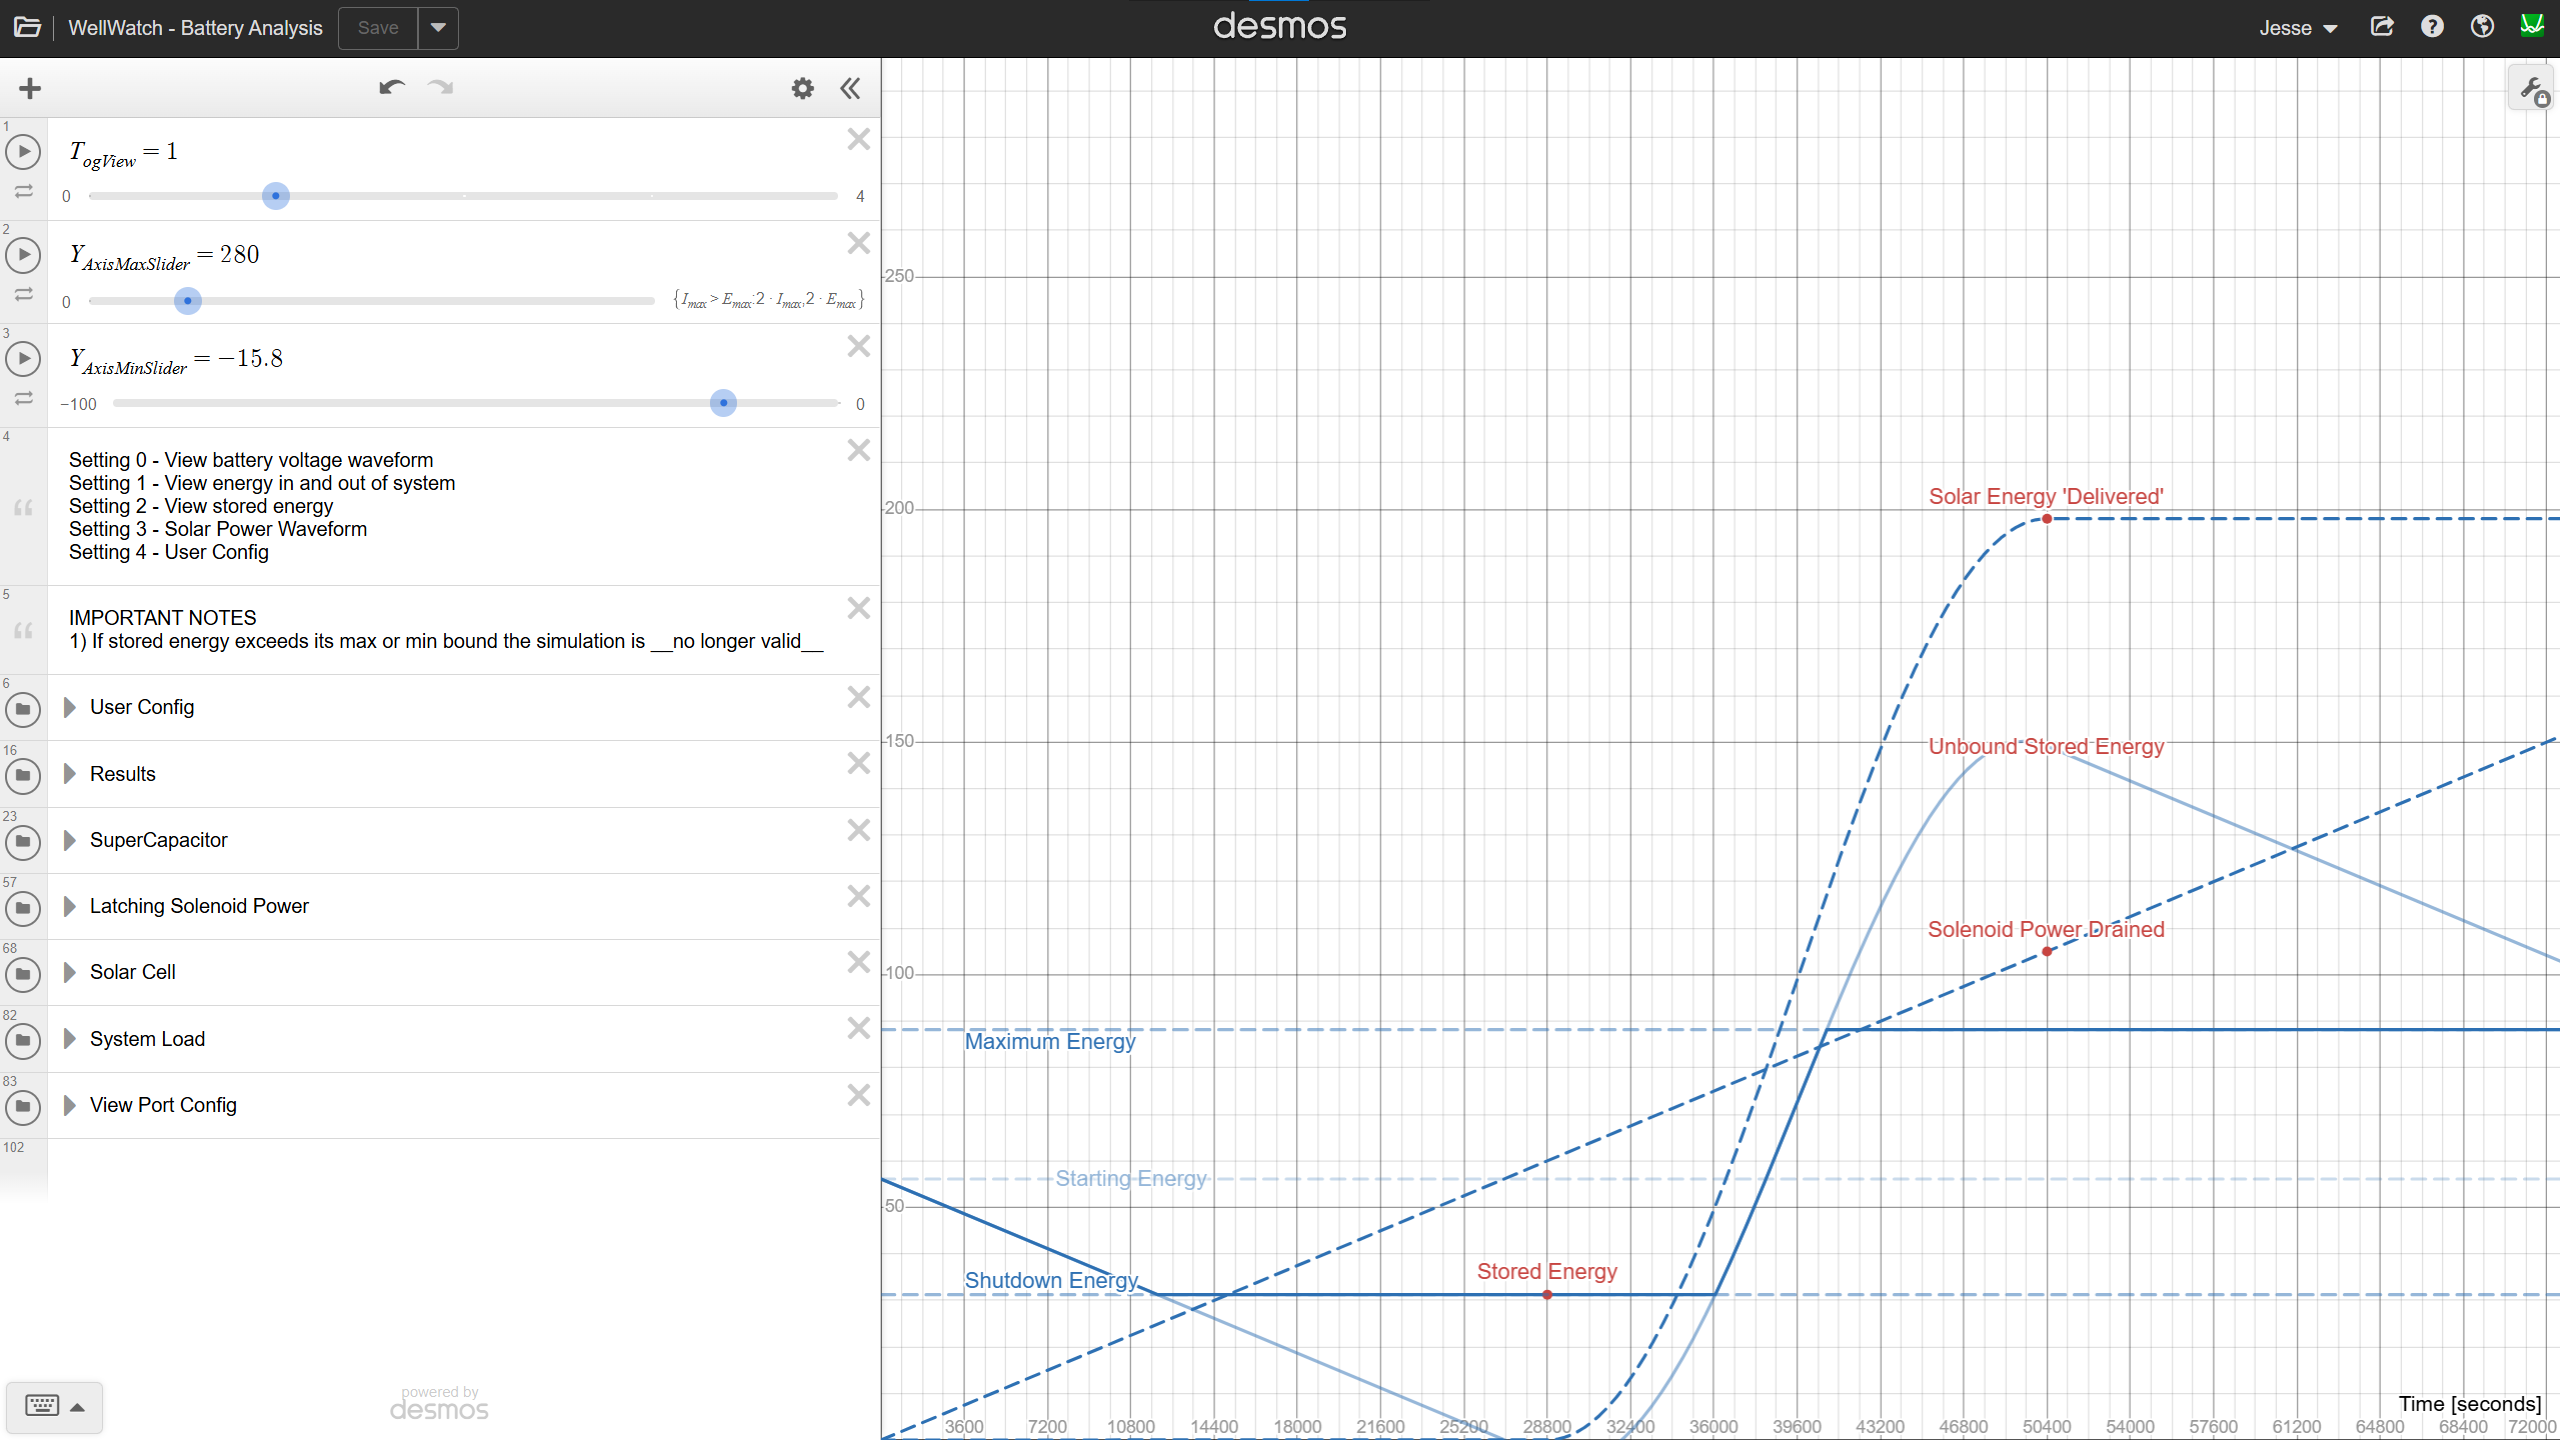
However, this change introduces, or more accurately highlights, a large amount of wasted energy. The curve overshoots the capacitor's maximum energy capacity. We can reduce the amount of wasted energy by either increasing the maximum voltage of our storage device, or by increasing its capacitance.
![]()
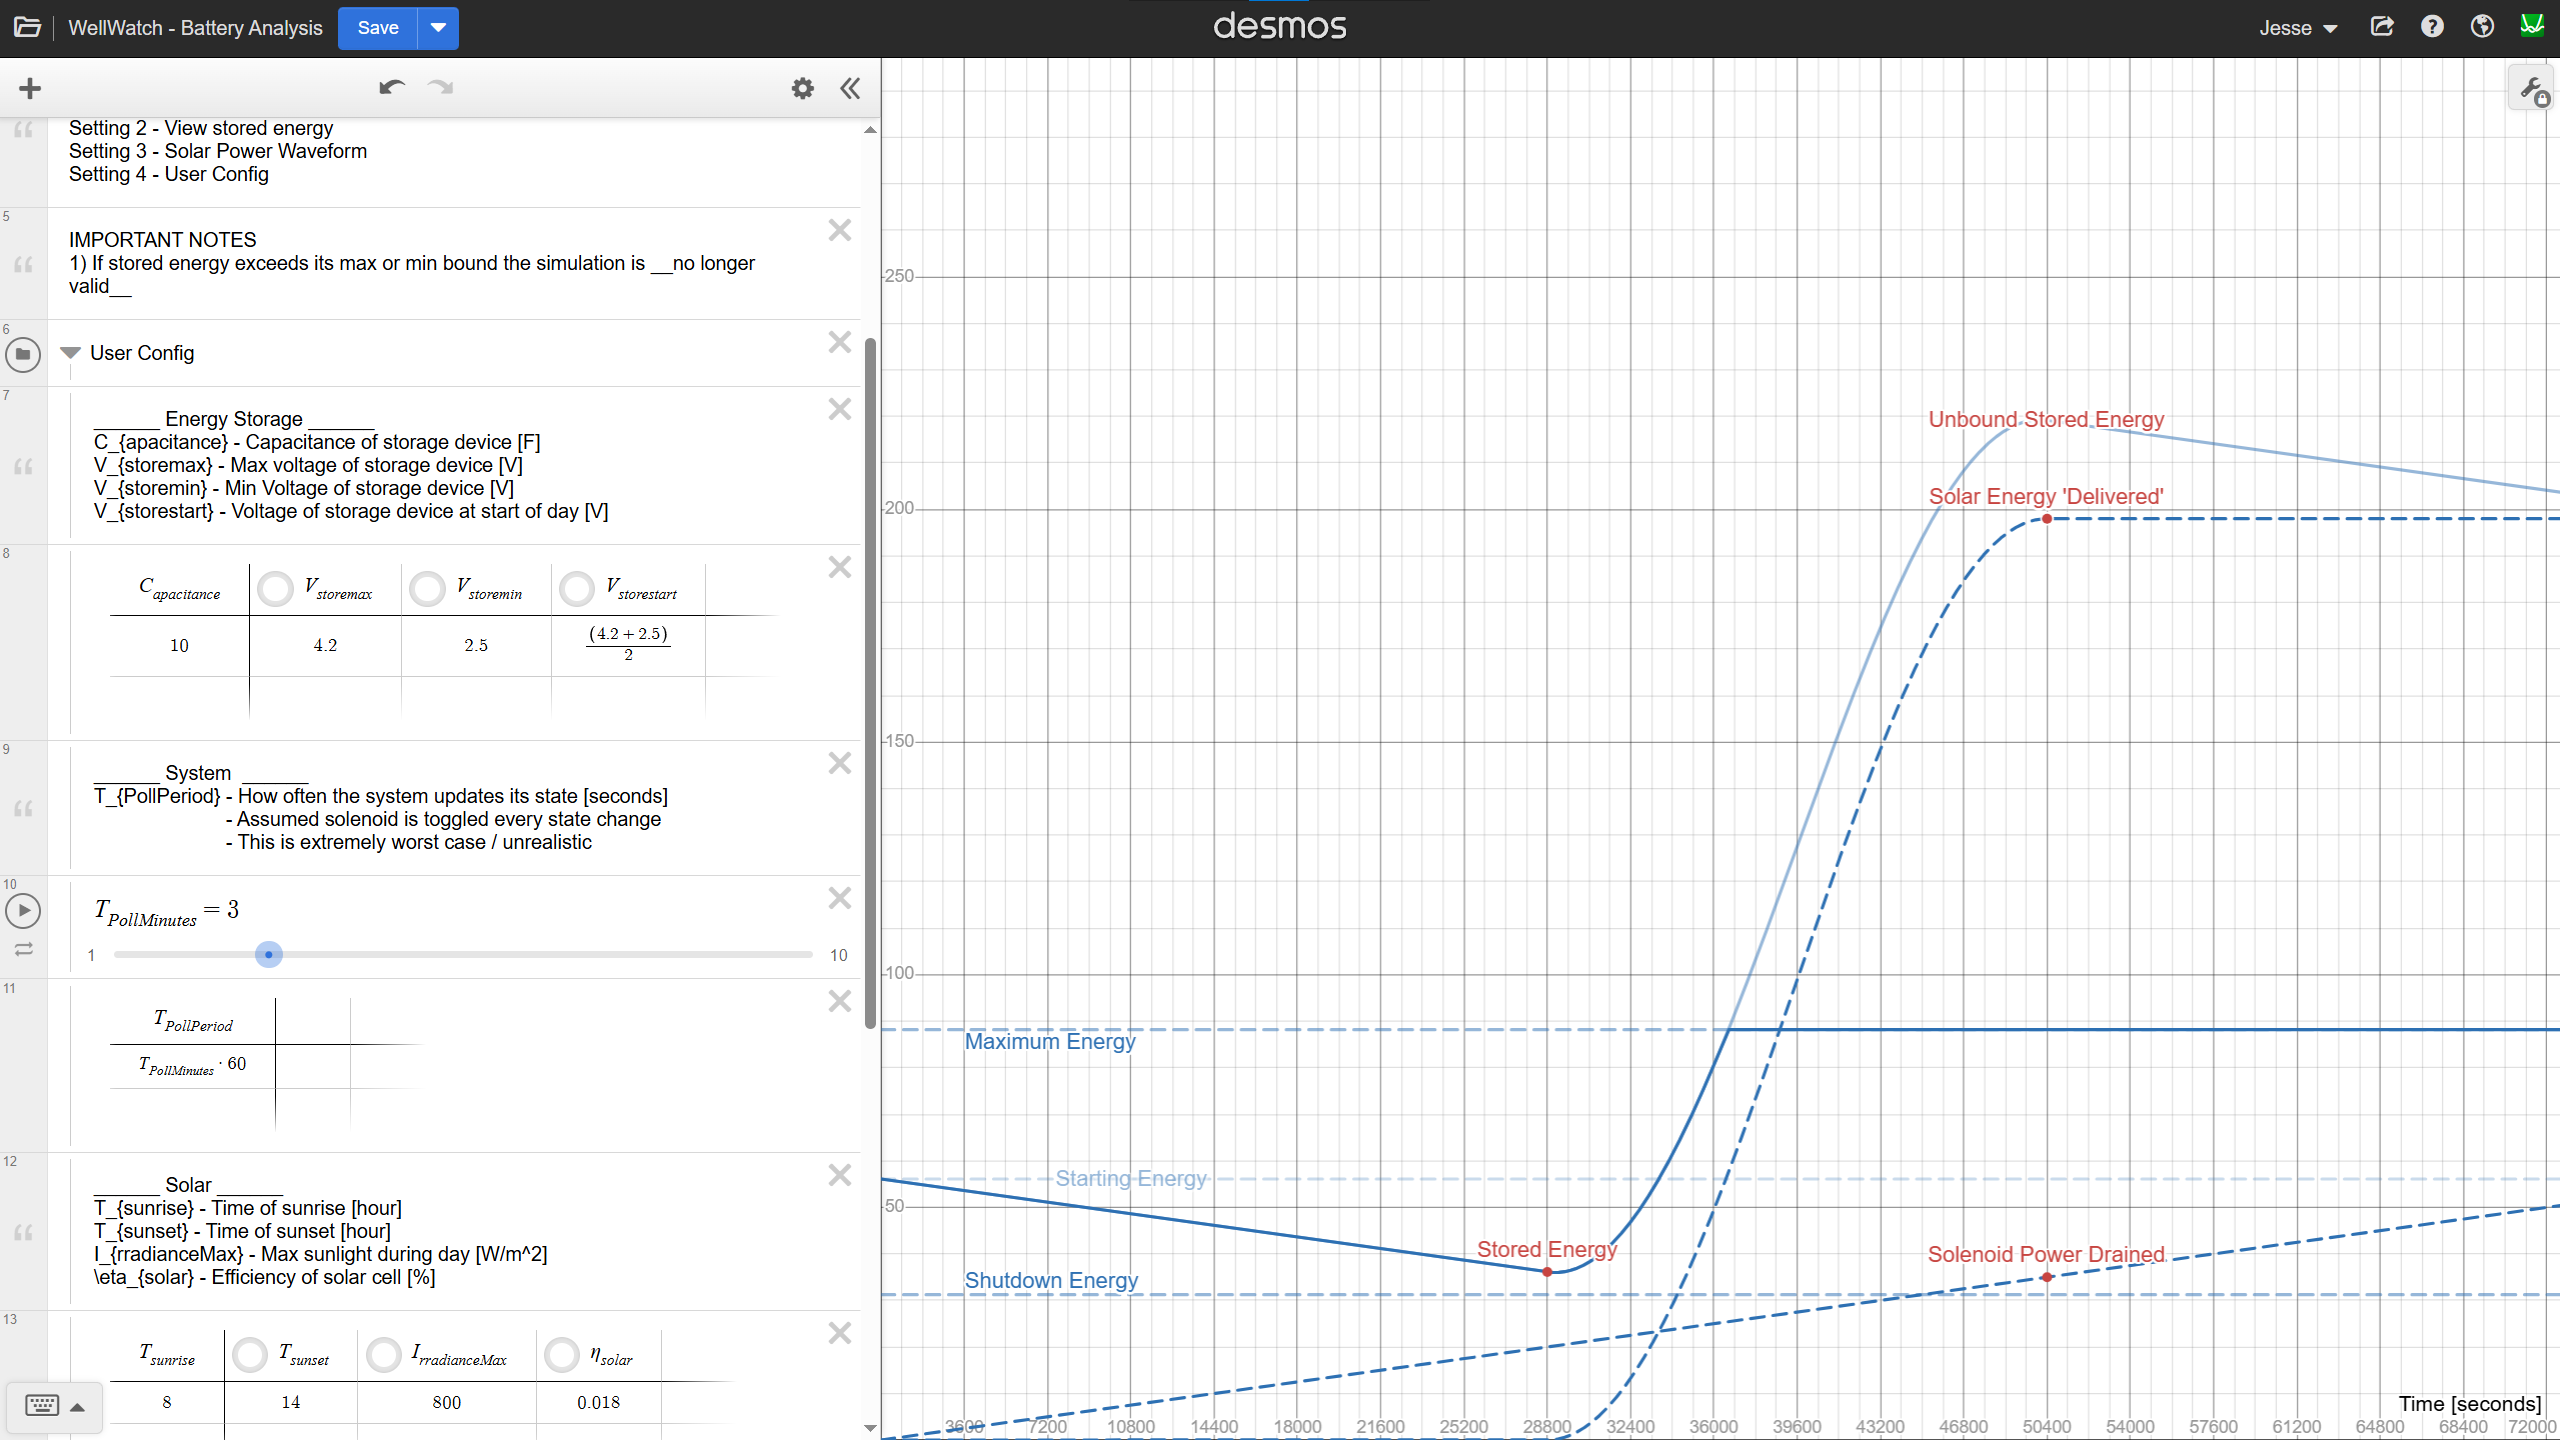
Reminder – Once the stored energy waveform exceeds its maximum or minimum, subsequent results should be considered invalid. The true waveform is shown below.
![]()
Scaling Capacitance
To eliminate clipping without wasting energy, I increased the capacitance
Since the maximum voltage is relatively fixed, we will instead increase the capacitance. At 60 F, the system can now store all excess energy during the day.
![]()
Note – Because the capacity has increased, so has the minimum, maximum and starting energy. As a result, the entire graph has shifted upwards on the y-axis.
Worst-Case Scenario
The results so far seemed promising, so it was time we stress the system. How long will the device last if it’s in a very poorly lit environment 100W/m^2 assuming 4V starting voltage. I’ll compare the result to a 400mAh battery.
- 60F Capacitor: ~8 Days
- 400mAh Battery: >100 Days
Conclusion & Future Work
Under ideal conditions, a 50 F to 100 F Li-Ion capacitor is sufficient to store most or all of the energy generated in a single sunny day. However, this is not enough to store surplus energy across multiple sunny days, and energy reserves are quickly depleted if sunlight is scarce.
Future work.
I have some follow-up actions as a result of this analysis.
- Add remaining system loads (e.g. MCU, sensors, various quiescent)
- Factor in energy harvester efficiency and boost efficiency
- Re-evaluate how many days of operation without sun are “enough”
For now, Li-Ion capacitors seem a viable option, but I’ll hold off on final judgment until the full system profile is modeled.
-
Enclosure Design
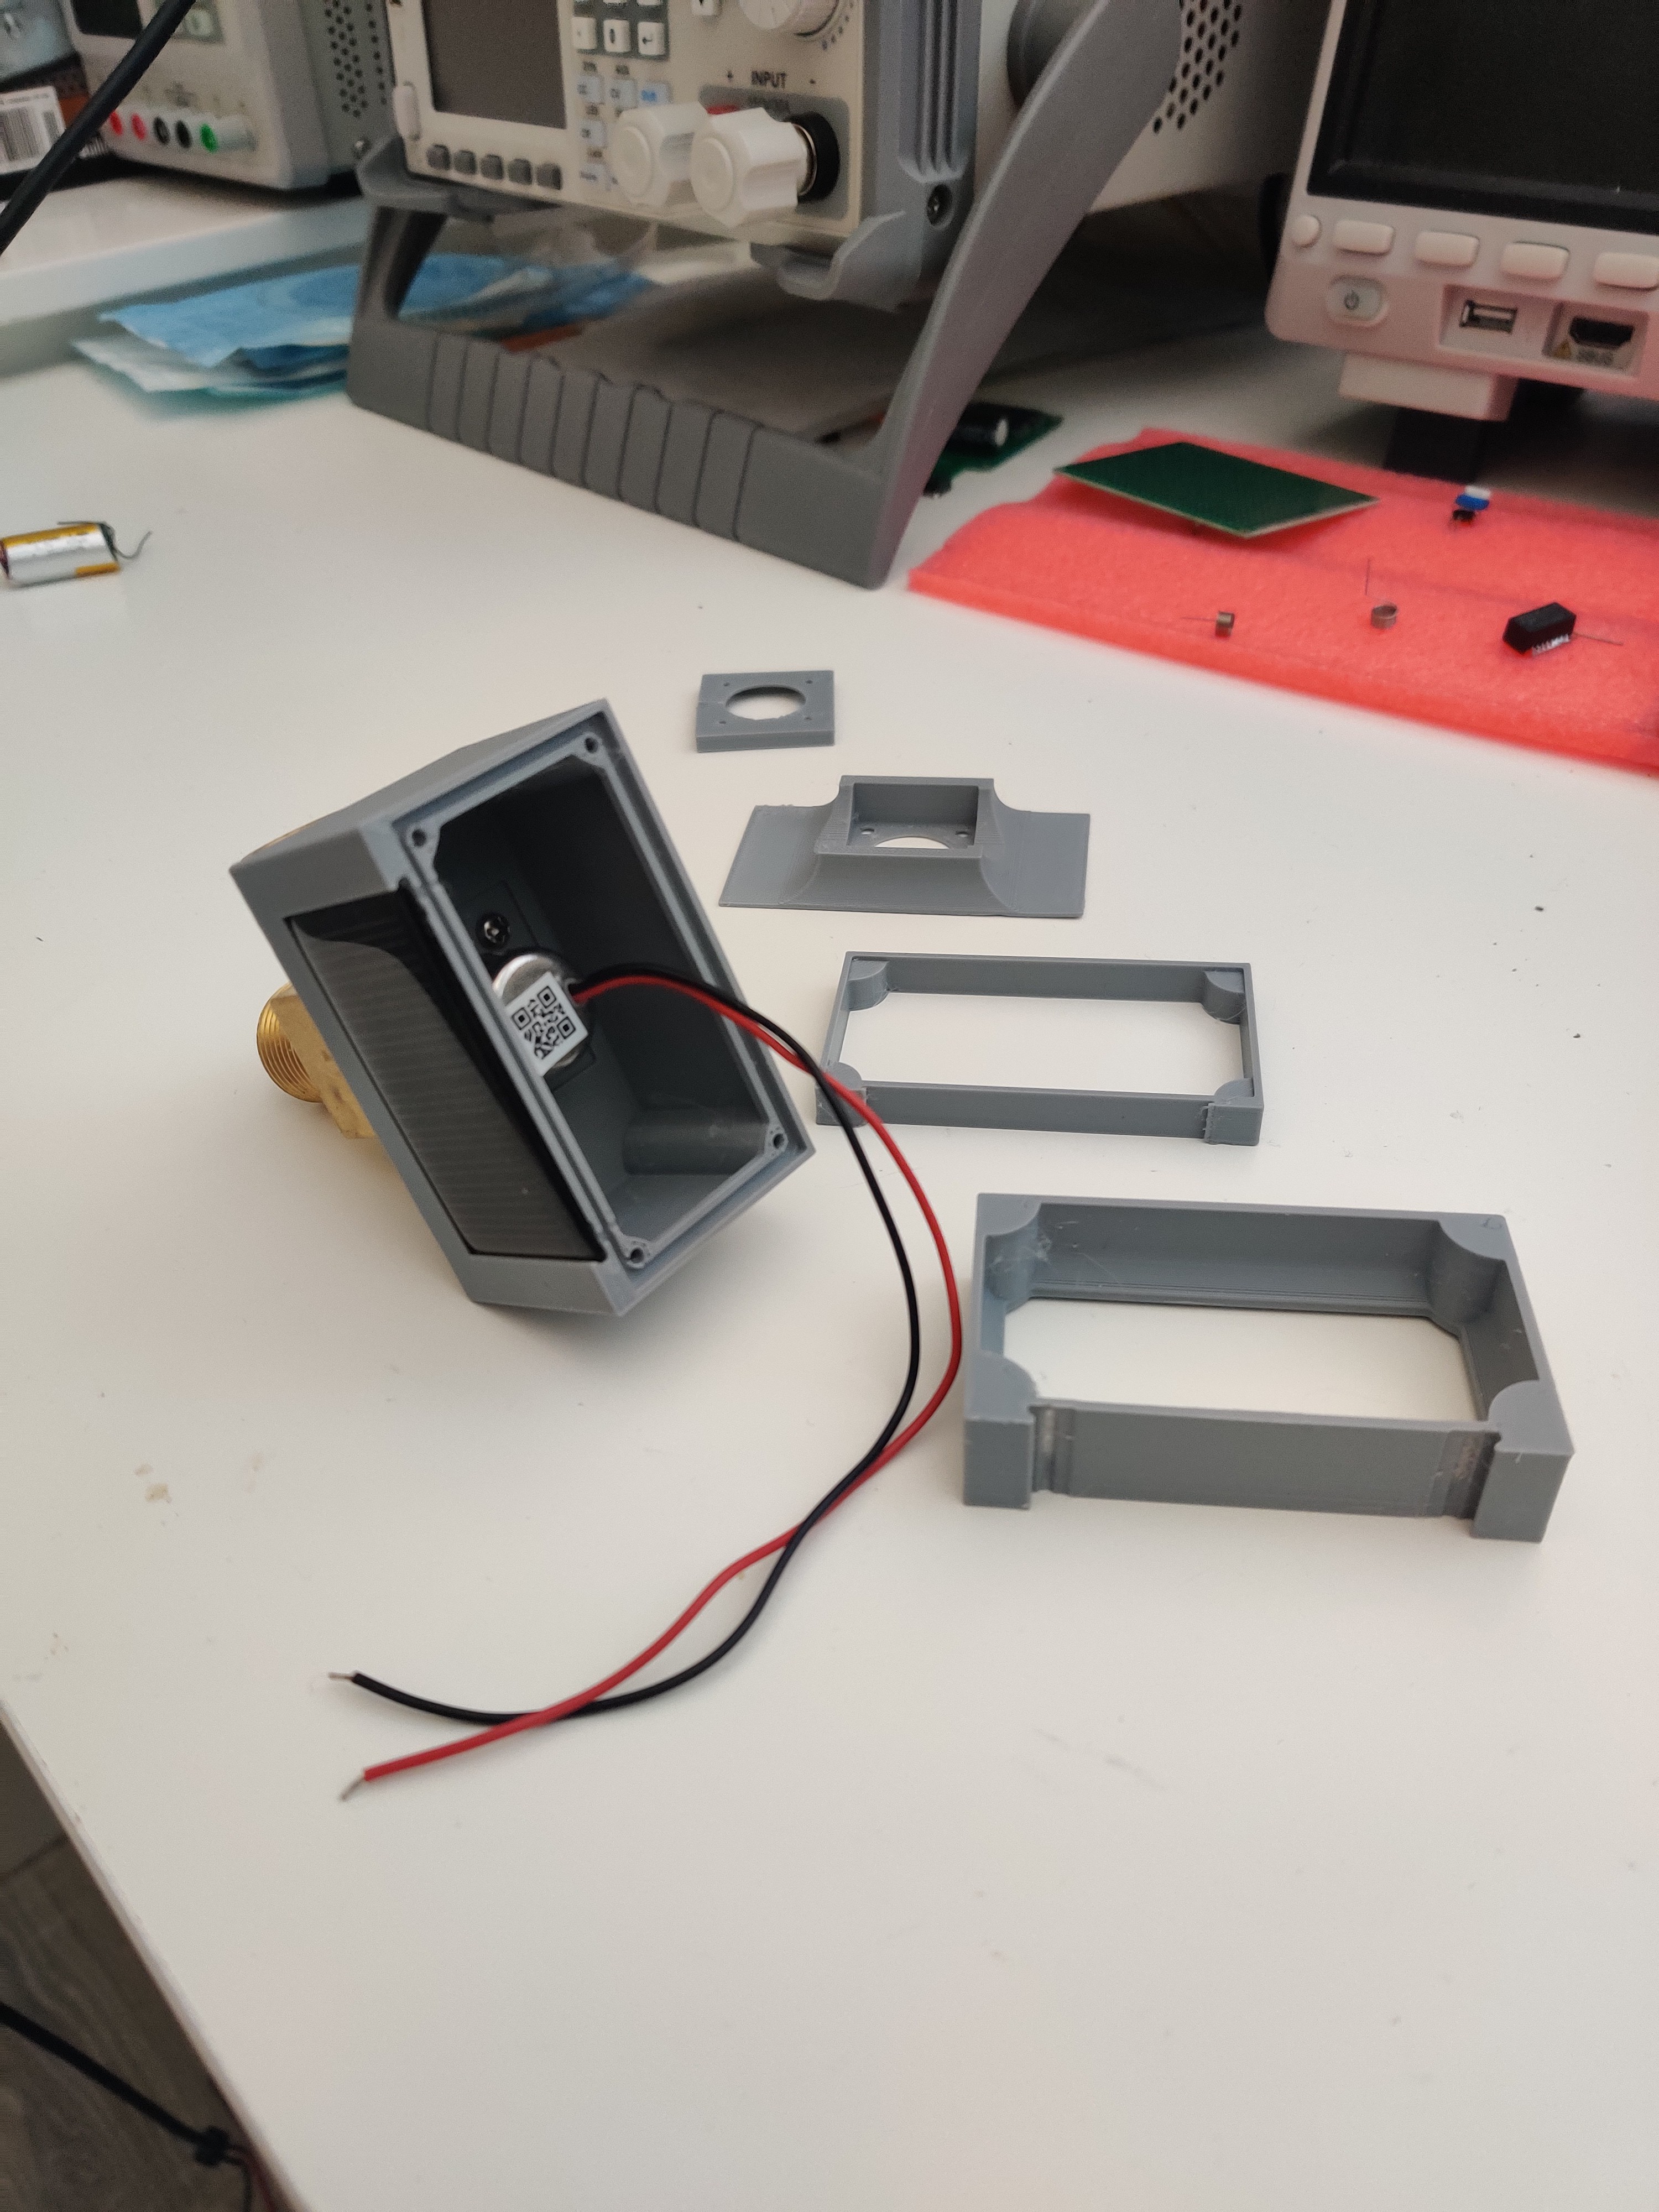
08/03/2024 at 16:36 • 0 commentsI've been working on the REV1 enclosure and had to brush off some old CAD skills. Whenever I do 3D modeling I try to do lots of simple test prints... Measure once, print twice I guess. It's much faster than printing the final enclosure and really helps tighten up the design feedback loop. Below are 4 simple test prints, followed by the first prototype of the full enclosure.
![]()
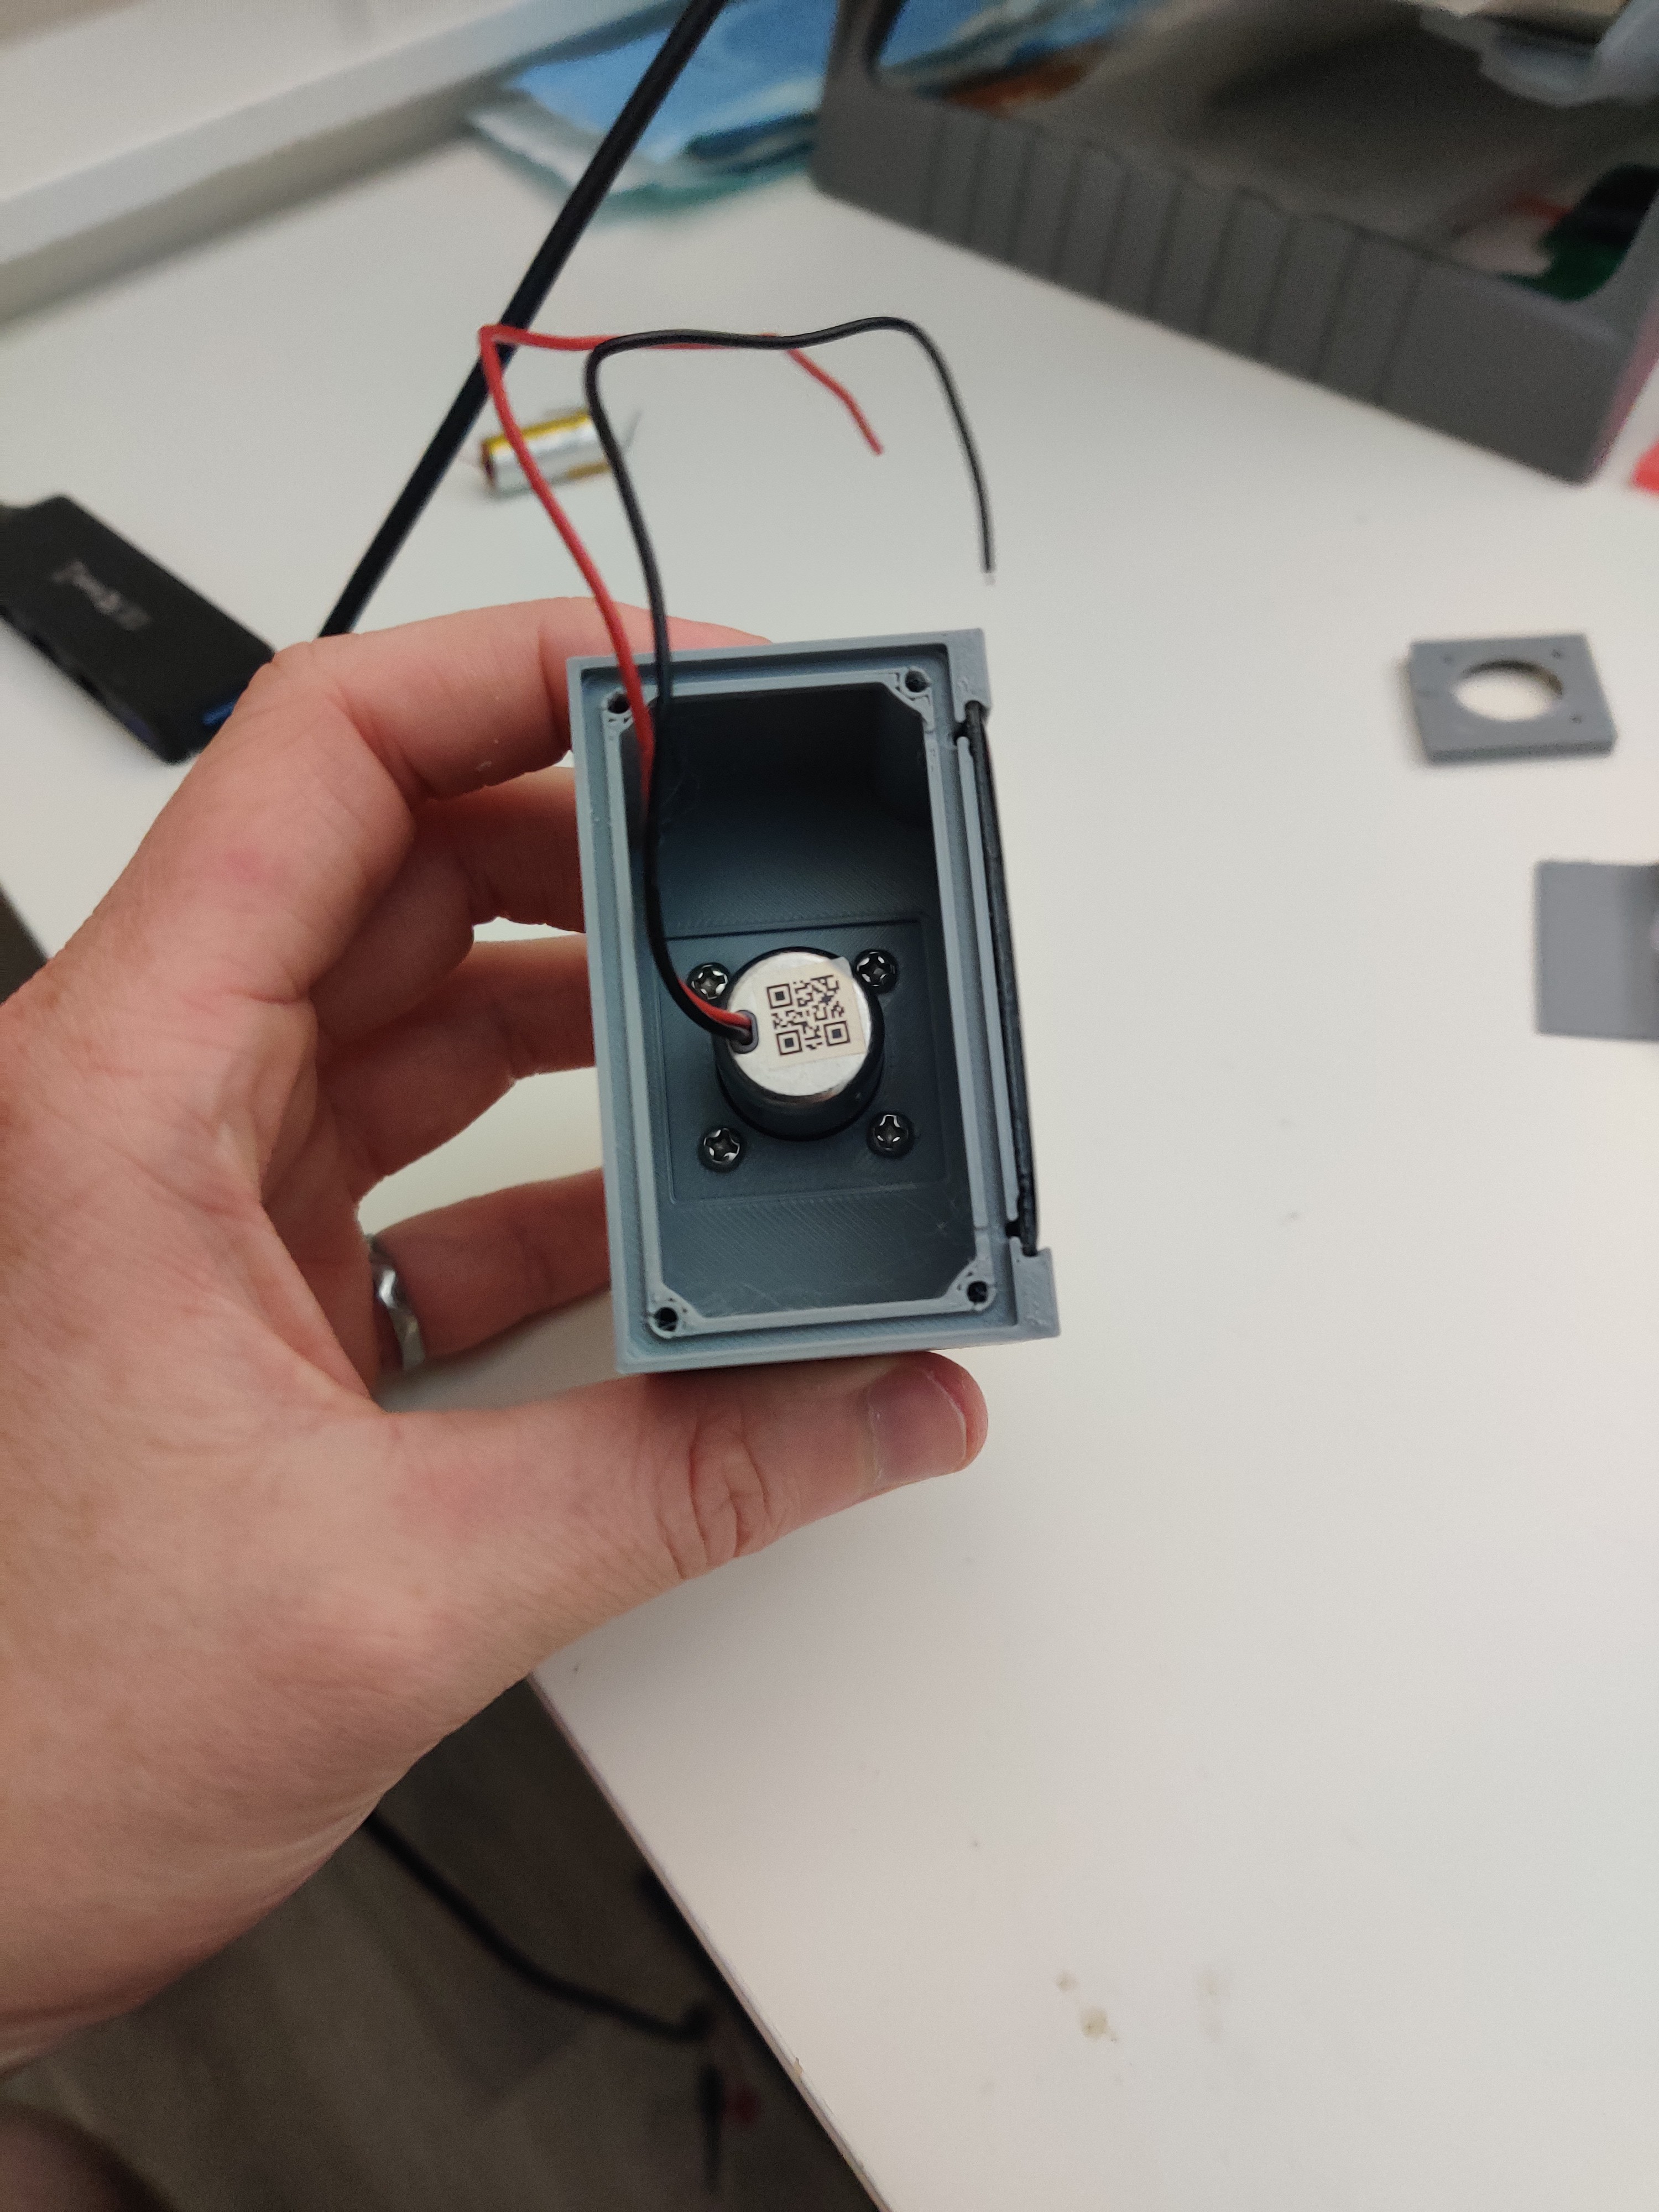
The enclosure will need to be water tight. Water might leak at the (1) lid-case interface, (2) solenoid-case interface, and (3) through the case itself. To avoid (1) I'd like to use either a o-ring or some type of silicone/epoxy in the groove along the top of the case. For (2) I can easily put an o-ring around the base of the solenoid. And to avoid (3) I'll need to coat the cavity with some kind of a sealant, since PLA isn't exactly water tight.
![]()
Solar Solenoid Controller - WellWatch
Welcome to the most painfully niche thing I've created.


